

Classification of left and right-hand motor imagery in acute stroke patients using EEG microstate
- PMID: 40533772
- PMCID: PMC12178014
- DOI: 10.1186/s12984-025-01668-y
Classification of left and right-hand motor imagery in acute stroke patients using EEG microstate
Abstract
Background: Stroke is one of the leading causes of adult disability, often resulting in motor dysfunction and brain network reorganization. Brain-computer interface (BCI) systems offer a novel approach to post-stroke motor rehabilitation, with motor imagery (MI) serving as a key paradigm that requires decoding left and right-hand MI differences to optimize system performance. However, the neural dynamics underlying these differences, especially from the perspective of Electroencephalography(EEG) microstate, remain poorly understood in acute stroke patients.
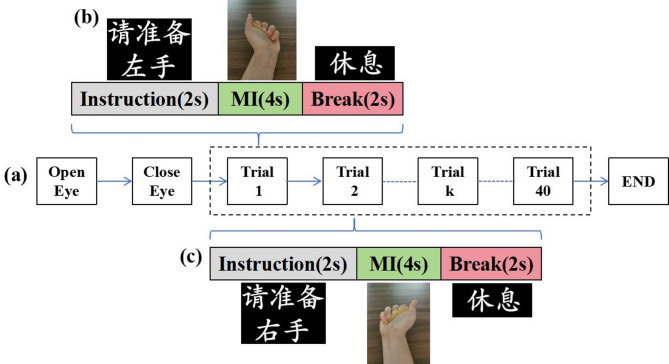
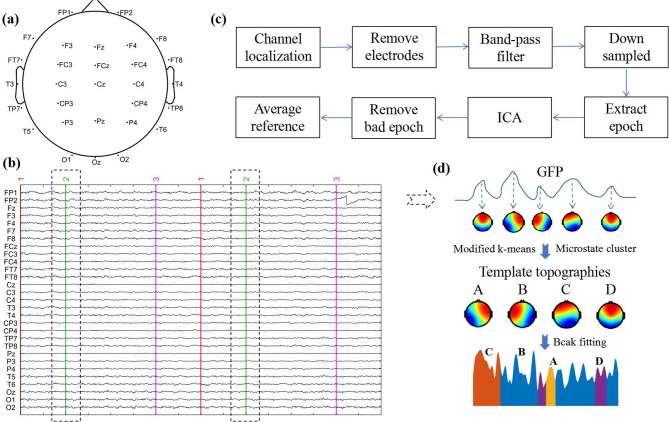
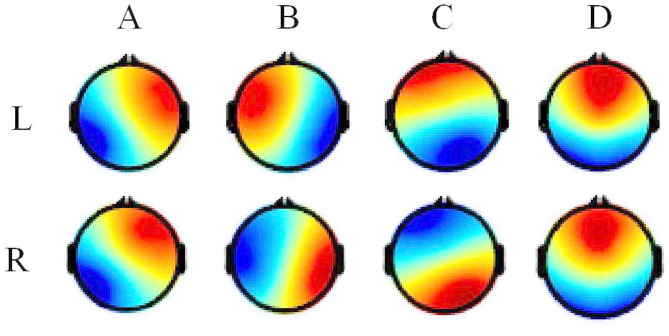
Methods: This study enrolled 14 acute stroke patients and recorded their EEG data during left and right-hand MI tasks. Four EEG microstate (A, B, C, and D) were analyzed to extract temporal feature parameters, including Duration, Occurrence Coverage, and transition probabilities(TP). Significant features were used to construct classification models using Linear Discriminant Analysis(LDA), Support Vector Machines(SVM), and K-Nearest Neighbors(KNN) algorithms.
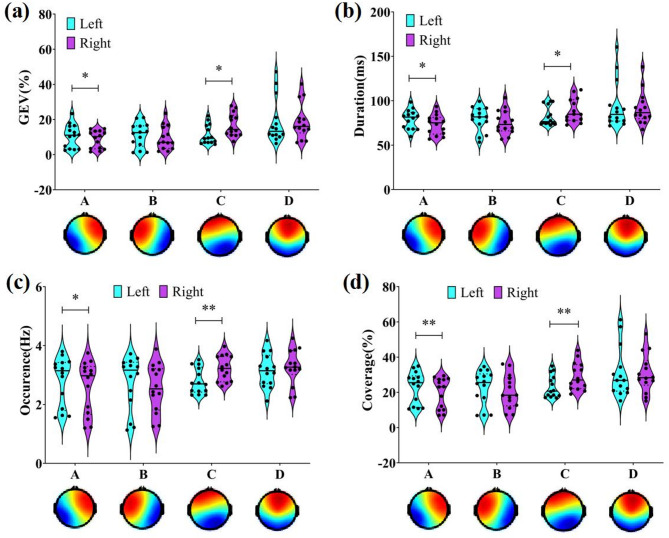
Results: Microstate analysis revealed significant differences in temporal features of microstate A and C during left and right-hand MI tasks. During left-hand MI, microstate A exhibited longer Duration(Pfdr=0.032), higher Occurrence(Pfdr=0.018), and greater Coverage(Pfdr=0.004) compared to the right-hand, whereas microstate C showed the opposite pattern(Pfdr=0.044, Pfdr=0.004, Pfdr=0.004). Additionally, the TP from microstate B→A, D→A and D→C also demonstrated significant differences(Pfdr=0.04, Pfdr<0.001, Pfdr=0.006). Among classification models, the KNN algorithm achieved the highest accuracy of 75.00%, outperforming LDA and SVM. Fisher analysis indicated that the Occurrence of microstate C was the most discriminative feature for distinguishing between left and right-hand MI tasks in acute stroke patients.
Conclusion: Differences in EEG microstate features during left and right-hand MI tasks in acute stroke patients may reflect lateralized mechanisms of brain network reorganization. Microstate features hold significant potential for both post-stroke brain function assessment and the optimization of BCI systems. These features could enhance adaptive BCI strategies in acute stroke rehabilitation.
Keywords: Acute stroke; Brain network dynamics; Brain-Computer interface; EEG microstate; Motor imagery.
© 2025. The Author(s).
Conflict of interest statement
Declarations. Ethics approval and consent to participate: Not applicable. Consent for publication: Not applicable. Competing interests: The authors declare no competing interests.
Figures


Similar articles
-
Characterization and classification of kinesthetic motor imagery levels.J Neural Eng. 2024 Jul 24;21(4). doi: 10.1088/1741-2552/ad5f27. J Neural Eng. 2024. PMID: 38963179
-
Artificial intelligence based BCI using SSVEP signals with single channel EEG.Technol Health Care. 2025 Jul;33(4):1905-1916. doi: 10.1177/09287329241302740. Epub 2025 Feb 5. Technol Health Care. 2025. PMID: 39973870
-
Uncovering Low-Dimensional Manifolds of Neural Dynamics for Motor-Imagery Based Stroke Rehabilitation: An EEG-Based Brain-Computer Interface Study.IEEE Trans Neural Syst Rehabil Eng. 2025;33:3281-3292. doi: 10.1109/TNSRE.2025.3600824. IEEE Trans Neural Syst Rehabil Eng. 2025. PMID: 40833894
-
Enhancing motor imagery EEG signal decoding through machine learning: A systematic review of recent progress.Comput Biol Med. 2025 Feb;185:109534. doi: 10.1016/j.compbiomed.2024.109534. Epub 2024 Dec 12. Comput Biol Med. 2025. PMID: 39672015
-
EEG-Based BCIs on Motor Imagery Paradigm Using Wearable Technologies: A Systematic Review.Sensors (Basel). 2023 Mar 3;23(5):2798. doi: 10.3390/s23052798. Sensors (Basel). 2023. PMID: 36905004 Free PMC article.
References
-
- Feigin VL et al. Jan., World Stroke Organization (WSO): Global Stroke Fact Sheet 2022, Int J Stroke, vol. 17, no. 1, pp. 18–29, 2022, 10.1177/17474930211065917 - PubMed
-
- Min B-K, Marzelli MJ, Yoo S-S. Neuroimaging-based approaches in the brain-computer interface. Trends Biotechnol. Nov. 2010;28(11):552–60. 10.1016/j.tibtech.2010.08.002. - PubMed
MeSH terms
Grants and funding
- 221100310500/the Major Science and Technology Projects of Henan Province
- 82302298/the National Natural Science Foundation of China
- 82201709/the National Natural Science Foundation of China
- 24IRTSTHN042/Innovative Research Team (in Science and Technology) in University of Henan Province
- XTkf01/the Open Project Program of Henan Collaborative Innovation Center of Prevention and Treatment of Mental Disorder
LinkOut - more resources
Full Text Sources
Medical
