

k-mer-based GWAS in a wheat collection reveals novel and diverse sources of powdery mildew resistance
- PMID: 40533797
- PMCID: PMC12175386
- DOI: 10.1186/s13059-025-03645-z
k-mer-based GWAS in a wheat collection reveals novel and diverse sources of powdery mildew resistance
Abstract
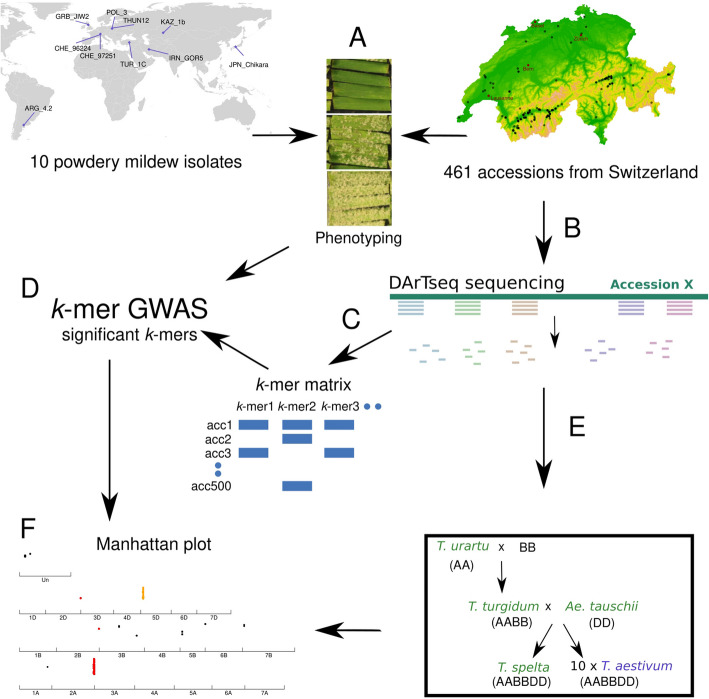
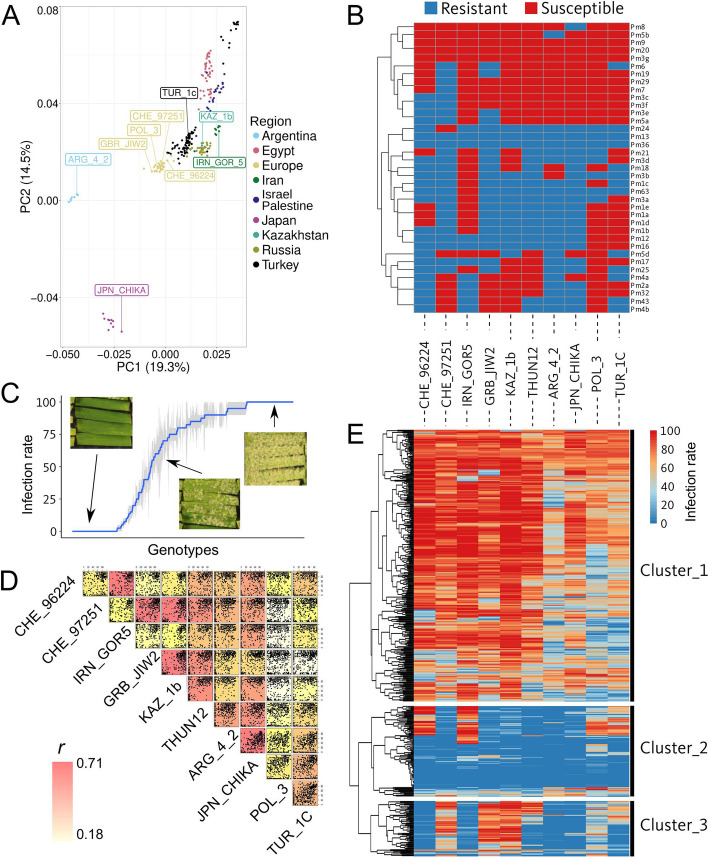
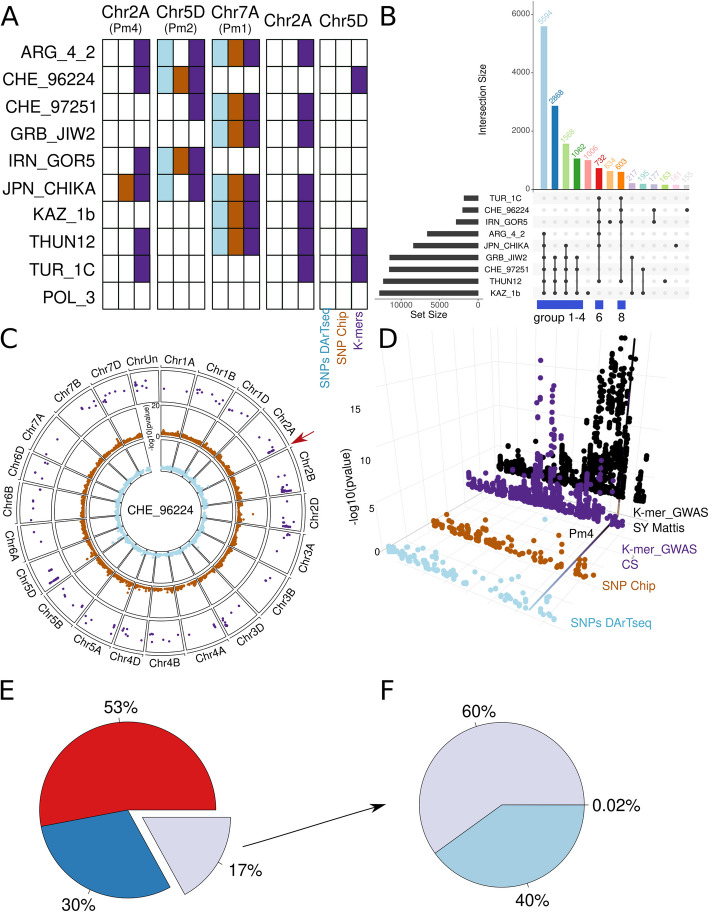
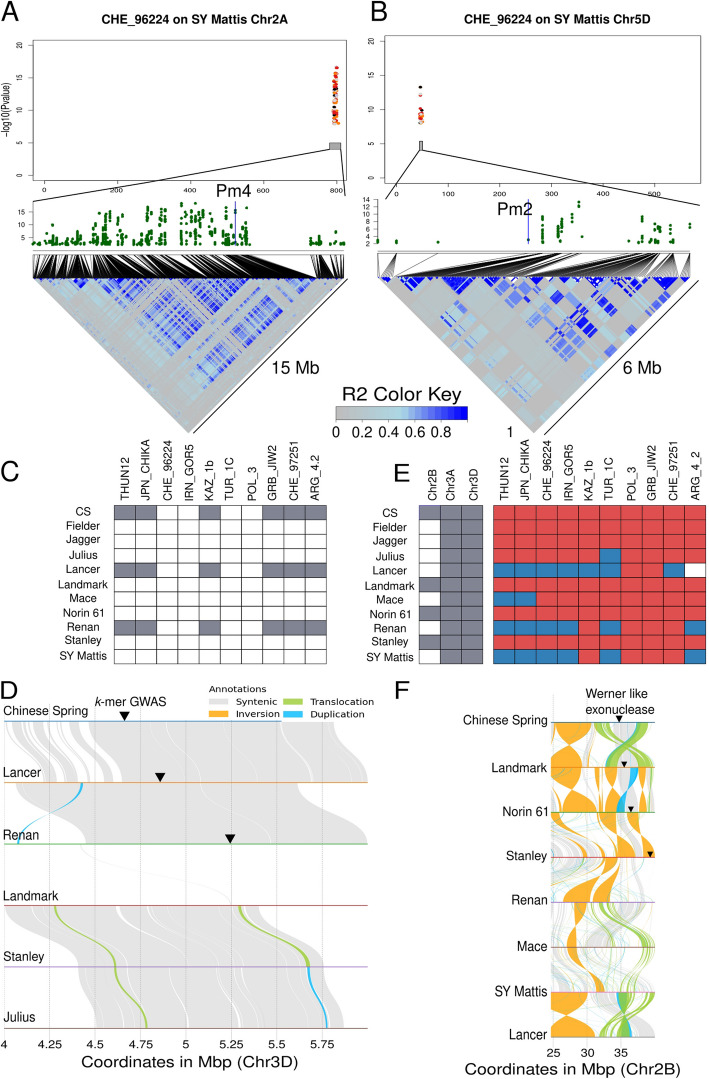
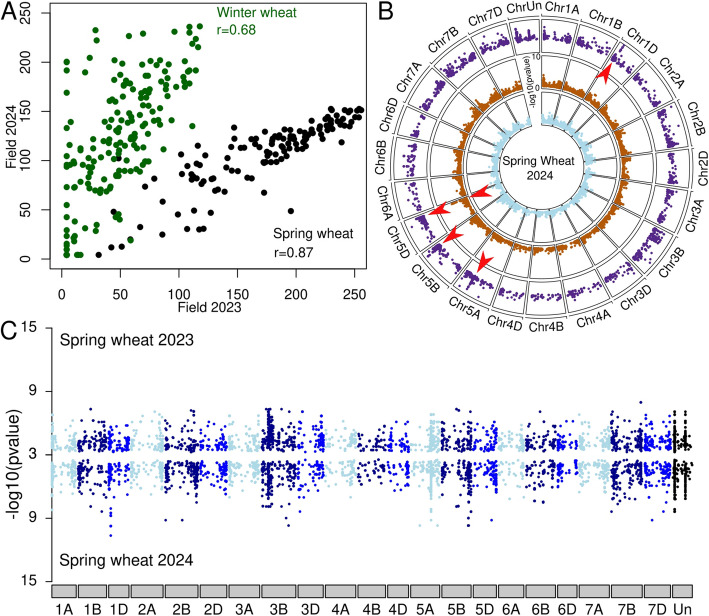
Wheat genetic resources hold the diversity required to mitigate agricultural challenges from climate change and reduced inputs. Using DArTseq, we genotype 461 wheat landraces and cultivars and evaluate them for powdery mildew resistance. By developing a k-mer-based GWAS approach with fully assembled genomes of Triticum aestivum and its progenitors, we uncover 25% more resistance-associated k-mers than single-reference methods, outperforming SNP-based GWAS in both loci detection and mapping precision. In total, we detect 34 powdery mildew resistance loci, including 27 potentially novel regions. Our approach underscores the importance of integrating multiple reference genomes to unlock the potential of wheat germplasm.
© 2025. The Author(s).
Conflict of interest statement
Declarations. Ethics approval and consent to participate: Not applicable. Competing interests: The authors declare no competing interests.
Figures
Similar articles
-
Association studies for leaf rust resistance earmark differential genomic regions for silicon (Si) responsiveness in bread wheat (Triticum aestivum L.).BMC Plant Biol. 2025 Aug 9;25(1):1057. doi: 10.1186/s12870-025-07135-z. BMC Plant Biol. 2025. PMID: 40783725 Free PMC article.
-
Screening of CIMMYT and South Asian Bread Wheat Germplasm Reveals Marker-Trait Associations for Seedling Resistance to Septoria Nodorum Blotch.Genes (Basel). 2024 Jul 7;15(7):890. doi: 10.3390/genes15070890. Genes (Basel). 2024. PMID: 39062669 Free PMC article.
-
Development and application of a cost-effective multiplex Kompetitive Allele-Specific polymerase chain reaction assay for pyramiding resistant genes of fusarium head blight and powdery mildew in wheat.BMC Plant Biol. 2025 Jul 26;25(1):963. doi: 10.1186/s12870-025-07005-8. BMC Plant Biol. 2025. PMID: 40713484 Free PMC article.
-
Unraveling the Intricacies of Powdery Mildew: Insights into Colonization, Plant Defense Mechanisms, and Future Strategies.Int J Mol Sci. 2025 Apr 9;26(8):3513. doi: 10.3390/ijms26083513. Int J Mol Sci. 2025. PMID: 40331988 Free PMC article. Review.
-
Transcriptome analysis of genes related to resistance against powdery mildew in wheat-Thinopyrum alien addition disomic line germplasm SN6306.Gene. 2016 Sep 15;590(1):5-17. doi: 10.1016/j.gene.2016.06.005. Epub 2016 Jun 2. Gene. 2016. PMID: 27265028 Review.
Cited by
-
A high-throughput pipeline for phenotyping, object detection and quantification of leaf trichomes.Theor Appl Genet. 2025 Jul 21;138(8):188. doi: 10.1007/s00122-025-04967-z. Theor Appl Genet. 2025. PMID: 40691381 Free PMC article.
References
-
- Savary S, Willocquet L, Pethybridge SJ, Esker P, McRoberts N, Nelson A. The global burden of pathogens and pests on major food crops. Nat Ecol Evol. 2019;3(3):430–9. - PubMed
-
- Conner RL, Kuzyk AD, Su H. Impact of powdery mildew on the yield of soft white spring wheat cultivars. Can J Plant Sci. 2011. Available from: https://cdnsciencepub.com/doi/10.4141/P03-043. Cited 2024 Jul 4.
-
- European Commission - European Commission. Farm to Fork. 2022. Available from: https://ec.europa.eu/commission/presscorner/detail/en/QANDA_22_3694. Cited 2024 Aug 8.
MeSH terms
Grants and funding
- 862613/European Union's Horizon 2020
- 862613/European Union's Horizon 2020
- 862613/European Union's Horizon 2020
- 862613/European Union's Horizon 2020
- 862613/European Union's Horizon 2020
- 862613/European Union's Horizon 2020
- 862613/European Union's Horizon 2020
- 862613/European Union's Horizon 2020
- 862613/European Union's Horizon 2020
- 862613/European Union's Horizon 2020
- 862613/European Union's Horizon 2020
- 862613/European Union's Horizon 2020
- 310030B_182833/Schweizerischer Nationalfonds zur Förderung der Wissenschaftlichen Forschung
- 310030B_182833/Schweizerischer Nationalfonds zur Förderung der Wissenschaftlichen Forschung
- 310030B_182833/Schweizerischer Nationalfonds zur Förderung der Wissenschaftlichen Forschung
- RYC2021-032699-I/Ramon y Cajal Fellowship
- PID2022-142651OA-I00/Ministerio de Ciencia e Innovación
LinkOut - more resources
Full Text Sources
Miscellaneous
