. 2025 Jun 18;23(1):679.
doi: 10.1186/s12967-025-06704-y.

The impact of de novo lipogenesis on predicting survival and clinical therapy: an exploration based on a multigene prognostic model in hepatocellular carcinoma

Affiliations

The impact of de novo lipogenesis on predicting survival and clinical therapy: an exploration based on a multigene prognostic model in hepatocellular carcinoma

Xin Zhou et al. J Transl Med. .

Abstract

Background: Hepatocellular carcinoma (HCC) ranks among the most aggressive malignancies worldwide, with poor outcomes attributed to delayed diagnosis and therapeutic limitations. Emerging evidence suggests that de novo lipogenesis (DNL) plays a crucial role in HCC progression and its interaction with the immune microenvironment.

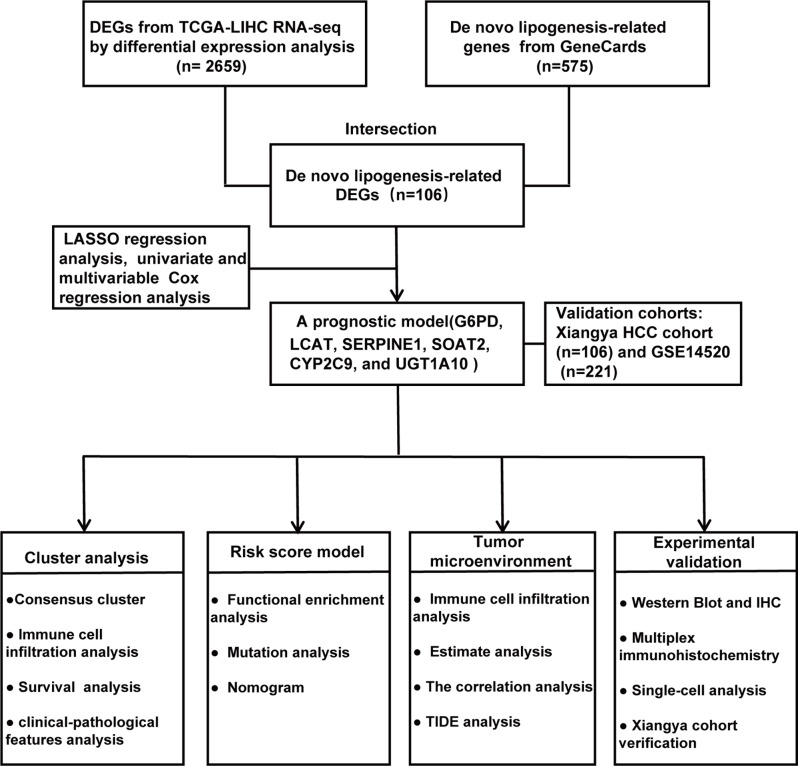
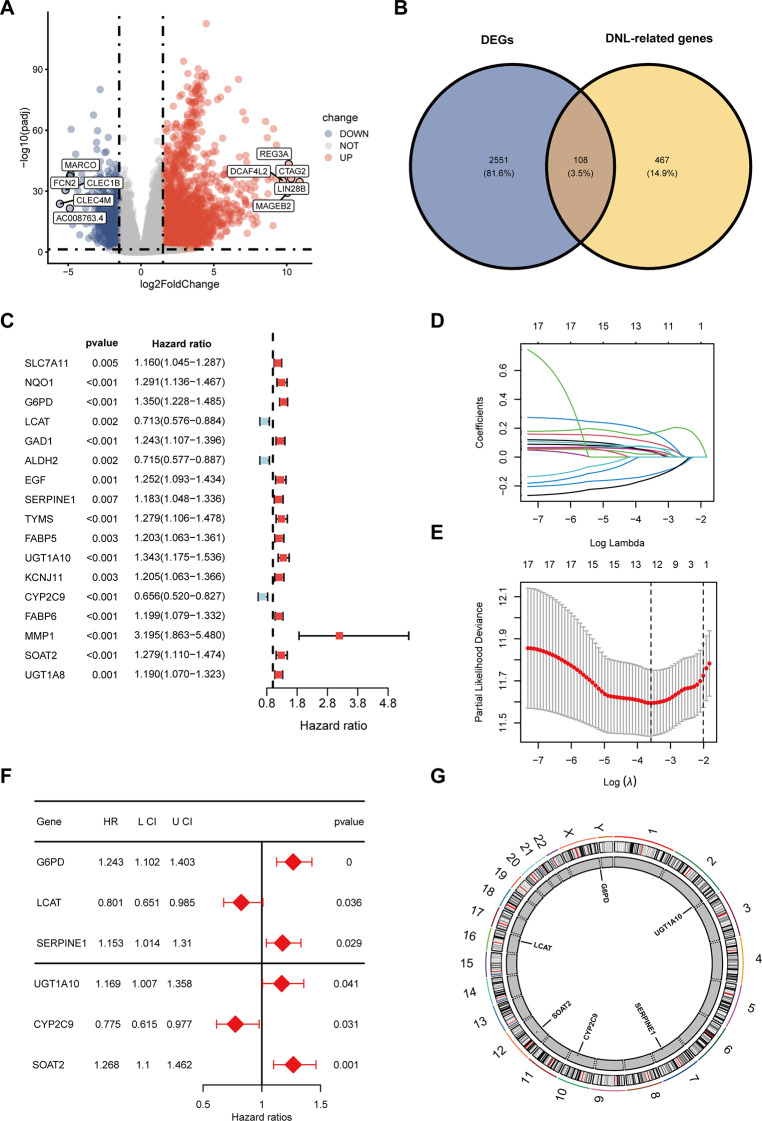
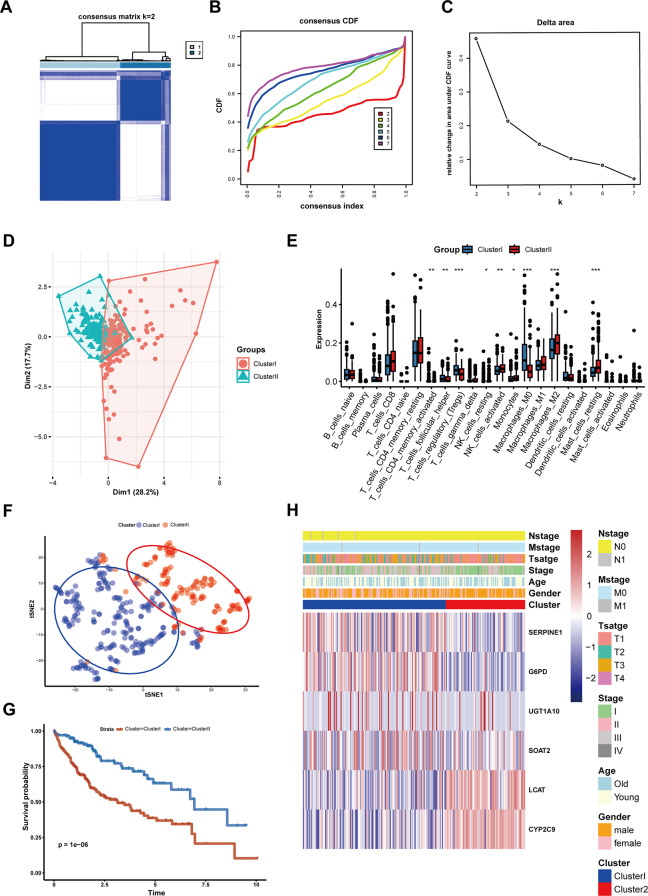
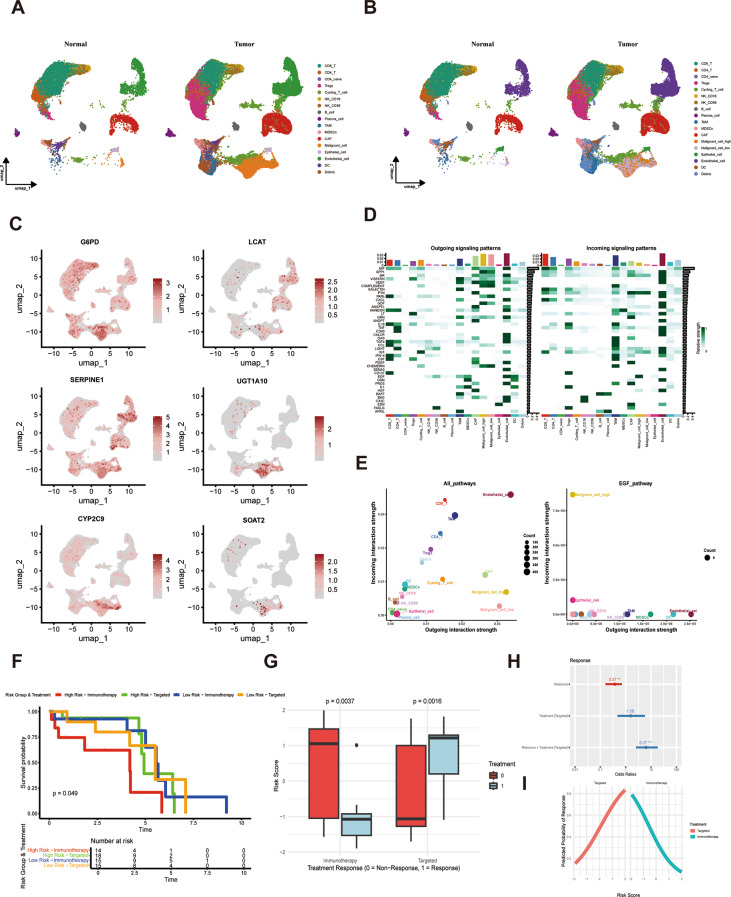
Methods: We systematically analyzed DNL-related gene expression profiles from TCGA, GEO, ICGC-LIRI datasets, and our Xiangya HCC cohort (n = 106) to construct a prognostic risk model. Through LASSO-Cox regression analysis, we identified six signature genes (G6PD, LCAT, SERPINE1, SOAT2, CYP2C9, and UGT1A10) that effectively stratified patients into distinct risk groups. We evaluated clinical characteristics, immune cell infiltration patterns, and differential therapeutic responses between high-risk and low-risk groups. Comprehensive validation included immunohistochemical analysis and Western blotting to assess expression levels of key model genes, along with multiplex immunofluorescence staining and single-cell RNA sequencing(scRNA-seq) to characterize immune microenvironmental differences between risk groups.

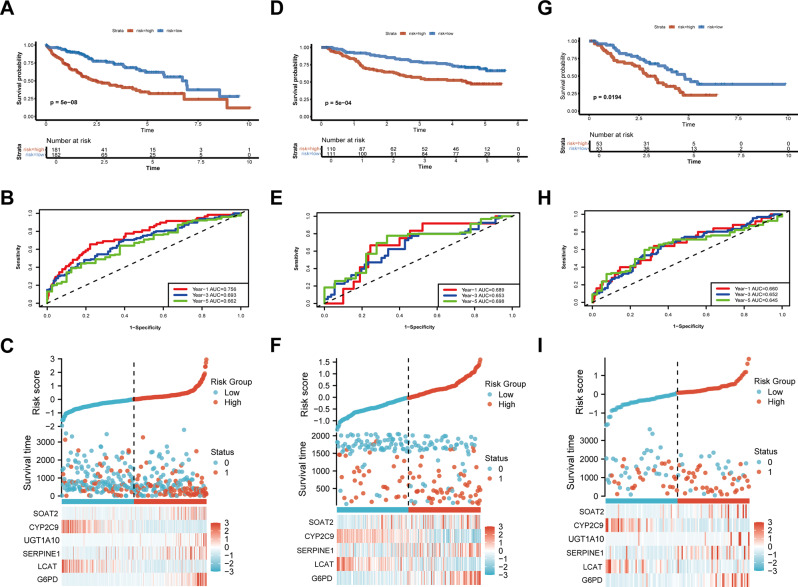
Results: We successfully established a robust six-gene prognostic signature (G6PD, LCAT, SERPINE1, SOAT2, CYP2C9, and UGT1A10) based on de novo lipogenesis pathways, which demonstrated excellent predictive performance (AUC: 0.78-0.82). The model revealed significant differences in immune infiltration patterns between risk groups, with the high-risk group exhibiting immunosuppressive characteristics characterized by increased Treg cell infiltration, while the low-risk group showed greater NK cell retention. Integrated scRNA-seq and our cohort validation further demonstrated that high-risk scores were associated with poorer response to immunotherapy but greater sensitivity to targeted therapies. These findings suggest that de novo lipogenesis-mediated immune evasion contributes to therapy resistance and worse prognosis in high-risk HCC patients, whereas low-risk HCC patients maintain an immunologically active microenvironment more amenable to immunotherapy.

Conclusions: This study provided a novel prognostic model for HCC, incorporating 6 representative DNLs. The model demonstrated the potential for predicting HCC prognosis and highlighted the involvement of immune cell infiltration and the association between risk scores and clinical therapy. Validation of model genes further supported the association between de novo lipogenesis and HCC development.

Keywords: Clinical therapy; De novo lipogenesis; Multigene prognostic model; RNA-seq; Single-cell RNA-seq.


Conflict of interest statement

Declarations. Ethics approval and consent to participate: This study was approved by Ethics Committees of Xiangya Hospital and patient consent was obtained before the samples were taken. Consent for publication: Not applicable. Competing interests: The authors declare no competing interests.

Figures

Fig. 1
Fig. 1
Flowchart of this Study
Fig. 2
Fig. 2
Screening DEGs of De novo Lipid Synthesis and Constructing a Prognostic Risk Model in the TCGA-LIHC Cohort. (A)The volcano plot showed DEGs between HCC tumor and normal groups, highlighting the|log2FoldChange| top 10 genes. (B) The Venn diagram shows that 108 overlapping genes were identified from the intersection of 2,659 DEGs and 574 DNL-related genes. (C) Univariate Cox regression analysis showed that 17 genes were associated with the prognosis of HCC patients. (D) LASSO regression of the 12 OS-related genes. The coefficient path plot showed the trajectories of the regression coefficients for each curve as the regularization parameter λ changes. The cross-validation plot shows the cross-validation error of the model at different λ values, with the horizontal axis representing the regularization parameter λ and the vertical axis representing partial likelihood deviance. (E) Multivariate Cox regression analysis showed that six genes were associated with the prognosis of HCC patients. (F) The circular chromosome plot visualizes the chromosomal locations of the model genes
Fig. 3
Fig. 3
The performance of the prognostic risk model was evaluated using the TCGA-LIHC cohort and external validation cohorts. (A)Kaplan–Meier curves of the OS of patients in the TCGA-LIHC training cohort. (B) ROC curves for predicting 1-, 3-, and 5-year OS in the TCGA-LIHC training cohort. (C) The distribution of risk score, survival status (1 indicate dead,0 indicate alive) and the gene expression of 6 model genes in the high- and low-risk groups in the TCGA-LIHC training cohort. (D) Kaplan–Meier curves of the OS of patients in the GSE14520 cohort. (E) ROC curves for predicting 1-, 3-, and 5-year OS in the GSE14520 cohort. (F) The distribution of risk score, survival status (1 indicate dead,0 indicate alive) and the gene expression of 6 model genes in the high- and low-risk groups in the GSE14520 cohort. (G) Kaplan–Meier curves of the OS of patients in the Xiangya HCC cohort. (H) ROC curves for predicting 1-, 3-, and 5-year OS in the Xiangya HCC cohort. (I) The distribution of risk score, survival status (1 indicate dead,0 indicate alive) and the gene expression of 6 model genes in the high- and low-risk groups in the Xiangya HCC cohort
Fig. 4
Fig. 4
Enrichment analysis of high- and low-risk groups in the TCGA-LIHC cohort. (A) GO enrichment chord diagram, with the left semicircle representing enriched genes and the right semicircle showing six enriched GO pathways in different colors. (B) KEGG enrichment chord diagram, where the left semicircle represented enriched genes and the right semicircle displayed five enriched KEGG pathways in different colors. (C) GSEA analysis showed gene sets enriched in the high-risk group
Fig. 5
Fig. 5
Different de novo lipid synthesis patterns were identified in 365 HCC patients from the TCGA-LIHC cohort. (A) Heatmap of the consensus matrix for two clusters (k = 2). (B) The CDF plot of the consensus matrix for k = 2–7. (C) The Delta area plot indicated that k = 2 was the optimal number of clusters. (D) The Dim plot showed the spatial distribution of the two clusters. (E) Immune cell infiltration differences between the two clusters. (F) t-SNE analysis of the two clusters. (G) Survival analysis of de novo lipid synthesis clusters based on OS (log-rank test). (H) Complex heatmap showing expression levels of model genes and the distribution of clinical characteristics in de novo lipid synthesis clusters. * P < 0.05, ** P < 0.01, *** P < 0.001
Fig. 6
Fig. 6
The relationship between clusters and risk scores, and mutation status in the high- and the low-risk groups in TCGA-LIHC cohort. (A) Comparison of clinical characteristics between patients in the two clusters. (B) Sankey diagram of clusters, risk, and patient survival outcomes. (C) Comparison of risk scores between the two clusters. (D) The waterfall plot showed the top 20 genes in the high- risk group based on mutation frequency. (E) The waterfall plot showed the top 20 genes low-risk group based on mutation frequency. * P < 0.05, *** P < 0.001
Fig. 7
Fig. 7
Immune cell infiltration and immune response in the TCGA-LIHC and Xiangya HCC cohorts. (A) Comparison of immune cell infiltration between high- and low-risk groups in the TCGA-LIHC cohort. (B) Comparison of immune cell infiltration between high- and low-risk groups in the Xiangya HCC cohort. (C) Correlation analysis of the six model genes with each immune cell population in the TCGA-LIHC cohort. (D) Comparison of TIDE scores, exclusion scores, and MDSCs level between high- and low-risk groups in the TCGA-LIHC cohort. (E) Comparison of TIDE scores, exclusion scores, and MDSCs level between high- and low-risk groups in the Xiangya HCC cohort. * P < 0.05, ** P < 0.01, *** P < 0.001
Fig. 8
Fig. 8
The nomogram integrated multiple survival-influencing factors to provide personalized prognosis assessment for patients. (A) Univariate Cox regression analysis identified factors associated with patient survival. (B) Multivariate Cox regression analysis identified independent prognostic factors associated with patient survival. (C) The nomogram plot. (D) The area under the curve (AUC) values for 1 year, 2 years, and 3 years. (E) Nomogram prediction of 1-year survival probability. (F) Nomogram prediction of 3-year survival probability. (G) Nomogram prediction of 5-year survival probability
Fig. 9
Fig. 9
Validation of model gene expression levels and Treg cell infiltration. (A) mRNA expression levels of model genes in tumor and adjacent normal tissues in the TCGA-LIHC cohort. (B) mRNA expression levels of model genes in tumor and adjacent normal tissues in the Xiangya HCC cohort. (C) Correlation analysis between model genes and risk scores. (D) Protein expression levels of G6PD in 8 pairs of HCC and paired adjacent tissues. (E) Protein expression statistical chart. (F) Immunohistochemistry chips showed G6PD expression in 85 pairs of HCC and paired adjacent tissues. (G) G6PD expression statistical chart. (H) Representative multiplex immunofluorescence images of Treg cells in high- and low-risk groups. *** P < 0.001
Fig. 10
Fig. 10
Single-cell level analysis of model genes. (A) UMAP plot showed the distribution of 17 cell subpopulations in tumor and normal tissues. (B) Distribution of tumor cell subpopulations with high and low risk scores in the UMAP plot. (C) Expression levels of model genes across the 17 cell subpopulations. (D-E) Enrichment analysis of incoming and outgoing signaling patterns in high- and low-risk tumor cell subpopulations. (F) The Kaplan-Meier curves for patients in the high-risk targeted therapy group, low-risk targeted therapy group, high-risk immunotherapy group, and low-risk immunotherapy group were analyzed. (G) The box plot illustrated the treatment response of high and low-risk score HCC patients across different treatment groups. (H) The forest plot illustrated the relationship between risk scores and response to targeted therapy. (I) The interaction plot illustrated the relationship between risk scores and treatment response by treatment type, with the X-axis representing risk scores and the Y-axis indicating the probability of treatment response

Similar articles

References

    1. Bray F, Laversanne M, Sung H, Ferlay J, Siegel RL, Soerjomataram I, Jemal A. Global cancer statistics 2022: GLOBOCAN estimates of incidence and mortality worldwide for 36 cancers in 185 countries. CA Cancer J Clin. 2024;74(3):229–63. - PubMed
    1. Singal AG, Kanwal F, Llovet JM. Global trends in hepatocellular carcinoma epidemiology: implications for screening, prevention and therapy. Nat Rev Clin Oncol. 2023;20(12):864–84. - PubMed
    1. Saki N, Hayber H, Aghaei M, Topic. Motivation can be suppressed, but scientific ability cannot and should not be ignored. J Transl Med. 2023;21(1):520. - PMC - PubMed
    1. Du D, Liu C, Qin M, Zhang X, Xi T, Yuan S, Hao H, Xiong J. Metabolic dysregulation and emerging therapeutical targets for hepatocellular carcinoma. Acta Pharm Sin B. 2022;12(2):558–80. - PMC - PubMed
    1. Zeng H, Zheng R, Sun K, Zhou M, Wang S, Li L, Chen R, Han B, Liu M, Zhou J, et al. Cancer survival statistics in China 2019–2021: a multicenter, population-based study. J Natl Cancer Cent. 2024;4(3):203–13. - PMC - PubMed

LinkOut - more resources