

Proteome-wide association studies using summary pQTL data of brain, CSF, and plasma identify 30 risk genes of Alzheimer's disease dementia
- PMID: 40533815
- PMCID: PMC12175411
- DOI: 10.1186/s13195-025-01774-y
Proteome-wide association studies using summary pQTL data of brain, CSF, and plasma identify 30 risk genes of Alzheimer's disease dementia
Abstract
Background: A proteome-wide association study (PWAS) that integrates proteomic data with genome-wide association study (GWAS) summary data is a powerful tool for studying Alzheimer's disease (AD) dementia. Existing PWAS analyses of AD often rely on the availability of individual-level proteomic and genetic data of a reference panel. Leveraging summary protein quantitative trait loci (pQTL) reference data of multiple AD-relevant tissues is expected to improve PWAS findings of AD dementia.
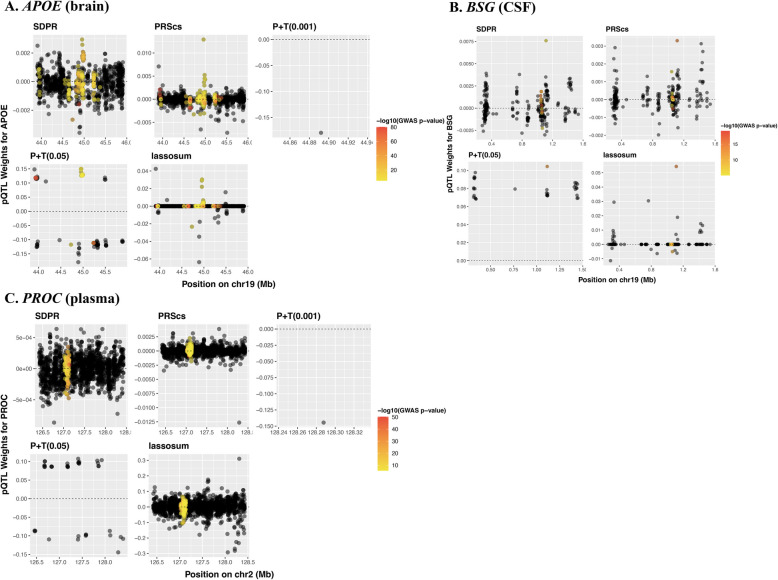
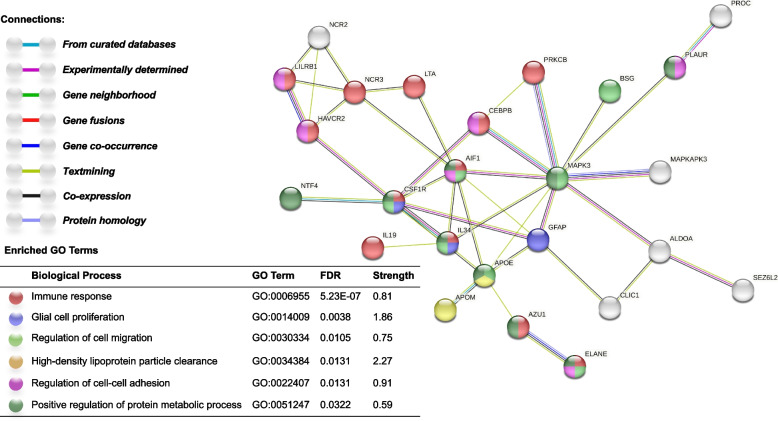
Methods: We conducted PWAS by integrating publicly available summary pQTL data of three tissues including brain, cerebrospinal fluid (CSF), and plasma, with the latest GWAS summary data of AD dementia. For each target protein per tissue, we employed our recently published OTTERS tool to obtain omnibus PWAS p-value, testing whether the genetically regulated protein abundance in the corresponding tissue is associated with AD dementia. Protein-protein interactions and enriched pathways of identified significant PWAS risk genes were analyzed by STRING. The potential causal effects of these PWAS risk genes were assessed by probabilistic Mendelian Randomization analyses.
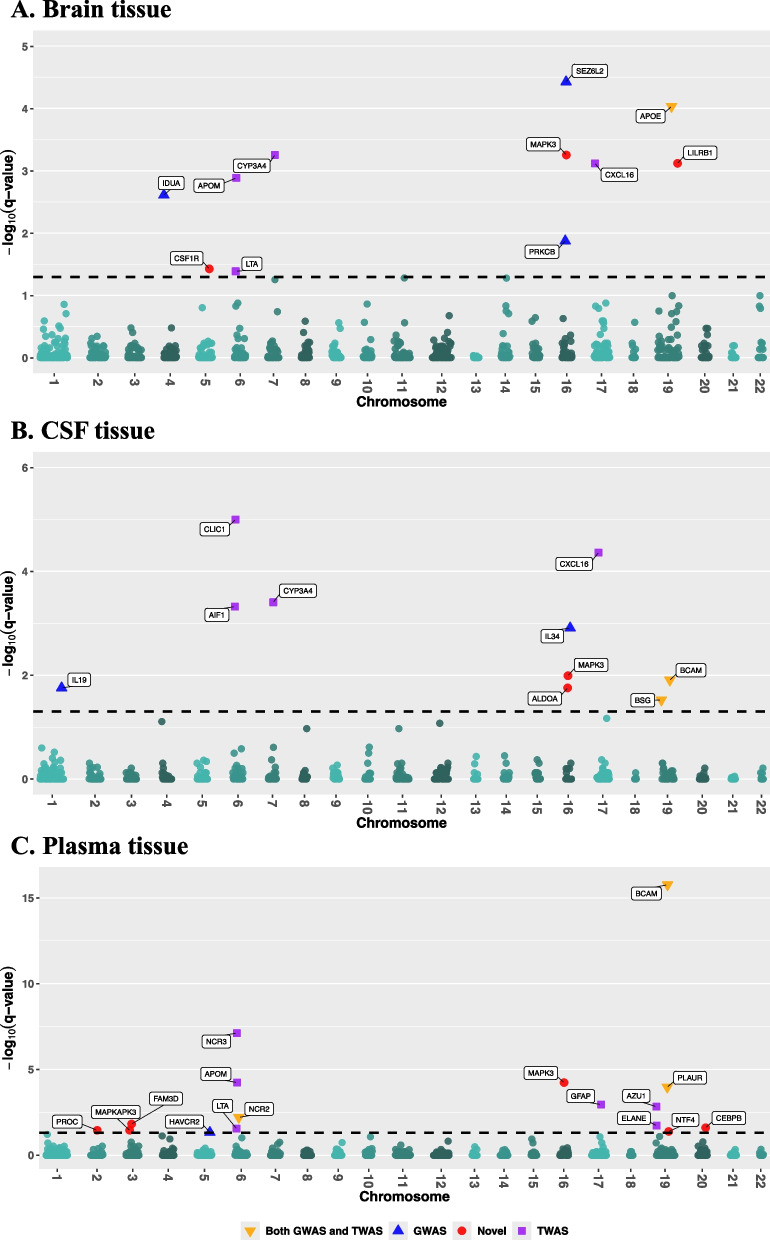
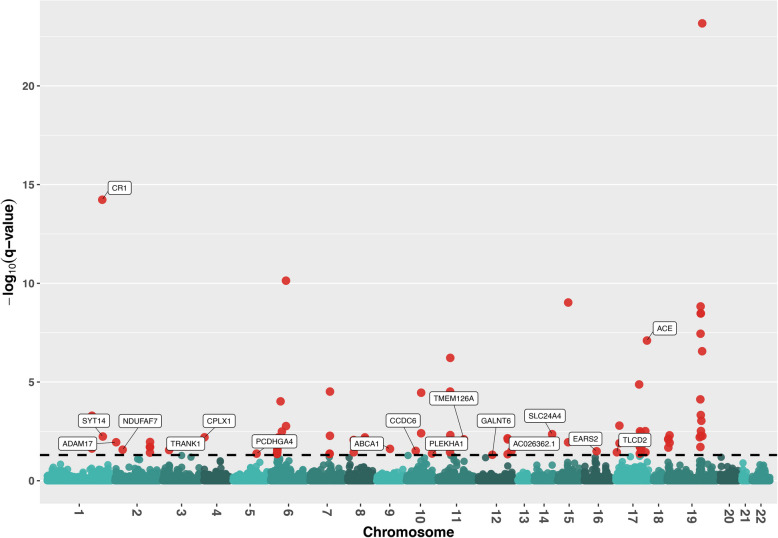
Results: We identified 30 unique significant PWAS risk genes for AD dementia, including 11 for brain, 10 for CSF, and 16 for plasma tissues. Five of these were shared by at least two tissues, and gene MAPK3 was found in all three tissues. We found that 11 of these PWAS risk genes were associated with AD dementia or AD pathology traits in GWAS Catalog; 18 of these were detected by transcriptome-wide association studies (TWAS) in dorsolateral prefrontal cortex brain tissue; and 25 of these, including 8 out of 9 novel genes, were interconnected within a protein-protein interaction network involving the well-known AD risk gene APOE. These PWAS risk genes were enriched in immune response, glial cell proliferation, and high-density lipoprotein particle clearance pathways. Mediated causal effects were validated for 13 PWAS risk genes (43.3%).
Conclusions: Our findings provide novel insights into the genetic mechanisms of AD dementia in brain, CSF, and plasma, and provide targets for developing new therapies. This study also demonstrates the effectiveness of integrating summary pQTL and GWAS data for mapping risk genes of complex human diseases.
Keywords: AD dementia; Alzheimer’s disease; GWAS; OTTERS; PWAS; TWAS; pQTL.
© 2025. The Author(s).
Conflict of interest statement
Declarations. Ethics approval and consent to participate: Summary-level pQTL data of brain, CSF, and plasma, and summary GWAS data of AD dementia were used for conducting PWAS in this study. These data are de-identified and publicly available, requiring no ethics approval. All de-identified omics data are not considered as human data per NIH guidelines. All ROSMAP participants enrolled without known dementia and agreed to detailed clinical evaluation and brain donation at death [ https://pubmed.ncbi.nlm.nih.gov/29865057/ ]. Both studies were approved by an Institutional Review Board of Rush University Medical Center (ROS IRB# L91020181, MAP IRB# L86121802). Both studies were conducted according to the principles expressed in the Declaration of Helsinki. Each participant signed an informed consent, Anatomic Gift Act, and an RADC Repository consent (IRB# L99032481) allowing her data and biospecimens to be repurposed. ROS/MAP transcriptomic and whole genome sequencing data used for TWAS in this study were shared with a data use agreement. Consent for publication: Not applicable. Competing interests: The authors declare no competing interests.
Figures
Update of
-
Proteome-wide association studies using summary pQTL data of three tissues identified 30 risk genes of Alzheimer's disease dementia.medRxiv [Preprint]. 2024 Sep 4:2024.03.28.24305044. doi: 10.1101/2024.03.28.24305044. medRxiv. 2024. Update in: Alzheimers Res Ther. 2025 Jun 18;17(1):135. doi: 10.1186/s13195-025-01774-y. PMID: 38585769 Free PMC article. Updated. Preprint.
Similar articles
-
Proteome-wide association studies using summary pQTL data of three tissues identified 30 risk genes of Alzheimer's disease dementia.medRxiv [Preprint]. 2024 Sep 4:2024.03.28.24305044. doi: 10.1101/2024.03.28.24305044. medRxiv. 2024. Update in: Alzheimers Res Ther. 2025 Jun 18;17(1):135. doi: 10.1186/s13195-025-01774-y. PMID: 38585769 Free PMC article. Updated. Preprint.
-
Multi-omics analysis for identifying cell-type-specific and bulk-level druggable targets in Alzheimer's disease.J Transl Med. 2025 Jul 13;23(1):788. doi: 10.1186/s12967-025-06739-1. J Transl Med. 2025. PMID: 40653482 Free PMC article.
-
Biomarker identification for Alzheimer's disease through integration of comprehensive Mendelian randomization and proteomics data.J Transl Med. 2025 Mar 6;23(1):278. doi: 10.1186/s12967-025-06317-5. J Transl Med. 2025. PMID: 40050982 Free PMC article.
-
CSF tau and the CSF tau/ABeta ratio for the diagnosis of Alzheimer's disease dementia and other dementias in people with mild cognitive impairment (MCI).Cochrane Database Syst Rev. 2017 Mar 22;3(3):CD010803. doi: 10.1002/14651858.CD010803.pub2. Cochrane Database Syst Rev. 2017. PMID: 28328043 Free PMC article.
-
Integrative Post-Genome-Wide Association Study Analyses Relevant to Psychiatric Disorders: Imputing Transcriptome and Proteome Signals.Complex Psychiatry. 2023 Apr 11;9(1-4):130-144. doi: 10.1159/000530223. eCollection 2023 Jan-Dec. Complex Psychiatry. 2023. PMID: 37588130 Free PMC article. Review.
References
-
- Wingo AP, Liu Y, Gerasimov ES, Gockley J, Logsdon BA, Duong DM, Dammer EB, Robins C, Beach TG, Reiman EM, et al. Integrating human brain proteomes with genome-wide association data implicates new proteins in Alzheimer’s disease pathogenesis. Nat Genet. 2021;53:143–6. 10.1038/s41588-020-00773-z. - PMC - PubMed
MeSH terms
Substances
Grants and funding
LinkOut - more resources
Full Text Sources
Medical
Miscellaneous
