

Association of DNA methylation epigenetic markers with all-cause mortality and cardiovascular disease-related mortality in diabetic population: a machine learning-based retrospective cohort study
- PMID: 40533821
- PMCID: PMC12175400
- DOI: 10.1186/s13098-025-01774-w
Association of DNA methylation epigenetic markers with all-cause mortality and cardiovascular disease-related mortality in diabetic population: a machine learning-based retrospective cohort study
Abstract
Background: Diabetes has a large and diverse population, with individuals exhibiting significant heterogeneity in the disease. The factors influencing survival and prognosis are complex, making early intervention in diabetic populations particularly challenging. Research has demonstrated a close relationship between DNA methylation (DNAm) clocks and aging as well as various diseases, showing superior predictive capabilities. However, the relationship between DNAm clocks and long-term survival in diabetic patients, particularly concerning cardiovascular-related mortality, remains unclear.
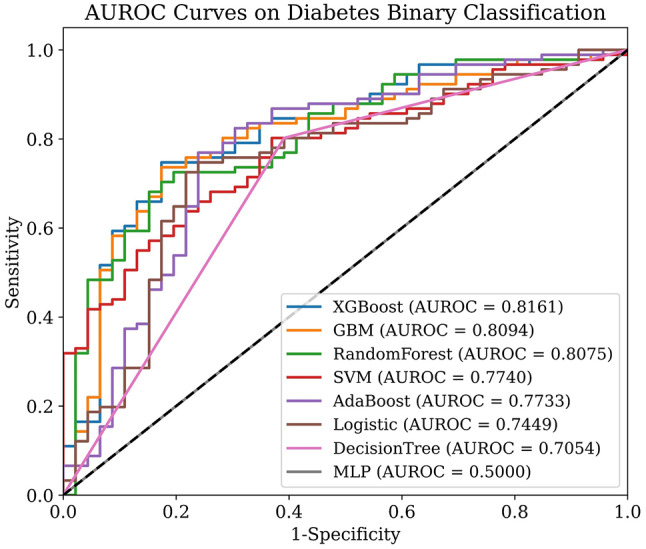
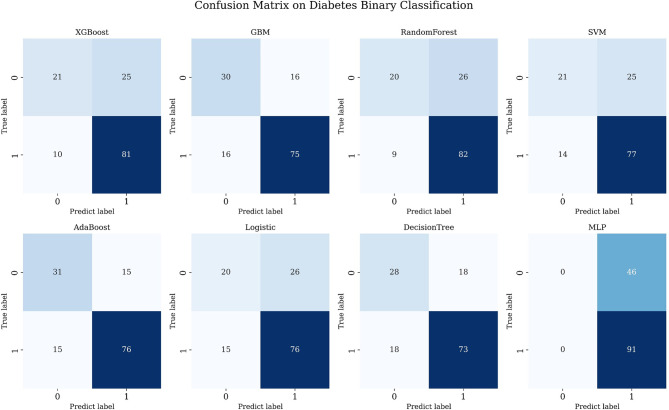
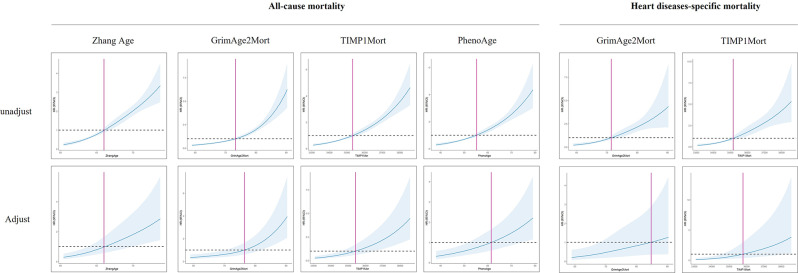
Methods: We analyzed the data of the diabetes population cohort in the National Health and Nutrition Examination Survey, which was followed for 20 years. We employed eight machine learning (ML) models to analyze 29 potential DNAm derived epigenetic markers and utilized Cox regression models to assess the risks of all-cause mortality and cardiovascular disease-related mortality in the diabetic population. Additionally, we applied restricted cubic spline (RCS) to analyze potential influence trends.
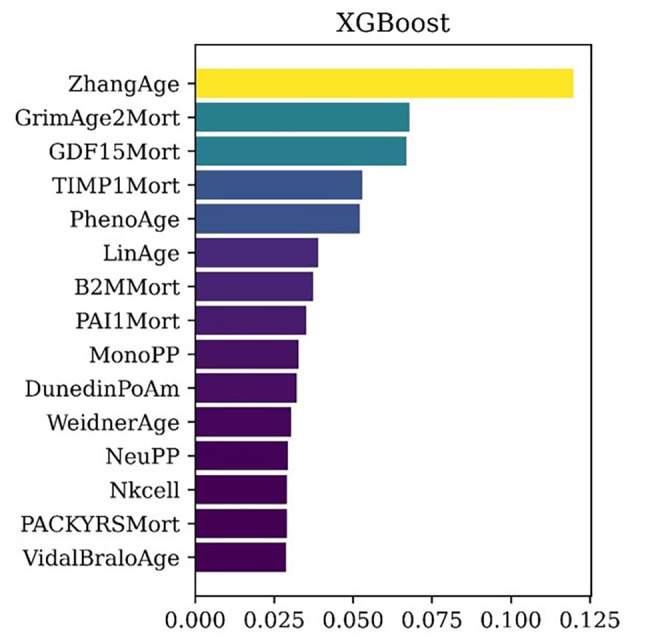
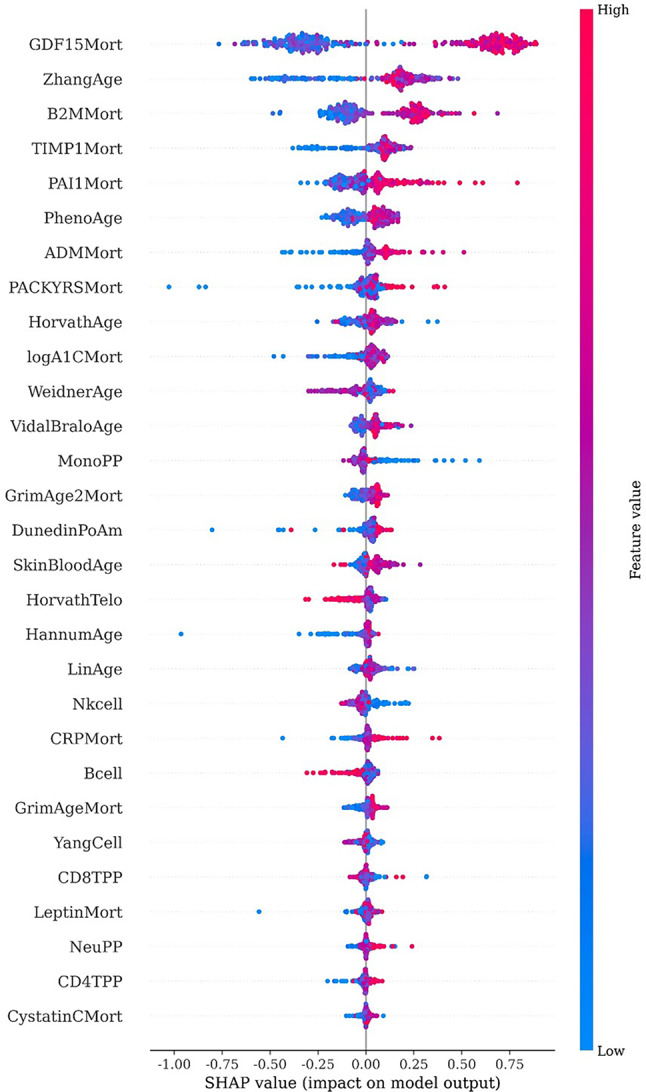
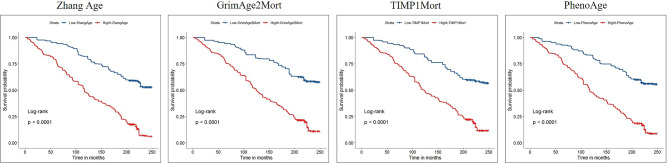
Results: A total of 454 people with diabetes were followed up, with a median follow-up time of 177.6 months. Through machine learning methods, we identified several high-performing DNAm markers, finding that four epigenetic biomarkers, ZhangAge (HR = 2.86, 95% CI: 2.19-3.73, P < 0.001), GrimAge2Mort (HR = 3.06, 95% CI: 2.26-4.14, P < 0.001), TIMP1Mort (HR = 2.95, 95% CI: 2.18-4.01, P < 0.001), and PhenoAge (HR = 2.94, 95% CI: 1.23-3.88, P < 0.001), were significantly associated with all-cause mortality in the diabetic population. Further research indicated that GrimAge2 Mort (HR = 2.86, 95% CI: 1.30-6.29, P = 0.009) and TIMP1Mort (HR = 4.08, 95% CI: 2.17-7.68, P < 0.001) were associated with cardiovascular disease-related mortality. RCS curves demonstrated that the mortality risk for all diabetic patients increased with rising levels of these DNAm epigenetic markers.
Conclusion: We found four DNAm-derived epigenetic markers (ZhangAge, GrimAge2 Mort, TIMP1Mort, PhenoAge) that are associated with all-cause mortality risk in the diabetic population. Further research suggested that GrimAge and PhenoAge influence the risk of cardiovascular-related mortality.
Keywords: All-cause mortality; Cardiovascular disease-related mortality; DNA methylation biomarkers; Diabetes.
© 2025. The Author(s).
Conflict of interest statement
Declarations. Ethical approval: Not application. Consent to participate: Not applicable. Consent to publish: All authors agree to publish. Competing interests: The authors declare no competing interests.
Figures
Similar articles
-
The association of obesity and lipid-related indicators with all-cause and cardiovascular mortality risks in patients with diabetes or prediabetes: a cross-sectional study based on machine learning algorithms.Front Endocrinol (Lausanne). 2025 Jun 2;16:1492082. doi: 10.3389/fendo.2025.1492082. eCollection 2025. Front Endocrinol (Lausanne). 2025. PMID: 40529828 Free PMC article.
-
The association of accelerated epigenetic age with all-cause mortality in cardiac catheterization patients as mediated by vascular and cardiometabolic outcomes.Clin Epigenetics. 2022 Dec 3;14(1):165. doi: 10.1186/s13148-022-01380-x. Clin Epigenetics. 2022. PMID: 36461124 Free PMC article.
-
Association between red blood cell distribution width-to-albumin ratio and all-cause mortality in intracerebral hemorrhage.Front Nutr. 2025 Jun 4;12:1599104. doi: 10.3389/fnut.2025.1599104. eCollection 2025. Front Nutr. 2025. PMID: 40535050 Free PMC article.
-
Gut microbial metabolite trimethylamine N-oxide as a novel predictor for adverse cardiovascular events after PCI: a systematic review and dose-response meta-analysis.Nutr J. 2025 Jun 16;24(1):91. doi: 10.1186/s12937-025-01159-9. Nutr J. 2025. PMID: 40524200 Free PMC article. Review.
-
A systematic review of biological, social and environmental factors associated with epigenetic clock acceleration.Ageing Res Rev. 2021 Aug;69:101348. doi: 10.1016/j.arr.2021.101348. Epub 2021 Apr 28. Ageing Res Rev. 2021. PMID: 33930583
References
-
- Magliano DJ, Boyko EJ. IDF DIABETES ATLAS. 10th ed. Brussels; 2021.
-
- Parker ED, Lin J, Mahoney T, Ume N, Yang G, Gabbay RA, et al. Economic costs of diabetes In the U.S. In 2022. Diabetes Care. 2024;47:26–43. - PubMed
Grants and funding
- 81873486/National Natural Science Foundation of China
- BK20240637/Natural Science Research of Jiangsu Higher Education Institutions of China
- BE2022754/Science and Technology Development Program of Jiangsu Province-Clinical Frontier Technology
- SZYQTD202102/Clinical Medicine Expert Team (Class A) of Jinji Lake Health Talents Program of Suzhou Industrial Park
- SZXK202129/Suzhou Key Discipline for Medicine
- SKY2021002/Demonstration of Scientific and Technological Innovation Project
- LCZX202132/Suzhou Dedicated Project on Diagnosis and Treatment Technology of Major Diseases
- SZM2021014/Research on Collaborative Innovation of medical engineering combination
- KJXW2023086/Suzhou Science and Education Youth Science and Technology Project
LinkOut - more resources
Full Text Sources
