

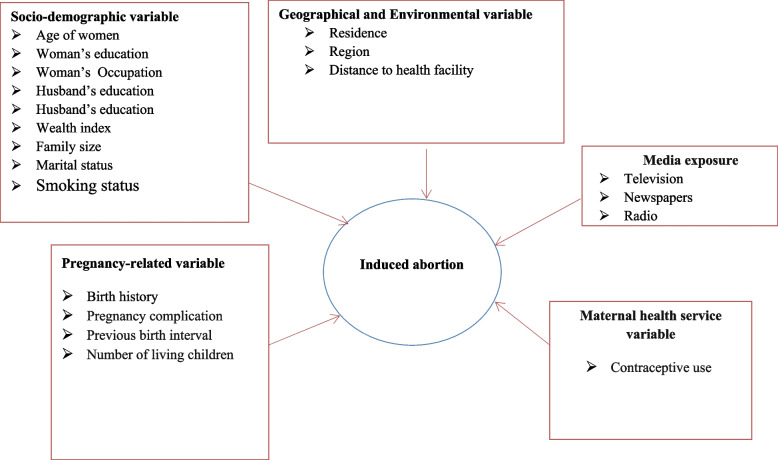
Pooled prevalence of induced abortion and associated factors among reproductive age women in sub-Saharan Africa: a Bayesian multilevel approach
- PMID: 40533838
- PMCID: PMC12175375
- DOI: 10.1186/s13690-025-01656-7
Pooled prevalence of induced abortion and associated factors among reproductive age women in sub-Saharan Africa: a Bayesian multilevel approach
Abstract
Background: Abortion is one of the leading causes of maternal death in developing countries, particularly in sub-Saharan Africa (sSA,). In this region, abortion is responsible for 38,000 maternal deaths, making the area with the highest rate of abortion-related mortality in the world. This study aimed to examine the prevalence and associated factors of induced abortion in 33 countries in the region.
Method: We used data from the most current Demographic and Health Surveys (DHS) conducted in 33 sSA countries between 2012 and 2022. A total 367,881 of women were included in the analysis. The Bayesian multilevel logistic regression model was used to determine the factors associated to induced abortion because of the hierarchical nature of the DHS data.
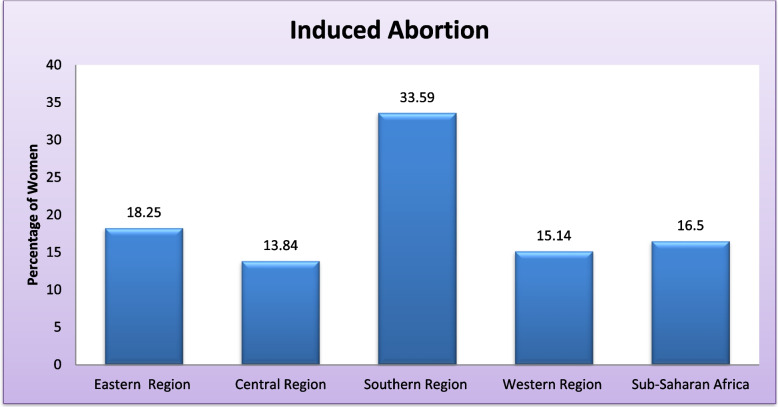
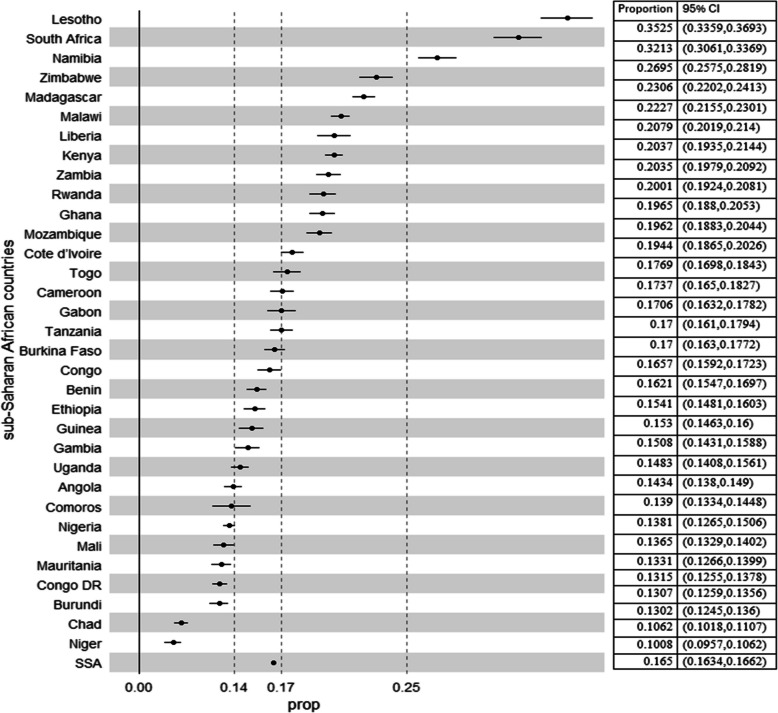
Results: The overall prevalence of induced abortion was 16.50% in sSA. The random effects model revealed that about 75% of the variation in the induced abortion was caused by community and individual-level factors. Based on the Bayesian multilevel logistic regression model, women who smoke cigarettes(AOR = 1.044; 95%CI: 1.020, 1.070), 24-month and above birth interval(AOR = 5.747; 95%CI: 5.595, 5.889), rich women(AOR = 1.470, 95%CI: 1.436, 1.510), secondary and above-educated women (AOR = 2.640, 95%CI: 2.567, 2.707), being exposed to the media (AOR = 1.099, 95%CI: 1.083, 1.115), rural women (AOR = 1.025, 95%CI: 1.004, 1.047) and having pregnancy complications (AOR = 1.095, 95%CI: 1.067, 1.124) were associated with higher odds of induced abortion. But, the odds of an induced abortion were lower for women 35-49 years of age(AOR = 0.019, 95% CI: 0.018, 0.019), having 2-3 birth history(AOR = 0.105, 95%CI: 0.102, 0.107), having family size of 4-6 (AOR = 0.747; 95%CI: 0.735, 0.760), using contraception (AOR = 0.747; 95%CI: 0.735, 0.760), being married (AOR = 0.642; 95%CI: 0.628, 0.654), and being a working woman(AOR = 0.673; 95%CI: 0.658, 0.687).
Conclusion: The prevalence of induced abortion was high in the sSA countries with a significant country-specific variations. Therefore, public health programs shall focus on sexual and reproductive health education for young women, rural women, unmarried women, and rich women, in order to address this problem. Furthermore, it is crucial to formulate policies and initiatives that consider regional disparities in the prevalence of induced abortion and to actively pursue their implementation.
Keywords: Bayesian multilevel model; Demographic and Health Survey; Induced abortion; Sub-Saharan Africa.
© 2025. The Author(s).
Conflict of interest statement
Declarations. Ethics approval and consent to participate: The study was based on a secondary analysis of existing survey data with all identifying information removed. Permission for data access was obtained from measure demographic and health survey through an online request from http://www.measuredhsprogram.com . Consent for publication: Not applicable since the study was a secondary data analysis. Competing interests: The authors declare no competing interests.
Figures
Similar articles
-
Multilevel modelling of determinants of perinatal mortality in East Africa: a pooled analysis of National health survey data.BMC Public Health. 2025 May 30;25(1):2003. doi: 10.1186/s12889-025-23218-w. BMC Public Health. 2025. PMID: 40448089 Free PMC article.
-
Domestic violence and its determinants among reproductive-age women in Sub-saharan Africa: a multilevel analysis of 2019-2024 demographic and health survey data.BMC Public Health. 2025 Jul 2;25(1):2288. doi: 10.1186/s12889-025-23544-z. BMC Public Health. 2025. PMID: 40604804 Free PMC article.
-
Pooled prevalence of modern contraceptive utilization and its associated factors among reproductive age women in East Africa: derived from demographic and health surveys.J Health Popul Nutr. 2025 Jul 19;44(1):261. doi: 10.1186/s41043-025-01019-6. J Health Popul Nutr. 2025. PMID: 40684244 Free PMC article.
-
Prevalence and odds of anxiety and depression in cutaneous malignant melanoma: a proportional meta-analysis and regression.Br J Dermatol. 2024 Jun 20;191(1):24-35. doi: 10.1093/bjd/ljae011. Br J Dermatol. 2024. PMID: 38197404
-
Malnutrition among lactating women in sub-Saharan Africa: an analytic review of spatial distribution, burden and determinants.Front Public Health. 2025 Jun 3;13:1564581. doi: 10.3389/fpubh.2025.1564581. eCollection 2025. Front Public Health. 2025. PMID: 40529712 Free PMC article. Review.
Cited by
-
Assessing induced abortion underreporting in restrictive settings using prospective morbidity surveys from Kenya, Liberia, and Sierra Leone.Sci Rep. 2025 Aug 6;15(1):28756. doi: 10.1038/s41598-025-14096-8. Sci Rep. 2025. PMID: 40770399 Free PMC article.
References
-
- Organization WH. Factsheet: preventing unsafe abortion. Geneva: WHO; 2018.
-
- Lavelanet AF, Johnson BR Jr, Ganatra B. Global abortion policies database: a descriptive analysis of the regulatory and policy environment related to abortion. Best Pract Res Clin Obstet Gynaecol. 2020;62:25–35. - PubMed
-
- Sultana A. Induced abortion: Rural Women’s Escape against Unintended Pregnancies. Pakistan Vision. 2020;21(1):466.
-
- Sahoo H, et al. Availability, practices and acceptance of postabortion contraceptive services in health facilities: a study in six states of India. Contraception. 2020;101(2):106–11. - PubMed
-
- Bearak J, et al. Unintended pregnancy and abortion by income, region, and the legal status of abortion: estimates from a comprehensive model for 1990–2019. Lancet Glob Health. 2020;8(9):e1152–61. - PubMed
LinkOut - more resources
Full Text Sources
Research Materials
