. 2025 Jun 18;13(1):32.
doi: 10.1186/s40170-025-00401-6.

NRF2 maintains redox balance via ME1 and NRF2 inhibitor synergizes with venetoclax in NPM1-mutated acute myeloid leukemia

Affiliations

NRF2 maintains redox balance via ME1 and NRF2 inhibitor synergizes with venetoclax in NPM1-mutated acute myeloid leukemia

Jiayuan Hu et al. Cancer Metab. .

Abstract

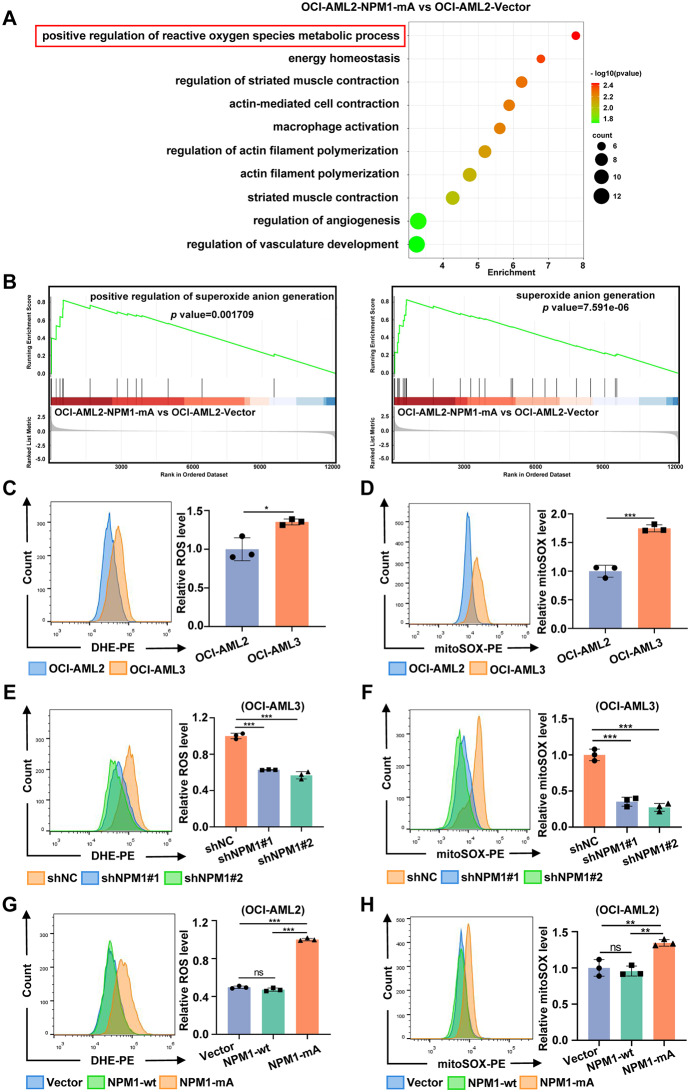
Background: Acute myeloid leukemia (AML) with nucleophosmin 1 (NPM1) mutations represents a distinct subtype of leukemia. Emerging evidence suggests that regulation of redox metabolism contributes to tumorigenesis and reveals a metabolic vulnerability in anti-tumor therapies. However, the role of redox homeostasis between reactive oxygen species (ROS) and antioxidant systems plays in NPM1-mutated AML has not been fully elucidated.

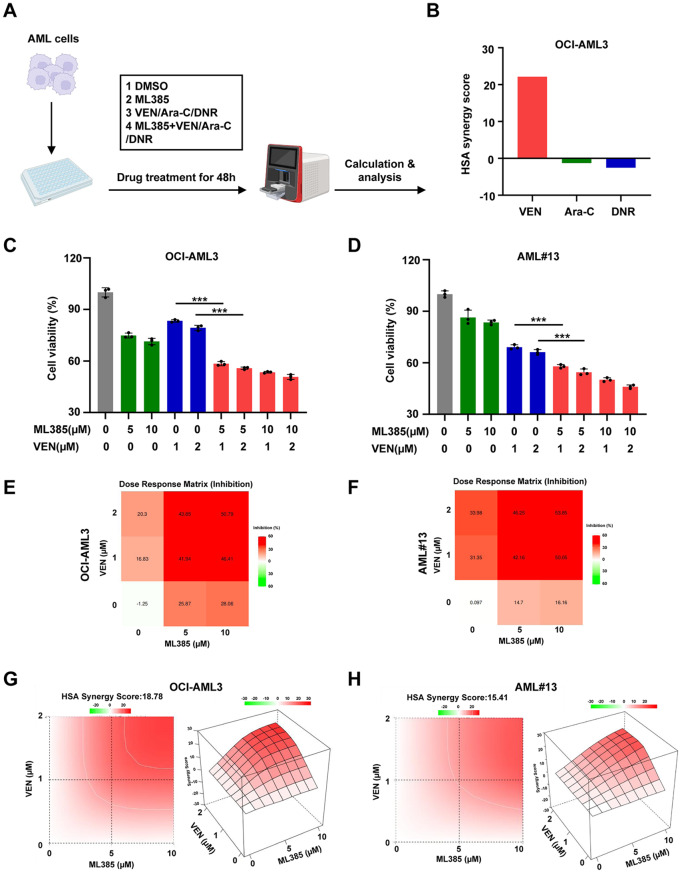
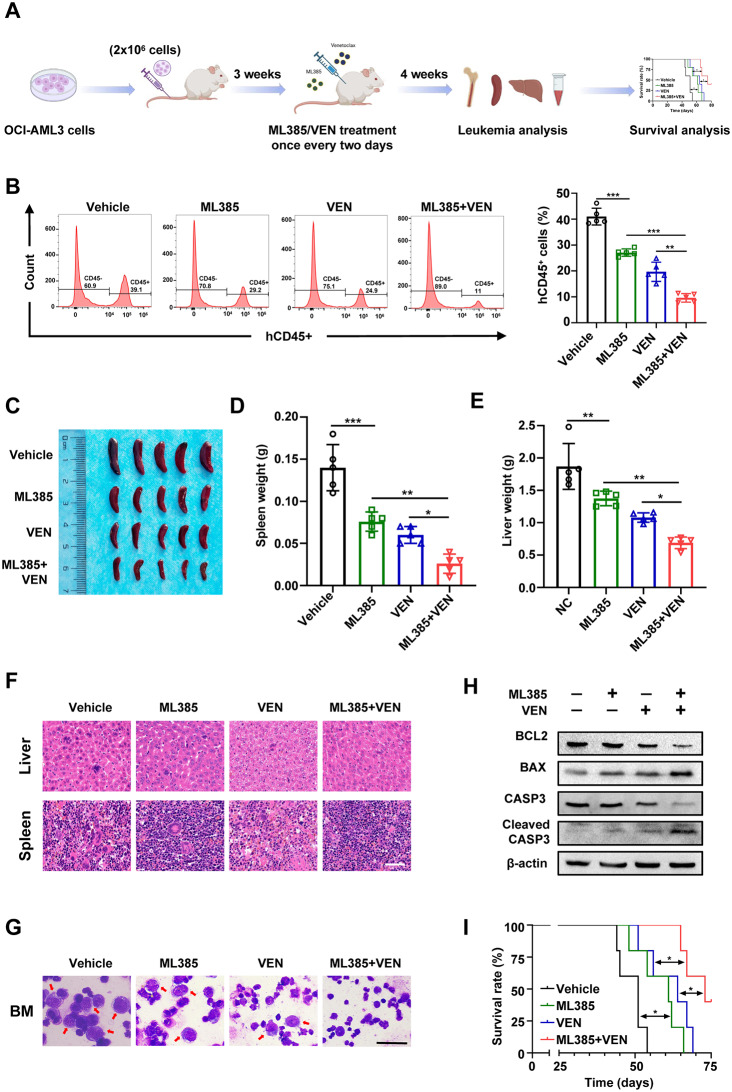
Methods: First, ROS-related metabolic pathways in NPM1-mutated AML were analyzed using RNA-sequencing data. Intracellular and mitochondrial ROS levels in leukemia cells were detected using flow cytometry (FCM). The expression of nuclear factor (erythroid-derived 2)-like 2 (NRF2) was analyzed in public databases and further validated in AML primary blasts and cell lines by quantitative real-time PCR (qRT-PCR), western blotting, and immunofluorescence. Next, the mechanism underlying NRF2 expression was investigated through the RNA immunoprecipitation (RIP), methylated RNA immunoprecipitation (MeRIP) and rescue experiments. Additionally, the downstream target gene of NRF2 was identified by bioinformatics analysis and chromatin immunoprecipitation (ChIP) assays. Furthermore, RNA interference and the NRF2 inhibitor ML385 were applied to explore the role of NRF2 in leukemia. Finally, the anti-leukemic effects of ML385 alone or in combination with the B-cell lymphoma 2 (BCL-2) inhibitor venetoclax on AML cells were investigated using FCM analysis and western blotting, and further explored in cell line-derived xenograft (CDX) mouse models.

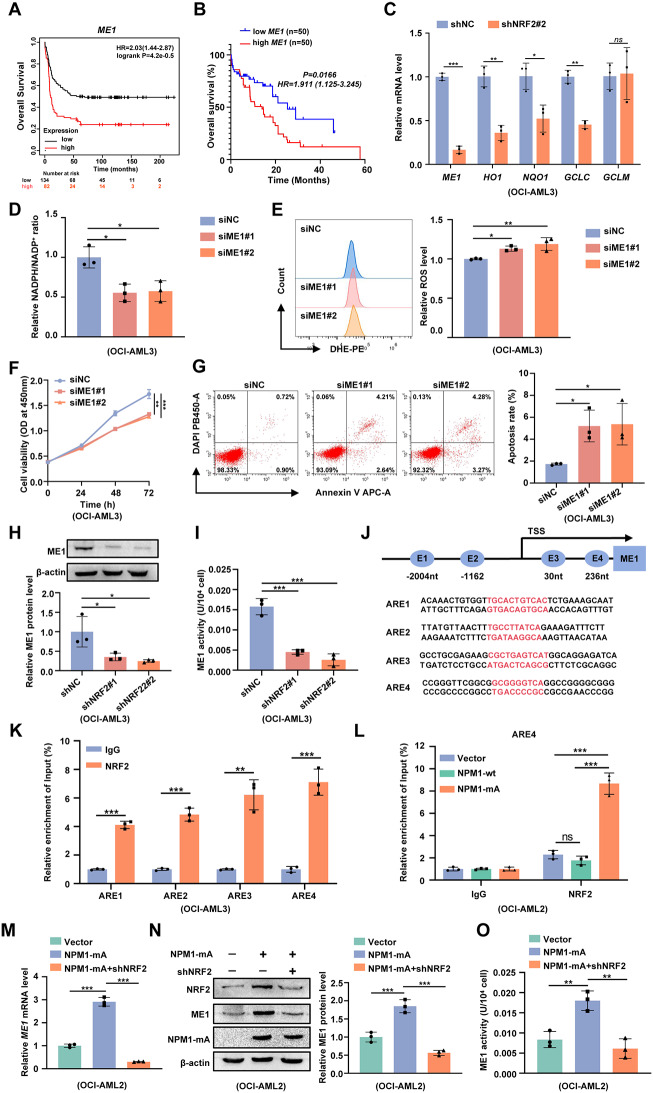
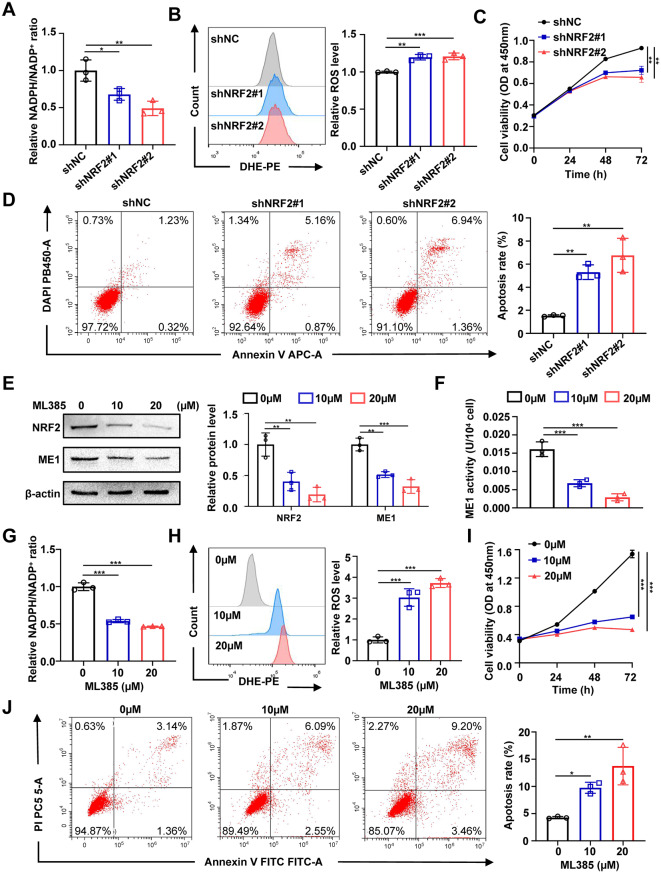
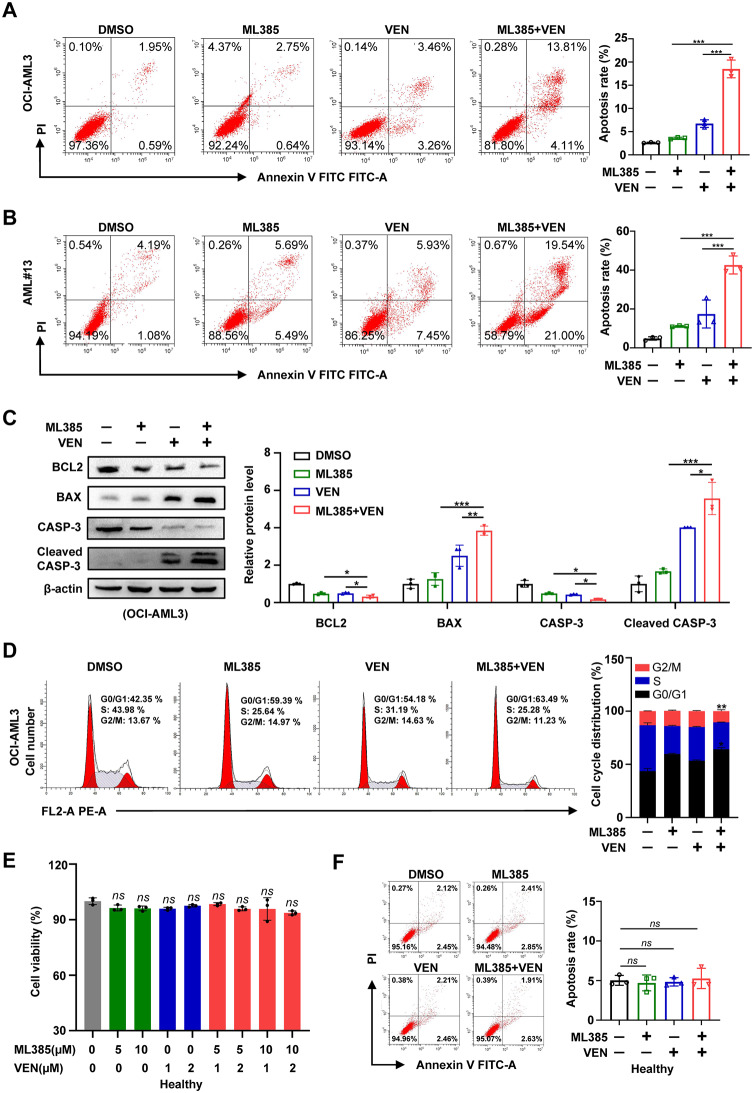
Results: In this study, we identified significant ROS accumulation in leukemia cells with NPM1 mutations. Meanwhile, elevated NRF2 expression and its nuclear localization were observed in NPM1-mutated AML cells. The high NRF2 expression levels were at least partially induced by fat mass and obesity-associated protein (FTO) via m6A modification. Functionally, NRF2 exerts its antioxidant effects by transcriptionally upregulating malic enzyme 1 (ME1) expression and enhancing its activity. Targeting NRF2/ME1 axis reduced NADPH/NADP+ ratio, increased ROS levels, impaired leukemia cell viability, and promoted apoptosis. More importantly, NRF2 inhibitor ML385 in combination with venetoclax showed synergistic anti-leukemic activity in vitro and in vivo.

Conclusion: Overall, our findings provide new insight into the therapeutic potential of targeting NRF2 and guide the development of innovative combination therapies in NPM1-mutated AML.

Keywords: Acute myeloid leukemia; ME1; NRF2; Nucleophosmin 1; Redox homeostasis; Venetoclax.


Conflict of interest statement

Declarations. Ethics approval and consent to participate: Ethical approval was given by the Medical Ethics Committee of Chongqing Medical University. All animal procedures to be employed in the project was approved by Institutional Animal Care and Use of Chongqing Medical University (Approval number: IACUC-CQMU-2025-0338). Competing interests: The authors declare no competing interests.

Figures

Fig. 1
Fig. 1
ROS burden is increased in NPM1-mutated leukemia cells. (A) A scatter plot of the enriched up-regulated Gene Ontology (GO) pathways in OCI-AML2-NPM1-mA vs. OCI-AML2-vector is shown in the bubble plot, highlighting the pathways significantly enriched in NPM1-mA-overexpressing cells. (B) Gene set enrichment analysis (GSEA) showing differential enrichment of genes related to superoxide anion generation and positive regulation of superoxide anion generation. The data were from the RNA-seq. (C) Flow cytometry analysis of superoxide levels using DHE staining in leukemia cells. (D) Flow cytometry analysis of mitochondrial superoxide levels using MitoSOX Red staining in leukemia cells. (E, G) Flow cytometry analysis of superoxide levels using DHE staining in NPM1-mA-silenced OCI-AML3 cells (E) or in NPM1-wt-enforced OCI-AML2 and NPM1-mA-enforced OCI-AML2 cells (G). (F, H) Flow cytometry analysis of mitochondrial superoxide levels using MitoSOX Red staining in NPM1-mA-silenced OCI-AML3 cells (F) or in NPM1-wt-enforced OCI-AML2 and NPM1-mA-enforced OCI-AML2 cells (H). Data were presented as the mean ± SD of three independent experiments. *p < 0.05, **p < 0.01, ***p < 0.001, ns, not significant
Fig. 2
Fig. 2
Antioxidant regulator NRF2 is aberrantly expressed and correlated with worse prognosis in NPM1-mutated AML. (A, B) The transcript levels of NRF2 (NFE2L2) in NPM1-mutated AML cases compared to NPM1-unmutated AML cases from GSE68466 (A) and TCGA (B) databases. (C) Overall survival and Post progression survival based on high-NRF2 (NFE2L2) or low-NRF2 (NFE2L2) in primary NPM1-mutated AML samples from the KM plotter database (http://kmplot.com). (D, E) qRT-PCR analysis of relative NRF2 mRNA expression in primary AML blasts (D) and AML cell lines (E). (F) Western blot analysis of relative NRF2 protein expression in AML cell lines. (G) Immunofluorescence microscopy after staining with NRF2 (red) and DAPI (blue) demonstrated NRF2 expression in OCI-AML3, OCI-AML2 cells. Scale bar: 20 μm. (H, L) qRT-PCR analysis of relative NRF2 mRNA levels in NPM1-mA-silenced OCI-AML3 cells (H), and NPM1-wt-enforced OCI-AML2, NPM1-mA-enforced OCI-AML2 cells (L). (I, M) Western blot analysis of relative NRF2 protein levels in NPM1-mA-silenced OCI-AML3 cells (I), and NPM1-wt-enforced OCI-AML2, NPM1-mA-enforced OCI-AML2 cells (M). (J, N) Western blot analysis of cytoplasmic and nuclear NRF2 protein levels in NPM1-mA-silenced OCI-AML3 cells (J), and NPM1-wt-enforced OCI-AML2, NPM1-mA-enforced OCI-AML2 cells (N). β-actin was used as the cytoplasmic control. Histone H3 was used as the nuclear control. (K, O) Immunofluorescence microscopy of NRF2 in NPM1-mA-silenced OCI-AML3 cells (K), and NPM1-wt-enforced OCI-AML2, NPM1-mA-enforced OCI-AML2 cells (O). Scale bar: 20 μm. Data were presented as the mean ± SD of three independent experiments. *p < 0.05, **p < 0.01, ***p < 0.001, ns, not significant
Fig. 3
Fig. 3
FTO-mediated m6A modification upregulates NRF2 expression in leukemia cells. (A) Schematic diagram of NPM1-mA stabilizing FTO to down-regulate m6A abundance and thereby take part in transcriptional regulation. The mechanism by which NPM1-mA stabilizes FTO is as we previously described [35]. Created in https://BioRender.com. (B) Prediction score of m6A distribution in NRF2 (NFE2LE) mRNA sequence using SRAMP. (C) The correlation analysis within FTO and NRF2 (NFE2L2) expression in AML patients was identified by GEPIA (http://gepia.cancer-pku.cn/index.html). (D, F) qRT-PCR analysis of relative FTO and NRF2 mRNA levels in FTO-silenced OCI-AML3 cells (D), and FTO-enforced OCI-AML2 (F). (E, G) Western blot analysis of relative FTO and NRF2 protein levels in FTO-silenced OCI-AML3 cells (E), and FTO-enforced OCI-AML2 (G). (H) qRT-PCR analysis of NRF2 mRNA levels after silencing FTO and inhibiting FTO activity treated by 20 µM FB23-2 and 50 µM MA for 24 h in OCI-AML3 cells. (I) RIP-qPCR assay showed significant binding of FTO to NRF2 mRNA. (J) m6A RIP assay showed that knockdown of FTO significantly increased the level of m6A modification of NRF2 mRNA in OCI-AML3 cells. (K) RNA stability assay showed that knockdown of FTO decreased the stability of NRF2 mRNA after OCI-AML3 cells were treated with 5 µg/mL of Act-D for 0, 2, 4, 6 and 8 h. (L) RNA stability assay showed that inhibition of FTO decreased the stability of NRF2 mRNA after OCI-AML3 cells were treated with 5 µg/mL of Act-D for 0, 2, 4, 6 and 8 h. (M) Western blot analysis of relative FTO and NRF2 protein levels in NPM1-mA-silenced OCI-AML3 cells following FTO overexpression. Data were presented as the mean ± SD of three independent experiments. *p < 0.05, **p < 0.01, ***p < 0.001, ns, not significant
Fig. 4
Fig. 4
NRF2/ME1 antioxidant program is activated to promote redox homeostasis and leukemia cell survival. (A, B) Overall survival based on high-ME1 or low-ME1 in primary NPM1-mutated AML samples from the KM plotter (A) and beat-AML (B) database. (C) qRT-PCR analysis of antioxidative genes downstream of NRF2 in NRF2-knockdown OCI-AML3 cells. (D) Measurement of NADPH/NADP+ ratio in OCI-AML3 cells transfected with siME1. (E) Flow cytometry analysis of superoxide level using DHE staining in OCI-AML3 cells transfected with siME1. (F) CCK-8 assay of cell proliferation activity in siME1 transduced OCI-AML3 cells. (G) Flow cytometry analysis of cell apoptosis in siME1 transduced OCI-AML3 cells. (H) Western blot analysis of ME1 protein levels in NRF2-knockdown OCI-AML3 cells. (I) Measurement of ME1 activity in NRF2-knockdown OCI-AML3 cells. (J) Schematic diagram of four antioxidant response elements (AREs) in the promoter region of ME1 (− 2004, − 1162, +30, and + 236 referenced to the transcription start site [TSS]). (K) Relative enrichment of NRF2 on the ARE4 of the ME1 promoter was measured by ChIP. (L) Relative enrichment of NRF2 on the ME1 promoter was measured by ChIP in NPM1-wt-enforced cells and NPM1-mA-enforced cells. (M) qRT-PCR analysis of relative ME1 mRNA levels in NPM1-mA-enforced OCI-AML2 cells following NRF2 knockdown. (N) Western blot analysis of relative ME1 protein levels in NPM1-mA-enforced OCI-AML2 cells following NRF2 knockdown. (O) Measurement of ME1 activity in NPM1-mA-enforced OCI-AML2 cells following NRF2 knockdown. Data were presented as the mean ± SD of three independent experiments. *p < 0.05, **p < 0.01, ***p < 0.001, ns, not significant
Fig. 5
Fig. 5
Genetic and pharmacological inhibition of NRF2 trigger oxidative stress and induce leukemia cell death. (A) Measurement of NADPH/NADP+ ratio in NRF2-silenced OCI-AML3 cells. (B) Flow cytometry analysis of superoxide level using DHE staining in NRF2-silenced OCI-AML3 cells. (C) CCK-8 assay of cell proliferation activity in NRF2-silenced OCI-AML3 cells. (D) Flow cytometry analysis of cell apoptosis in NRF2-silenced OCI-AML3 cells. (E) Western blot analysis of relative NRF2 and ME1 protein levels in OCI-AML3 cells treated with 0, 10, 20 µM ML385 for 72 h. (F) Measurement of ME1 activity in OCI-AML3 cells treated with 0, 10, 20 µM ML385 for 72 h. (G) Measurement of NADPH/NADP+ ratio in OCI-AML3 cells treated with 0, 10, 20 µM ML385 for 72 h. (H) Flow cytometry analysis of superoxide level using DHE staining in OCI-AML3 cells treated with 0, 10, 20 µM ML385 for 72 h. (I) CCK-8 assay of cell proliferation activity in OCI-AML3 cell with 0, 10, 20 µM ML385 for 0, 24, 48, 72 h. (J) Flow cytometry analysis of cell apoptosis in OCI-AML3 cells treated with 0, 10, 20 µM ML385 for 72 h. Data were presented as the mean ± SD of three independent experiments. *p < 0.05, **p < 0.01, ***p < 0.001
Fig. 6
Fig. 6
ML385 cooperates with VEN to reduce the viability of AML cells. (A) The schematic depiction of experiments about drug treatment. Created in https://BioRender.com. (B) HSA synergy scores of ML385 combination with indicated drugs, including VEN (2µM), Ara-C (500nM) and DNR (50nM) in OCI-AML3 cells for 48 h. HSA scores greater than 10 suggest synergy, scores less than − 10 suggest an antagonistic effect, scores between − 10 and 10 suggest addition effect. (C, D) CCK-8 assay of cell viability in OCI-AML3 (C) or AML#13 (D) cells treated with ML385 and VEN, alone or in combination for 48 h. (E, F) Dose-response matrix of combination response of ML385 + VEN for 48 h in OCI-AML3 cells (E) or AML#13 cells (F). (G, H) Calculation of HSA synergy scores and visualization of synergy maps by SynergyFinder in OCI-AML3 cells (G) or AML#13 (H) treated with ML385 + VEN for 48 h. Data were presented as the mean ± SD of three independent experiments. *p < 0.05, **p < 0.01, ***p < 0.001
Fig. 7
Fig. 7
ML385 cooperates with VEN to induce the cell death of AML cells. (A, B) Flow cytometry analysis of cell apoptosis in OCI-AML3 cells (A) and AML#13 cells (B) treated with ML385 and VEN, alone or in combination for 48 h. (C) Western blot analysis of these apoptosis related proteins in OCI-AML3 cells treated with ML385 and VEN, alone or in combination for 48 h. (D) Flow cytometric analysis of cell cycle distribution in OCI-AML3 cells treated with ML385 and VEN, alone or in combination for 48 h. (E, F) CCK-8 assay of cell viability (E) and flow cytometry analysis of cell apoptosis (F) in the mononuclear cells from healthy donors. Data were presented as the mean ± SD of three independent experiments. *p < 0.05, **p < 0.01, ***p < 0.001
Fig. 8
Fig. 8
ML385 shows anti-leukemic activity in a CDX model both as a single agent and in combination with venetoclax. (A) Establishment and treatment schedule of CDX mice model via intravenous injection OCI-AML3 cells. (B) Flow cytometric analysis of human CD45+ cells percentage in the bone marrow (BM). (C) Spleen images of the mice after treatment. (D, E) The weight of the spleens (D) and livers (E) of the mice after treatment. (F) Representative H&E staining images of mice liver and spleen. Scale bar: 50 μm. (G) Wright’s staining of immature cells from bone marrow (BM). Scale bar: 50 μm. (H) Western blot analysis of apoptosis related proteins. (I) Kaplan-Meier analysis of the survival curves of the mice in each group. Data were presented as the mean ± SD (n = 5). *p < 0.05, **p < 0.01, ***p < 0.001
Fig. 9
Fig. 9
Schematic diagram describing the functional significance of NRF2/ME1 antioxidant pathway and the novel therapy strategy targeting NRF2 in NPM1-mutated leukemia. NRF2 is modulated by FTO-mediated m6A demethylation and promotes ME1 expression by NADPH generation to maintain redox homeostasis. NRF2 inhibition alone or in combination with venetoclax could be used to kill leukemia cells. Created in BioRender (https://BioRender.com/t85t921)

Similar articles

References

    1. Deschler B, Lübbert M. Acute myeloid leukemia: epidemiology and etiology. Cancer. 2006;107:2099–107. - PubMed
    1. DiNardo CD, Erba HP, Freeman SD, Wei AH. Acute myeloid leukaemia. Lancet. 2023;401:2073–86. - PubMed
    1. Falini B, Martelli MP, Bolli N, Sportoletti P, Liso A, Tiacci E, Haferlach T. Acute myeloid leukemia with mutated nucleophosmin (NPM1): is it a distinct entity? Blood. 2011;117:1109–20. - PubMed
    1. Falini B, Brunetti L, Sportoletti P, Martelli MP. NPM1-mutated acute myeloid leukemia: from bench to bedside. Blood. 2020;136:1707–21. - PubMed
    1. Ranieri R, Pianigiani G, Sciabolacci S, Perriello VM, Marra A, Cardinali V, et al. Current status and future perspectives in targeted therapy of NPM1-mutated AML. Leukemia. 2022;36:2351–67. - PMC - PubMed

LinkOut - more resources