. 2025 Jun;31(6):e70484.
doi: 10.1111/cns.70484.

Vagus Nerve Stimulation Inhibits DNA and RNA Methylation in a Rat Model of Pilocarpine-Induced Temporal Lobe Epilepsy

Affiliations

Vagus Nerve Stimulation Inhibits DNA and RNA Methylation in a Rat Model of Pilocarpine-Induced Temporal Lobe Epilepsy

Zhonghua Xiong et al. CNS Neurosci Ther. 2025 Jun.

Abstract

Introduction: Vagus nerve stimulation (VNS) represents a clinically approved neuromodulatory intervention for managing refractory epilepsy. VNS exhibits antiepileptogenic effects in animal models; the molecular and cellular mechanisms driving these effects have yet to be fully elucidated. Epigenetic alterations, including DNA and RNA methylation, are implicated in the pathogenesis of epilepsy. This study was designed to examine whether VNS inhibits DNA/RNA methylation in temporal lobe epilepsy.

Methods: A rat model of temporal lobe epilepsy induced by intraperitoneal injection of lithium chloride-pilocarpine was used. Naïve control group, Pilo groups (8 and 12 weeks after pilocarpine respectively), VNS group (VNS stimulation for 4w and 8w respectively), and Sham group (VNS off control group, with VNS implanted but not turned on for 4w and 8w respectively). The rats were monitored by video-EEG. DNMT1 (DNA methyltransferase-1), DNMT3A (methyltransferase-3A), 5-hmC (5-hydroxymethyl-cytosine), 5-mC (5-methyl-cytosine), METTL3 (RNA methyltransferase like 3), METTL14 (RNA methyltransferase like 14) were quantified via immunohistochemistry and Western blot.

Results: Pilocarpine-induced epileptic animals were characterized by overexpression of 5-mC, DNMT1, DNMT3A, METTL3, and METTL14, and a decrease of 5-hmC. Compared to the Pilo group, VNS significantly inhibited the overexpression of 5-mC, DNMT1, DNMT3A, METTL3, and METTL14, reduced the downregulation of 5-hmC, and attenuated spontaneous recurrent seizures (SRSs).

Conclusions: We conclude that VNS reduces the number of SRSs in a rat model of epilepsy, concurrently reducing the expression of 5-mC, DNMT1, DNMT3A, METTL3, and METTL14, as well as the increase of 5-hmC. These findings suggest that epigenetic modifications, specifically the suppression of DNA and RNA methylation, could constitute a potential target of VNS-mediated antiepileptic effects.

Keywords: 5‐hmC; 5‐mC; METTL14; METTL3; epilepsy; vagus nerve stimulation.


Conflict of interest statement

The authors declare no conflicts of interest.

Figures
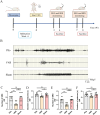
FIGURE 1
FIGURE 1
The experimental schedule and results of EEGs. (A) The experimental design and schedule. VNS = Vagus nerve stimulation, SRSs = spontaneous recurrent seizures, EEG = electroencephalogram. (B) Representative EEG recordings from the hippocampus showed spontaneous electrographic seizures in the Pilo, VNS, and Sham in the 4th week. (C, D) The mean number of SRSs and mean seizure duration of the VNS group was significantly shorter than that of the Sham group in the 4th week (*p < 0.05, **p < 0.01, n = 12). No significant difference was observed between the Pilo group and the Sham group. (E, F) The mean number of SRSs and mean seizure duration of the VNS group was significantly shorter than that of the Sham group in the 8th week (*p < 0.05, **p < 0.01, ***p < 0.001, n = 12). No significant difference was observed between the Pilo group and the Sham group.
FIGURE 2
FIGURE 2
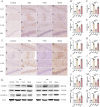
Effect of VNS on 5mC, DNMT1, and DNMT3A expression in the hippocampus. Immunohistochemical staining and western blotting of 5mC were evaluated in the hippocampus at 4th and 8th weeks after SE. (A) Immunoreactivity of 5mC was present in neuronal cells with only weak staining (Aa‐d) in the control group. Compared to the control group, the Pilo group (Ae‐h, inset arrow) showed higher expression of 5mC in the CA1 (B), CA3 (C), CA4 (D) and DG (E) regions (***p < 0.001 respectively). No statistical difference within hippocampal regions was discovered across Sham (Am‐p) and the Pilo groups (p > 0.05 respectively). Compared to the Pilo group, significantly lower expression of 5mC in the VNS group (Ai‐l) was detected within hippocampal regions (***p < 0.001 respectively). (F) In the 8 weeks VNS stimulation study, compared to the control group (Aa‐d), the Pilo group (Fe‐h, inset arrow) showed higher expression of 5mC in the CA1 (G), CA3 (H), CA4 (I) and DG (J) regions (***p < 0.001 respectively). No statistical difference within hippocampal regions was discovered across Sham groups (F, m–p) and the Pilo (p > 0.05 respectively). Compared to the Pilo group, significantly lower expression of 5mC in the VNS group (Fi‐l) was detected within hippocampal regions (***p < 0.001 respectively). (K) Western blot analysis was performed to quantify the amount of DNMT1 and DNMT3A in total homogenates of the hippocampus from rats in each group. (L–O) Compared with the control group, DNMT1 and DNMT3A levels in the hippocampus were elevated in the Pilo and Sham groups (***p < 0.001). The levels of DNMT1 and DNMT3A in the VNS group were considerably lower than those in the Pilo group (*p < 0.05, **p < 0.01, ***p < 0.001). No significant difference in DNMT1 and DNMT3A levels was detected between the Pilo and Sham groups. All Figures shown were representative examples based on the analysis of rats (n = 6) per group. Scale bars = 20 μm (CA1, CA3, CA4 and DG).
FIGURE 3
FIGURE 3
Effect of VNS on 5hmC expression in the hippocampus. Immunohistochemical staining and western blotting of 5hmC were evaluated in the hippocampus at 4th and 8th weeks after SE. (A) Immunoreactivity of 5hmC was present in astrocyte cells. Compared to the control group (A, a–d, inset arrow), the Pilo group (A, e–h) showed lower expression of 5hmC in the CA1 (B), CA3 (C), CA4 (D) and DG (E) regions (***p < 0.001 respectively). No statistical difference within hippocampal regions was discovered across Sham (A, m–p) and the Pilo groups (p > 0.05 respectively). Compared to Pilo group, significantly higher expression of 5hmC in the VNS group (A, i–l) was detected within hippocampal regions (***p < 0.001 respectively). (F) In the 8 weeks VNS stimulation study, compared to the control group (F, a–d, inset arrow), the Pilo group (F, e–h) showed lower expression of 5hmC in the CA1 (G), CA3 (H), CA4 (I) and DG (J) regions (***p < 0.001 respectively). No statistical difference within hippocampal regions was discovered across Sham groups (F, m–p) and the Pilo (p > 0.05 respectively). Compared to Pilo group, significantly higher expression of 5hmC in the VNS group (F, i–l) was detected within hippocampal regions (***p < 0.001 respectively). All Figures shown were representative examples based on the analysis of rats (n = 6) per group. Scale bars = 20 μm (CA1, CA3, CA4 and DG).
FIGURE 4
FIGURE 4
Effect of VNS on the METTL3 expression in hippocampus. Immunohistochemical staining and western blotting of METTL3 were evaluated in the hippocampus at 4th and 8th weeks after SE. (A) Immunoreactivity of METTL3 was present in sparse neuronal cells with only weak staining (A, a–d) in the control group. Compared to the control group, the Pilo group (A, e–h, inset arrow) showed higher expression of METTL3 in the CA1 (B), CA3 (C), CA4 (D) and DG (E) regions (***p < 0.001 respectively). No statistical difference within hippocampal regions was discovered across Sham (A, m–p) and the Pilo groups (p > 0.05 respectively). Compared to the Pilo group, significantly lower expression of METTL3 in the VNS group (A, i–l) was detected within hippocampal regions (*p < 0.05, ***p < 0.001 respectively). (F) In the 8 weeks VNS stimulation study, compared to the control group, the Pilo group (F, e–h) showed higher expression of METTL3 in the CA1 (G), CA3 (H), CA4 (I) and DG (J) regions (***p < 0.001 respectively). No statistical difference within hippocampal regions was discovered across Sham groups (F, m–p, inset arrow) and the Pilo (p > 0.05 respectively). Compared to the Pilo group, significantly lower expression of METTL3 in the VNS group (F, i–l) was detected within hippocampal regions (***p < 0.001 respectively). (K) Western blot analysis was performed to quantify the amount of METTL3 in total homogenates of the hippocampus from rats in each group. (L–M) Compared with the control group, METTL3 levels in the hippocampus were elevated in the Pilo and Sham groups (***p < 0.001). The levels of METTL3 in the VNS group were considerably lower than those in the Pilo group (***p < 0.001). No significant difference in METTL3 levels was detected between Pilo and Sham groups. All Figures shown were representative examples based on the analysis of rats (n = 6) per group. Scale bars = 20 μm (CA1, CA3, CA4 and DG).
FIGURE 5
FIGURE 5
Effect of VNS on the METTL14 expression in thehippocampus. Immunohistochemical staining and western blotting of METTL14 were evaluated in the hippocampus at 4th and 8th weeks after SE. (A) Immunoreactivity of METTL14 was present in sparse neuronal cells with only weak staining (A, a–d) in control group. Compared to the control group, the Pilo group (A, e–h, inset arrow) showed higher expression of METTL14 in the CA1 (B), CA3 (C), CA4 (D) and DG (E) regions (***p < 0.001 respectively). No statistical difference within hippocampal regions was discovered across Sham (A, m–p) and the Pilo groups (p > 0.05 respectively). Compared to Pilo group, significantly lower expression of METTL14 in the VNS group (A, i–l) was detected within hippocampal regions (***p < 0.001 respectively). (F) In the 8 weeks VNS stimulation study, compared to the control group (F, a–d), the Pilo group (F, e–h, inset arrow) showed higher expression of METTL14 in the CA1 (G), CA3 (H), CA4 (I) and DG (J) regions (***p < 0.001 respectively). No statistical difference within hippocampal regions was discovered across Sham groups (F, m–p) and the Pilo (p > 0.05 respectively). Compared to Pilo group, significantly lower expression of METTL14 in the VNS group (F, i–l) was detected within hippocampal regions (***p < 0.001 respectively). (K) Western blot analysis was performed to quantify the amount of METTL14 in total homogenates of the hippocampus from rats in each group. (L–M) Compared with control group, METTL14 levels in the hippocampus were elevated in the Pilo and Sham groups (***p < 0.001). The levels of METTL14 in the VNS group were considerably lower than that in the Pilo group (***p < 0.001). No significant difference in METTL14 levels was detected between Pilo and Sham groups. All Figures shown were representative examples based on the analysis of rats (n = 6) per group. Scale bars = 20 μm (CA1, CA3, CA4 and DG).

Similar articles

References

    1. Kwan P., Schachter S. C., and Brodie M. J., “Drug‐resistant epilepsy,” New England Journal of Medicine 365 (2011): 919–926, 10.1056/NEJMra1004418. - DOI - PubMed
    1. Kanner A. M., “Management of Psychiatric and Neurological Comorbidities in Epilepsy,” Nature Reviews. Neurology 12 (2016): 106–116, 10.1038/nrneurol.2015.243. - DOI - PubMed
    1. J. Engel, Jr. , Wiebe S., French J., et al., “Practice Parameter: Temporal Lobe and Localized Neocortical Resections for Epilepsy: Report of the Quality Standards Subcommittee of the American Academy of Neurology, in Association With the American Epilepsy Society and the American Association of Neurological Surgeons,” Neurology 60 (2003): 538–547, 10.1212/01.wnl.0000055086.35806.2d. - DOI - PubMed
    1. Elliott R. E., Rodgers S. D., Bassani L., et al., “Vagus Nerve Stimulation for Children With Treatment‐Resistant Epilepsy: A Consecutive Series of 141 Cases,” Journal of Neurosurgery. Pediatrics 7 (2011): 491–500, 10.3171/2011.2.Peds10505. - DOI - PubMed
    1. Guo M., Wang J., Tang C., et al., “Vagus Nerve Stimulation for Refractory Posttraumatic Epilepsy: Efficacy and Predictors of Seizure Outcome,” Frontiers in Neurology 13 (2022): 954509, 10.3389/fneur.2022.954509. - DOI - PMC - PubMed

LinkOut - more resources