. 2025 Sep;56(9):2772-2781.
doi: 10.1161/STROKEAHA.125.050839. Epub 2025 Jun 19.

Investigation of Poststroke Depression Following a Nucleus Accumbens Infarct in Mice

Affiliations

Investigation of Poststroke Depression Following a Nucleus Accumbens Infarct in Mice

Jonathan Bouchard et al. Stroke. 2025 Sep.

Abstract

Background: Poststroke depression (PSD) affects ≈33% of individuals 1 year after a stroke. Blood-brain barrier (BBB) dysfunction in the nucleus accumbens (NAc), a hub for emotional processing, reward, and mood regulation, has been linked to stress-induced depressive-like behaviors in male mice. Neurovascular alterations were also observed in postmortem tissue samples from men with a diagnosis of major depression. Thus, we aimed to investigate if BBB changes in the NAc could contribute to PSD pathophysiology.

Methods: Stereotaxic injection of ET-1 (endothelin-1), a potent vasoconstrictor, was performed in the NAc of male mice to create a focal brain stroke, and then, infarct size and localization were assessed and quantified. We subsequently evaluated transcriptomic and morphological effects of the infarct on BBB-related genes and cells in the NAc, particularly those known to be altered after stress exposure in mice or human depression. BBB integrity was assessed with a dextran dye, and magnetic resonance imaging scans were conducted before versus after the injection of Gadovist, a contrast agent. Last, a battery of behavioral tests related to depressive- and anxiety-like behaviors was performed to determine if an infarct in the NAc is sufficient to induce a PSD-like phenotype.

Results: Following ET-1 injection, ≈50% of the total lesion was observed in the NAc leading to BBB hyperpermeability in this brain area. BBB gene expression was impacted by ET-1, and also surgery alone and profiles were differentially regulated throughout time up to 14 days. Gliosis in the NAc was observed with increased reactivity of astrocytes and microglia. The effect of ET-1 on PSD-like symptoms was limited. However, body weight, sociability, and activity were affected by surgery with a more pronounced impact of ET-1 on social interactions compared with naive animals.

Conclusions: While no clear PSD phenotype was observed following an ET-1-induced stroke in the NAc of male mice, our study shed light on the technical complexity of focal lesions in deep brain structures, an understudied phenomenon occurring in humans. We provide technical insights for the development of a mouse model of deep brain lesions, characterize its impact at molecular, cellular, and behavioral levels, and highlight the need to control for vascular alterations when performing stroke surgeries.

Keywords: behavior; blood-brain barrier; depression; disease models, animal; gene expression.


Conflict of interest statement

None.

Figures
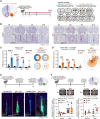
Figure 1.
Figure 1.
Establishment of the ET-1 (endothelin-1) unilateral stroke model in the mouse nucleus accumbens (NAc). A, Coronal section and coordinates for stereotaxic injection of either ET-1 or water (sham) in the left NAc and experimental timeline. Schematic illustration of ET-1 lesions across 10 sections and analysis strategies for total (left hemisphere) or NAc lesion quantification. B, Representative images of cresyl violet staining showing damage induced in a sham (left) vs ET-1–injected animal (right) at day (D) 1, D3, D7, and D14 post-surgery. C, Total lesion volume (mm3) across time for ET-1 vs sham-injected animals (2-way ANOVA: stroke×time interaction: *P=0.0121; n=3–4/group; D1: P≤0.0001; D3: P≤0.0001; D7: P=0.0009; and D14: P=0.1056). Pie charts represent the percentage of total ET-1 injury located in the NAc at D1 (48.64%), D3 (51.10%), D7 (53.73%), and D14 (65.64%) post-surgery. D, NAc lesion volume (mm3) across time for ET-1 vs sham-injected animals (2-way ANOVA: stroke effect: ****P≤0.0001; time effect: **P=0.0085; n=3–4/group; D1: P=0.0005; D3: P=0.0001; D7: P=0.0040; and D14: P=0.2558). Pie charts represent the percentage of D1 lesions in the NAc after ET-1 injury at D3 (86.1%), D7 (70.1%), and D14 (23.0%) post-surgery. E, ET-1–induced blood-brain barrier leakiness in the NAc was confirmed by retro-orbital injection of a 10-kDa dextran dye tagged with Alexa Fluor 488. Endothelial cells were stained with the Podxl (podocalyxin) marker and 4′,6-diamidino-2-phenylindole (DAPI) for nuclei. F, T1-weight magnetic resonance imaging (MRI) signal in the NAc before vs after intravenous injection of the contrast agent Gadovist in sham vs ET-1–injected mice at D7 (2-way ANOVA: Gadovist effect: **P=0.0017; n=5/group) and D14 (2-way ANOVA: stroke effect: *P=0.0189; n=5/group). T1 signal in the NAc left (injected) hemisphere was normalized on the right intact hemisphere. Data represent mean±SEM. Two-way ANOVA followed by the Tuckey multiple comparison test was applied with ****P≤0.0001, ***P≤0.001, **P≤0.01, and *P≤0.05.
Figure 2.
Figure 2.
Transcriptional response and morphological changes following nucleus accumbens (NAc) infarct across time. A, Time-dependent expression of genes associated with endothelial cells (Pecam1; sham: day [D] 3: P=0.0027; D7: P≤0.0001; and D14: P=0.0005; ET-1 (endothelin-1): D3: P=0.5992; D7: P≤0.0001; and D14: P=0.0001), tight junctions (Cldn5: ET-1: D7: P=0.0005 and D14: P=0.0007; Ocln: ET-1: D14: P≤0.0001; Tjp1: sham: D3: P≤0.0001; D7: P=0.9822; and D14: P≤0.0001; and ET-1: D3: P≤0.0001; D7: P=0.6415; and D14: P≤0.0001), astrocyte reactivity (Gfap: ET-1: D7: P≤0.0001), and angiogenesis (Vegfa) in sham (left) or ET-1–injected mice (right). The dotted line represents normalized gene expression vs 1 day post-surgery for each gene. B, Gene expression of sham or ET-1–injected mice normalized to naive animals that did not undergo surgery (dotted line) for Pecam1, Cldn5, Ocln, Tjp1, Gfap, and Vegfa blood-brain barrier–related genes with significant effects for sham: Pecam1 (2-way ANOVA: surgery effect: P≤0.0001), Gfap (2-way ANOVA: surgery effect: P=0.0080), Vegfa (2-way ANOVA: surgery effect: P=0.0238), ET-1: Pecam1 (2-way ANOVA: stroke effect: naive vs ET-1: P=0.0011; stroke effect: sham vs ET-1: P=0.0003), and Vegfa (stroke effect: sham vs ET-1: P=0.0274). C, Immunostaining of Cldn5 (claudin-5) with the CD31 (cluster of differentiation 31) endothelial cell marker in sham vs ET-1–injected mice. Protein levels were normalized on naive animals, and an increase in Cldn5/CD31 ratio was noted for the ET-1 group at 7 and 14 days poststroke (2-way ANOVA: stroke effect: P=0.0185; n=3–4/group). D, Triple immunostaining with the cell-specific markers NeuN (neuronal nuclei), Gfap (glial fibrillary acidic protein), and Iba-1 (ionized calcium-binding adapter molecule 1) for neurons, astrocytes, and microglia, respectively, revealed gliosis in the NAc of ET-1–injected mice. Data represent mean±SEM. Two-way ANOVA followed by the Tuckey multiple comparison test was applied with ****P≤0.0001, **P≤0.01, and *P≤0.05.
Figure 3.
Figure 3.
Assessment of social, anxiety, and depressive-like behaviors in male mice following ET-1 (endothelin-1)–induced unilateral infarct in the nucleus accumbens (NAc). A, Experimental timeline and groups. B, Changes in body weight across time for naive (light gray), sham (dark gray), and ET-1 (red) mice (n=11–12/group). C, Time spent in the open arms of the elevated plus maze, distance traveled, and representative heatmaps (n=11–12/group). D, Social interaction (SI) ratios (1-way ANOVA: treatment effect: P=0.0006; sham: P=0.0281; and ET-1: P=0.0039), distance traveled, and pie charts representing proportion of mice considered avoidant (SI ratio <1, dark blue) or social (SI ratio >1, light blue) for each group along with representative heatmap of time spent in the arena during the second trial (n=11–12/group). E, Time spent immobile in the tail suspension test (1-way ANOVA: treatment effect: P=0.0021; sham: P=0.0062; and ET: P=0.0053; n=11–12/group). F, Time spent immobile in the forced swim test (left) and sucrose preference over 48 hours (right; n=11–12/group). Data represent mean±SEM. One-way ANOVA followed by the Tuckey multiple comparison test was applied with ****P≤0.0001, ***P≤0.001, **P≤0.01, and *P≤0.05.

References

    1. Campbell BCV, Khatri P. Stroke. Lancet. 2020;396:129–142. doi: 10.1016/S0140-6736(20)31179-X - PubMed
    1. Campbell BCV, De Silva DA, Macleod MR, Coutts SB, Schwamm LH, Davis SM, Donnan GA. Ischaemic stroke. Nat Rev Dis Primers. 2019;5:70. doi: 10.1038/s41572-019-0118-8 - PubMed
    1. Zhang S, Xu M, Liu ZJ, Feng J, Ma Y. Neuropsychiatric issues after stroke: clinical significance and therapeutic implications. World J Psychiatry. 2020;10:125–138. doi: 10.5498/wjp.v10.i6.125 - PMC - PubMed
    1. Hackett ML, Pickles K. Part I: frequency of depression after stroke: an updated systematic review and meta-analysis of observational studies. Int J Stroke. 2014;9:1017–1025. doi: 10.1111/ijs.12357 - PubMed
    1. Taylor-Rowan M, Momoh O, Ayerbe L, Evans JJ, Stott DJ, Quinn TJ. Prevalence of pre-stroke depression and its association with post-stroke depression: a systematic review and meta-analysis. Psychol Med. 2019;49:685–696. doi: 10.1017/S0033291718002003 - PubMed