

Development and evaluation of a multivariable prediction model for clinical improvement in an established cohort of Colombian rheumatoid arthritis patients
- PMID: 40534627
- PMCID: PMC12174781
- DOI: 10.1177/1759720X251342426
Development and evaluation of a multivariable prediction model for clinical improvement in an established cohort of Colombian rheumatoid arthritis patients
Abstract
Background: Rheumatoid arthritis (RA) is a chronic autoimmune disease, and a predicting clinical improvement is essential.
Objectives: The aim of the present study was to identify predictor variables of clinical improvement in patients with RA using artificial intelligence (AI) models in a specialized RA center.
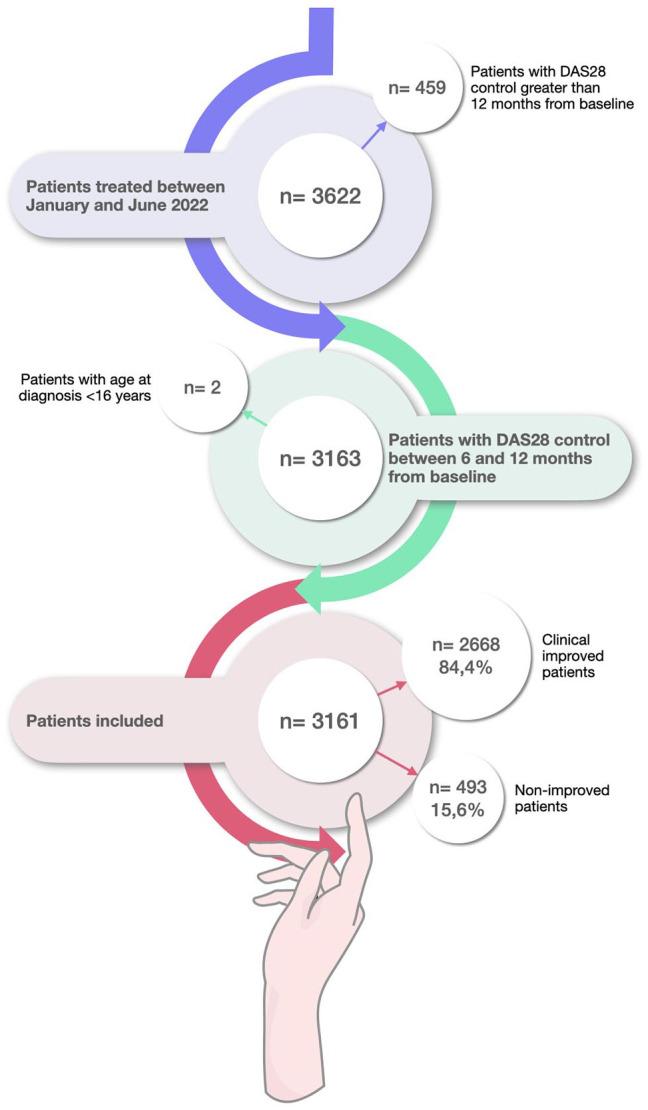
Design: Retrospective cohort study in adult RA patients was conducted between January and June 2022. Follow-up data related to clinical improvement was taken from 6 to 12 months after the baseline. Predictive models were generated by machine learning (ML), by Python programming language. The Transparent Reporting of a multivariate prediction model for Individual Prognosis or Diagnosis (TRIPOD) guidelines were followed to harmonize this study based on AI.
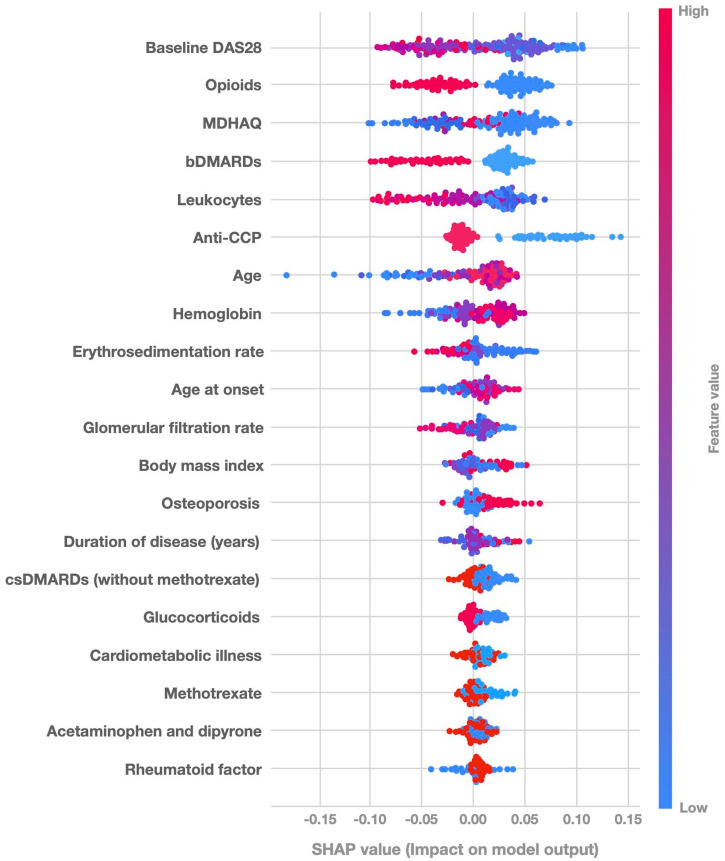
Methods: The response variable was classified as improved and non-improved. Patients were considered improved if they persisted or achieved a Disease Activity Score 28-joints (DAS28) <3.2 at the end of the follow-up period or experienced a decrease ⩾0.6 compared to baseline, regardless of the initial DAS28 value. Explainability techniques in AI were applied to identify the most relevant clinical features.
Results: In total, 3161 RA patients were included. The median age was 65 years (interquartile range (IQR) 57-72). 82.7% were female. Disease duration was 8.3 years (IQR 4.9-11.3). The median value of baseline DAS28 was 2.1 (IQR 2.1-2.8). 2668 (84.4%) were classified as improved, and 493 (15.6%) as non-improved. From ML models, the Extra tree model showed higher sensitivity (0.841). Regarding clinical improvement prediction with the Shapley Additive Explanations method, it was observed that low values of baseline DAS28 were positively associated with clinical improvement. The use of biologic disease-modifying antirheumatic drugs and the presence of anti-cyclic citrullinated peptide (CCP) were related to an increase in the probability of non-improved, which may be secondary to the level of severity of the disease.
Conclusion: AI models in RA can predict clinical improvement at initial consultations, enabling targeted approaches. Disease severity may be influenced by anti-CCP positivity and the use of biologic therapies when conventional treatments fail.
Keywords: artificial intelligence; clinical improvement; machine learning; probability learning; rheumatoid arthritis.
© The Author(s), 2025.
Conflict of interest statement
A.R.-V. reports a relationship with AbbVie Inc., AstraZeneca, Janssen Pharmaceuticals Inc., and Pfizer that includes speaking and lecture fees outside the submitted work. P.S.-M. reports a relationship with AbbVie Inc., Biopass-UCB, Bristol Myers Squibb Co., Eli Lilly, Janssen Pharmaceuticals Inc., Pfizer, Roche Tecnofarma, and Sanofi that includes speaking and lecture fees outside the submitted work. The other authors declare that they have no known competing commercial, financial interests, or personal relationships that could have appeared to influence the work reported in this manuscript.
Figures
Similar articles
-
Prediction of Anti-rheumatoid Arthritis Natural Products of Xanthocerais Lignum Based on LC-MS and Artificial Intelligence.Comb Chem High Throughput Screen. 2025;28(4):627-646. doi: 10.2174/0113862073282138240116112348. Comb Chem High Throughput Screen. 2025. PMID: 38299408 Free PMC article.
-
What makes a 'good' decision with artificial intelligence? A grounded theory study in paediatric care.BMJ Evid Based Med. 2025 May 20;30(3):183-193. doi: 10.1136/bmjebm-2024-112919. BMJ Evid Based Med. 2025. PMID: 39939160 Free PMC article.
-
Surveillance for Violent Deaths - National Violent Death Reporting System, 50 States, the District of Columbia, and Puerto Rico, 2022.MMWR Surveill Summ. 2025 Jun 12;74(5):1-42. doi: 10.15585/mmwr.ss7405a1. MMWR Surveill Summ. 2025. PMID: 40493548 Free PMC article.
-
Assessing the comparative effects of interventions in COPD: a tutorial on network meta-analysis for clinicians.Respir Res. 2024 Dec 21;25(1):438. doi: 10.1186/s12931-024-03056-x. Respir Res. 2024. PMID: 39709425 Free PMC article. Review.
-
Biomarkers for the diagnosis and treatment of rheumatoid arthritis - a systematic review.Postgrad Med. 2023 Apr;135(3):214-223. doi: 10.1080/00325481.2022.2052626. Epub 2022 Mar 16. Postgrad Med. 2023. PMID: 35275765
References
-
- Smolen JS, Aletaha D, McInnes IB. Rheumatoid arthritis. Lancet 2016; 388: 2023–2038. - PubMed
-
- Almutairi KB, Nossent JC, Preen DB, et al. The prevalence of rheumatoid arthritis: a systematic review of population-based studies. J Rheumatol 2021; 48: 669–676. - PubMed
-
- Londoño J, Peláez Ballestas I, Cuervo F, et al. Prevalencia de la enfermedad reumática en Colombia, según estrategia COPCORD-Asociación Colombiana de Reumatología. Estudio de prevalencia de enfermedad reumática en población colombiana mayor de 18 años. Rev Colomb Reumatol 2018; 25: 245–256.
-
- Guzmán Moreno R, Restrepo Suárez JF. Artritis reumatoide temprana. Rev Colomb Reumatol 2002; 9: 171–175.
-
- Aletaha D, Neogi T, Silman AJ, et al. 2010 Rheumatoid arthritis classification criteria: an American College of Rheumatology/European League Against Rheumatism collaborative initiative. Arthritis Rheum 2010; 62: 2569–2581. - PubMed
LinkOut - more resources
Full Text Sources
