

Ultrahypofractionated radiotherapy for localised prostate cancer: The impact of daily MRI-guided adaptive radiotherapy on delivered dose
- PMID: 40534639
- PMCID: PMC12173759
- DOI: 10.1016/j.ctro.2025.100985
Ultrahypofractionated radiotherapy for localised prostate cancer: The impact of daily MRI-guided adaptive radiotherapy on delivered dose
Abstract
Introduction: Magnetic resonance image-guided adaptive radiotherapy (MRIgART) reduces uncertainties by correcting for day-to-day target and organ-at-risk deformation and motion. This is the first study to examine the dosimetric impact of MRIgART for ultrahypofractionated prostate cancer treatment, compared to standard-of-care image-guided non-adapted radiotherapy.
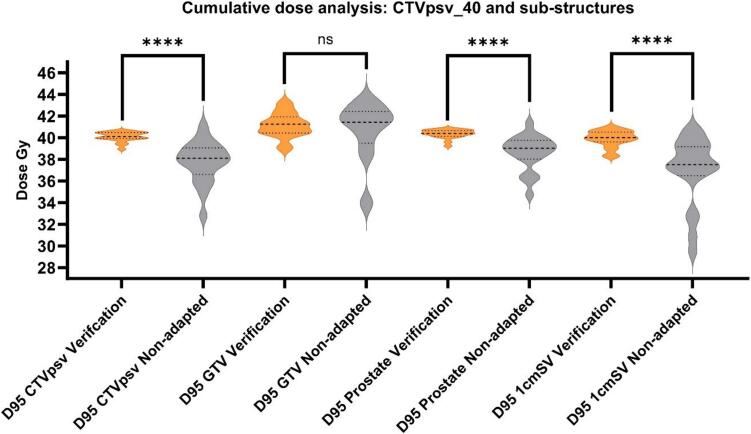
Methods: Twenty patients with localised prostate cancer, who received ultrahypofractionated MRIgART on the Unity MR linac (Elekta, Sweden) were retrospectively analysed. Online daily MRI was acquired for replanning (MRIsession) and a second for position verification before treatment (MRIverification). To compare delivered dose with and without adaptation, three plans were generated offline per fraction; a session plan (reference plan adapted to MRIsession anatomy), a verification plan (session plan recalculated on MRIverfication anatomy), and a non-adapted plan (reference plan recalculated on MRIverfication anatomy). Target and organ-at-risk doses were calculated, and dose difference evaluated.Secondary analysis, using deformable dose accumulation, estimated verification and non-adapted dose to primary target (CTVpsv) substructures; prostate, gross tumour volume (GTV) and proximal 1 cm of seminal vesicles (1cmSV). Impact of prostate, rectum and bladder volume changes on dose were evaluated.
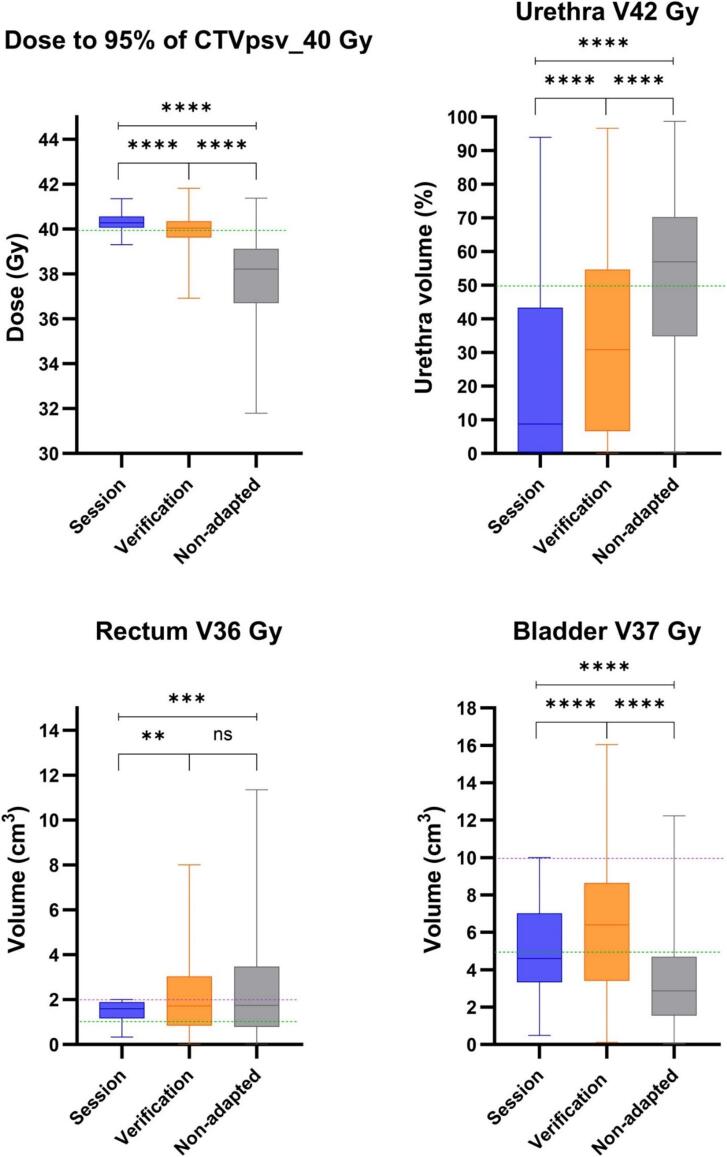
Results: Median dose to 95 % of the CTVpsv was significantly higher with adaptation; 40.3, 40.0 and 38.2 Gy for session, verification, and non-adapted plans. Adaptation achieved a lower median urethra V42Gy dose but bladder V37Gy dose was lower when not adapting. Rectum V36Gy dose was similar for adapted and non-adapted plans.CTVpsv substructure dose difference was greatest for 1cmSV; 40.0 versus 37.5 Gy for verification/non-adapted plans. Adaptation achieved significantly higher prostate only, but not GTV doses. Prostate and rectal volume changes had a negative impact on non-adapted dose only.
Conclusion: MRIgART, offers significant dosimetric benefit for ultrahypofractionated prostate cancer compared to non-adapted strategies. Greatest benefit is expected for those with SV or high-risk of SV involvement, persistent rectal gas, prostate swelling and for the application of novel dose strategies including GTV dose escalation and non-involved prostate dose de-escalation.
Keywords: Adaptive radiotherapy; MRI-guided radiotherapy; Prostate cancer; Ultrahypofractionated radiotherapy.
© 2025 The Author(s).
Conflict of interest statement
The authors declare the following financial interests/personal relationships which may be considered as potential competing interests: S.E. Alexander: Cancer Research UK Programme Grant C33589/A28284. R.A. Mitchell: Cancer Research UK Programme Grant. Elekta Research agreement. A. Dunlop: NIHR Senior Clinical and Practitioner Research Award (SCPRA) holder. U. Oelfke: CRUK Program Grant, Adaptive Data-Driven Radiation Oncology, C33589/A28284, see ICMJE Disclosure form for complete list. H.A. McNair: Royal Marsden Cancer charity. A.C. Tree: Institution research funding from Elekta, Accuracy & Varian, see ICMJE Disclosure form for complete list.
Figures


References
-
- Zelefsky M.J., Kollmeier M., Cox B., Fidaleo A., Sperling D., Pei X., et al. Improved clinical outcomes with high-dose image guided radiotherapy compared with non-IGRT for the treatment of clinically localized prostate cancer. Int J Radiat Oncol Biol Phys. 2012;84:125–129. doi: 10.1016/j.ijrobp.2011.11.047. - DOI - PubMed
-
- Murray J., Griffin C., Gulliford S., Syndikus I., Staffurth J., Panades M., et al. A randomised assessment of image guided radiotherapy within a phase 3 trial of conventional or hypofractionated high dose intensity modulated radiotherapy for prostate cancer. Radiother Oncol. 2020;142:62–71. doi: 10.1016/j.radonc.2019.10.017. - DOI - PMC - PubMed
LinkOut - more resources
Full Text Sources
