. 2025 Jun 18;18(6):986-995.
doi: 10.18240/ijo.2025.06.03. eCollection 2025.

PPARα deficiency exacerbates retinal pathological changes and dysfunction in high-fat diet mice

Affiliations

PPARα deficiency exacerbates retinal pathological changes and dysfunction in high-fat diet mice

Xue Wang et al. Int J Ophthalmol. .

Abstract

Aim: To examined the effects of a high-fat diet (HFD) on retinal pathological changes and dysfunction using peroxisome proliferator-activated receptor-alpha (PPARα) knockout mice.

Methods: For four months, C57BL/6J and PPARα knockout mice received either HFD or a standard diet (SD). A fluorometric method was used to determine the retinal triglycerides. The retinal malondialdehyde (MDA) content was measured. Hematoxylin-eosin was used to evaluate retinal pathological changes. Protein expression was analyzed by Western blot and immunofluorescence, while mRNA expression was evaluated by quantitative reverse transcription-polymerase chain reaction. Electroretinogram was used to assess retinal function.

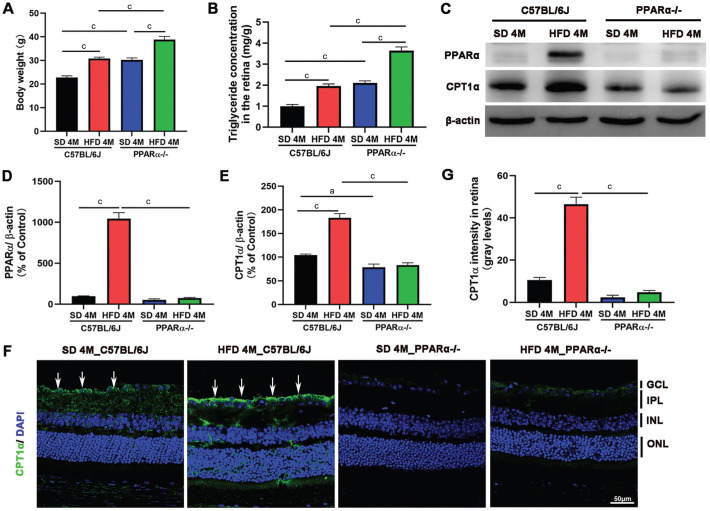
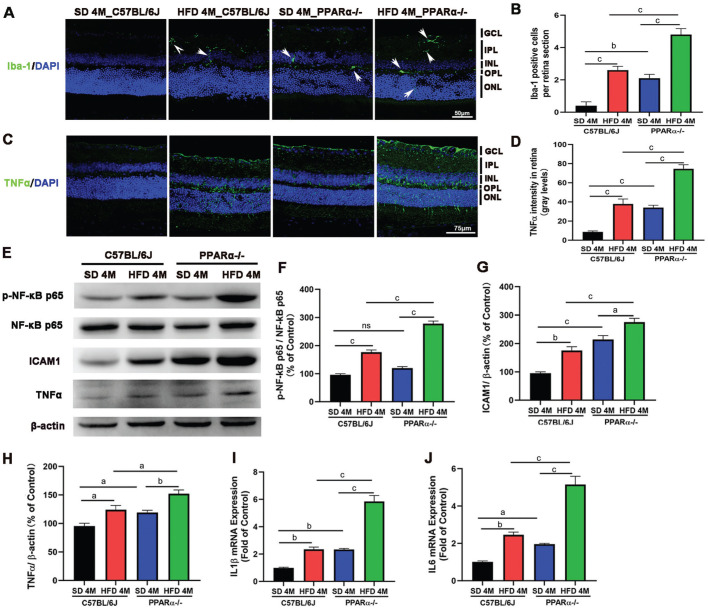
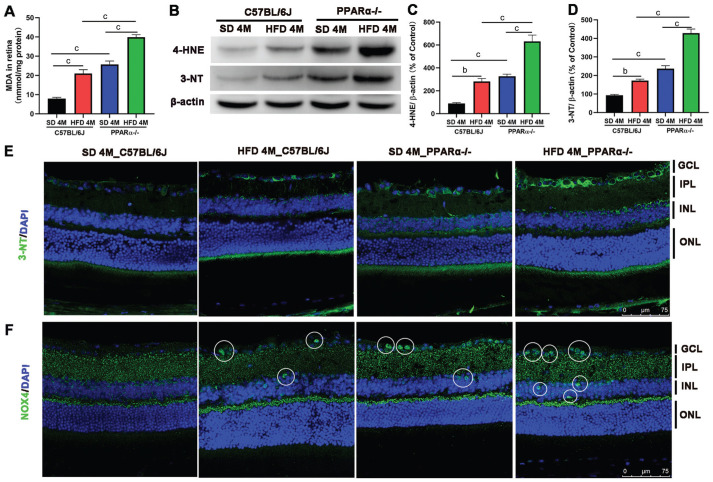
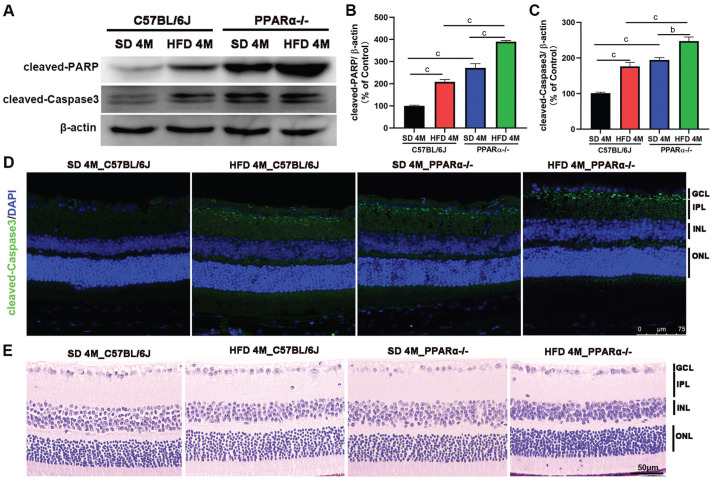
Results: HFD resulted in increased fatty acid β-oxidation in the inner retina, particularly retinal ganglion cells (RGCs), as well as increased weight and accumulation of retinal triglyceride. Retinal fatty acid β-oxidation and triglyceride accumulation were affected by PPARα -/- abnormalities. PPARα knockdown increased the infiltration and activation of inflammatory cells, as well as it upregulated the nuclear factor kappa B (NF-κB) signaling pathway and corresponding proinflammatory cytokine levels in the most retina subjected to the HFD. In the HFD mice, oxidative stress levels were elevated in the inner retina, particularly in the HFD PPARα -/- mice. HFD-induced RGCs apoptosis initiation was exacerbated by PPARα deficiency. Lastly, HFD feeding resulted in the lower amplitudes of scotopic a-wave, b-wave and photopic negative response (PhNR) wave, particularly in HFD PPARα -/- mice.

Conclusion: In HFD-fed mice retina, particularly in the inner retina, PPARα knockout increases lipid metabolic abnormalities, inflammatory responses, oxidative stress, apoptosis initiation and dysfunction.

Keywords: electroretinogram; high-fat diet; peroxisome proliferator-activated receptor-alpha; retina.


Conflict of interest statement

Conflicts of Interest: Wang X, None; Ding JJ, None; Yu CF, None; Xiao DC, None; Tao LM, None; Jiang ZX, None.

Figures

Figure 1
Figure 1. Obesity and abnormal retinal lipid metabolism brought on by HFD were increased by PPARα knockout
For a duration of 4mo, C57BL/6J and PPARα−/− mice were given either a SD or HFD. A: Body weight was examined for mice; B: Triglyceride assay showed the content of triglyceride in retina; C: Representative Western blot images of the retina's PPARα and CPT1α proteins; D, E: Statistical analysis of Western blot. F: Representative immunofluorescence images of CPT1α in the retina (blue: DAPI; green: CPT1α). Arrows indicated CPT1α positive staining. G: CPT1α fluorescent intensity measurement using Image J software (scale bar: 50 µm). n is 5 per group. aP<0.05, cP<0.001. HFD: High-fat diet; PPARα: Peroxisome proliferator activated receptor-alpha; SD: Standard diet; CPT1α: Carnitine palmitoyl transferase 1 alpha; DAPI: 4,6-Diamino-2-phenyl indole; GCL: Ganglion cell layer; IPL: Inner plexiform layer; INL: Inner nuclear layer; ONL: Outer nuclear layer.
Figure 2
Figure 2. PPARα deficiency accelerated HFD-induced inflammatory cell infiltration and NF-κB signaling activation in the retina
Male C57BL/6J and PPARα−/− mice were assigned to either a SD or HFD for a duration of 4mo. A: Representative immunofluorescence images of Iba-1+ microglia (blue: DAPI; green: Iba-1) in the retina. Arrows indicated positively stained microglia. B: The retinal Iba-1 positive cell was quantified; C: Representative immunofluorescence images of TNFα (blue: DAPI; green: TNFα) in the retina; D: Quantification of TNFα fluorescent intensity in the retina; E: Representative Western blot images showing the protein levels of p-NF-κB p65, NF-κB p65, ICAM1, TNFα, and β-actin in the retina; F: Quantitative analysis of the p-NF-κB p65/NF-κB p65 ratio; G, H: Quantification of ICAM1 and TNFα protein levels based on Western blot results; I, J: Real-time PCR results exhibited proinflammatory factors IL1β (I) and IL6 (J) mRNA expression levels in the retina. Scale bar: 50 µm (A). Scale bar: 75 µm (C). n is 5 per group. ns: No significance. aP<0.05, bP<0.01, cP<0.001. NF-κB: Nuclear factor-kappa B; HFD: High-fat diet; PPARα: Peroxisome proliferator activated receptor-alpha; SD: Standard diet; DAPI: 4,6-Diamino-2-phenyl indole; TNFα: Tumor necrosis factor-α; p-NF-κB: Phosphorylated nuclear factor-kappa B; ICAM1: Intercellular adhesion molecule-1; PCR: Polymerase chain reaction; IL: interlenkin; GCL: Ganglion cell layer; INL: Inner nuclear layer; IPL: Inner plexiform layer; OPL: Outer plexiform layer; ONL: Outer nuclear layer.
Figure 3
Figure 3. PPARα deficiency accelerated oxidative stress induced by HFD
For 4mo, mice from the C57BL/6J and PPARα−/− were either exposed to a SD or HFD. A: MDA levels in the retina were measured using an MDA detection kit. B–D: Representative Western blot images (B) and corresponding statistical analyses (C, D) showing protein levels of 4-HNE (B, C) and 3-NT (B, D) in the retina. E, F: Representative immunofluorescence images showing 3-NT (green: 3-NT; blue: DAPI) and NOX4 (green: NOX4; blue: DAPI) expression from the GCL to INL layers (scale bar: 75 µm). The white circle indicated positive staining. n=5/group. bP<0.01, cP<0.001. MDA: Malondialdehyde; 4-HNE: 4-Hydroxynonenal; NOX4: Nicotinamide adenine dinucleotide phosphate oxidase 4; HFD: High-fat diet; PPARα: Peroxisome proliferator activated receptor-alpha; SD: Standard diet; DAPI: 4,6-Diamino-2-phenyl indole; GCL: Ganglion cell layer; INL: Inner nuclear layer; IPL: Inner plexiform layer; ONL: Outer nuclear layer.
Figure 4
Figure 4. PPARα deficiency accelerated HFD-induced apoptosis in the retina
For a duration of 4mo, C57BL/6J and PPARα−/− mice were exposed to either a SD or HFD. A–C: Representative Western blot images (A) and statistical analysis (B, C) showing the expression levels of apoptosis regulator cleaved-PARP (A, B) and cleaved-Caspase3 (A, C) protein levels in retina. D: Immunofluorescence staining of cleaved-Caspase3 (in the cytoplasmic) in the retina (scale bar: 75 µm; green: cleaved-Caspase3, blue: DAPI). E: Hematoxylin-eosin staining of the retina (scale bar: 50 µm). n=5/group. bP<0.01, cP<0.001. PARP: Poly ADP-ribose polymerase; HFD: High-fat diet; PPARα: Peroxisome proliferator activated receptor-alpha; SD: Standard diet; DAPI: 4,6-Diamino-2-phenyl indole; GCL: Ganglion cell layer; INL: Inner nuclear layer; IPL: Inner plexiform layer; ONL: Outer nuclear layer.
Figure 5
Figure 5. PPARα deficiency exacerbated HFD-induced retinal dysfunction
C57BL/6J and PPARα−/− mice were subjected to either a SD or HFD for a duration of 4mo. A: Representative electroretinogram plots for the four experimental groups at a stimulus intensity of 1.0 cd·s/m2 under scotopic conditions; B: Representative PhNR waves for four groups at 20 cd·s/m² on a green background of 40 cd/m²; C, D: Statistical analysis of amplitude changes of a-wave (C) and b-wave (D) at different stimulus intensities (0.01, 0.1, 1.0 cd·s/m2) under scotopic conditions. n=7/group. bP<0.01 vs HFD 4M_C57BL/6J; cP<0.001 vs HFD 4M_C57BL/6J; dP<0.001 vs SD 4M_C57BL/6J. Bar graphs represent mean values±SEM. E: Statistical analysis of amplitude changes of PhNR waves. n=10-12/group. E: aP<0.05, bP<0.01. HFD: High-fat diet; PPARα: Peroxisome proliferator activated receptor-alpha; SD: Standard diet; SEM: Standard error of the mean; PhNR: Photopic negative response.

Similar articles

References

    1. Zhu HZ, Zhang WZ, Zhao YY, et al. GSK3β-mediated tau hyperphosphorylation triggers diabetic retinal neurodegeneration by disrupting synaptic and mitochondrial functions. Mol Neurodegener. 2018;13(1):62. - PMC - PubMed
    1. Vidal E, Lalarme E, Maire MA, et al. Early impairments in the retina of rats fed with high fructose/high fat diet are associated with glucose metabolism deregulation but not dyslipidaemia. Sci Rep. 2019;9(1):5997. - PMC - PubMed
    1. Asare-Bediako B, Noothi SK, Li Calzi S, et al. Characterizing the retinal phenotype in the high-fat diet and western diet mouse models of prediabetes. Cells. 2020;9(2):E464. - PMC - PubMed
    1. Wang M, Lv JY, Huang XS, et al. High-fat diet-induced atherosclerosis promotes neurodegeneration in the triple transgenic (3 × Tg) mouse model of Alzheimer's disease associated with chronic platelet activation. Alzheimers Res Ther. 2021;13(1):144. - PMC - PubMed
    1. Crispino M, Trinchese G, Penna E, et al. Interplay between peripheral and central inflammation in obesity-promoted disorders: the impact on synaptic mitochondrial functions. Int J Mol Sci. 2020;21(17):E5964. - PMC - PubMed

LinkOut - more resources