. 2025 Jun 4:16:1597731.
doi: 10.3389/fimmu.2025.1597731. eCollection 2025.

T cell-mediated immune surveillance conferred by latent Epstein-Barr virus genes suppresses a broad spectrum of tumor formation through NKG2D-NKG2DL interactions

Affiliations

T cell-mediated immune surveillance conferred by latent Epstein-Barr virus genes suppresses a broad spectrum of tumor formation through NKG2D-NKG2DL interactions

Yuqi Jin et al. Front Immunol. .

Abstract

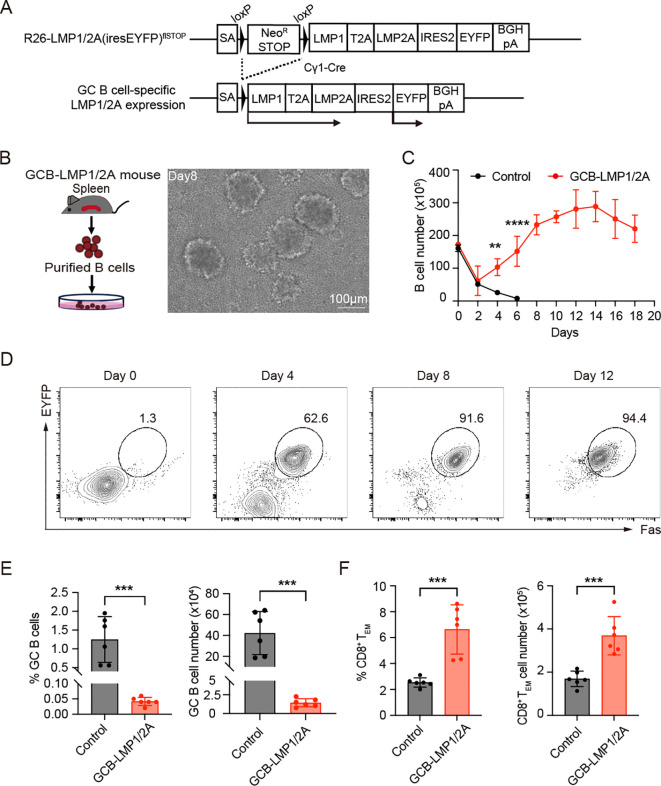
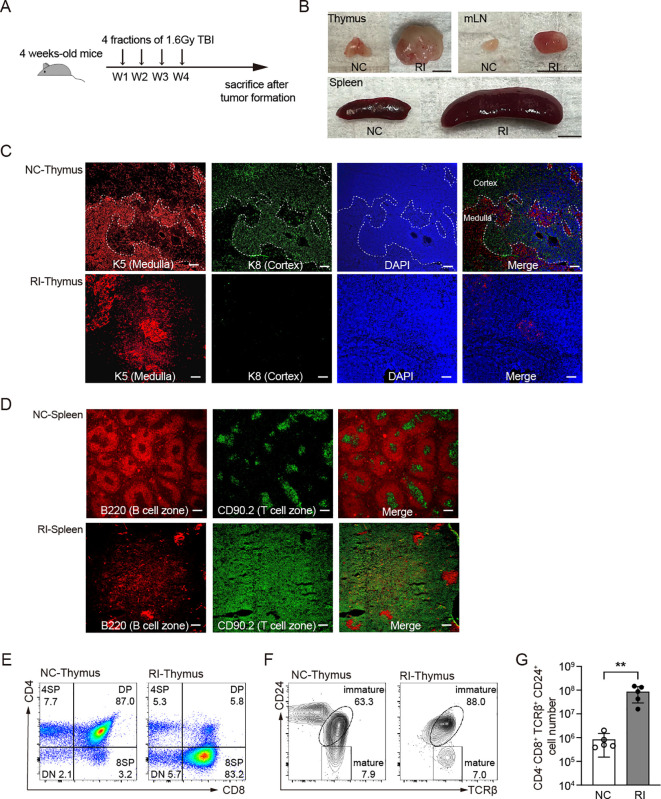
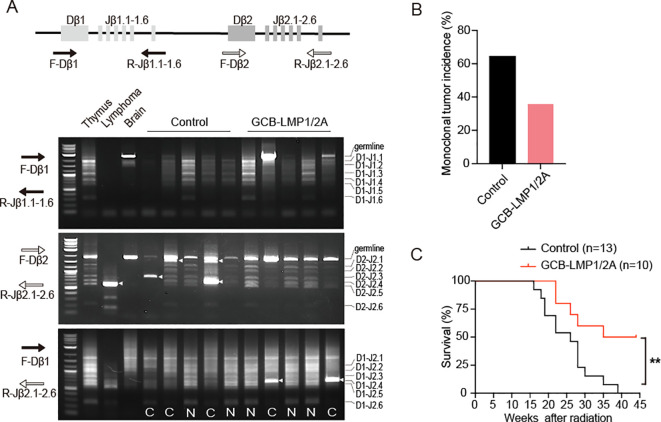
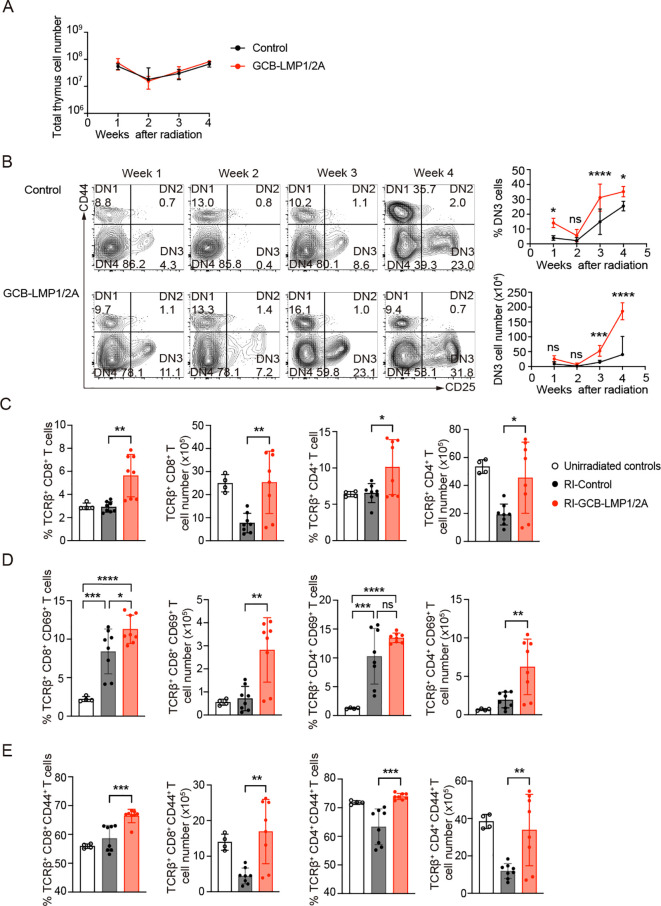
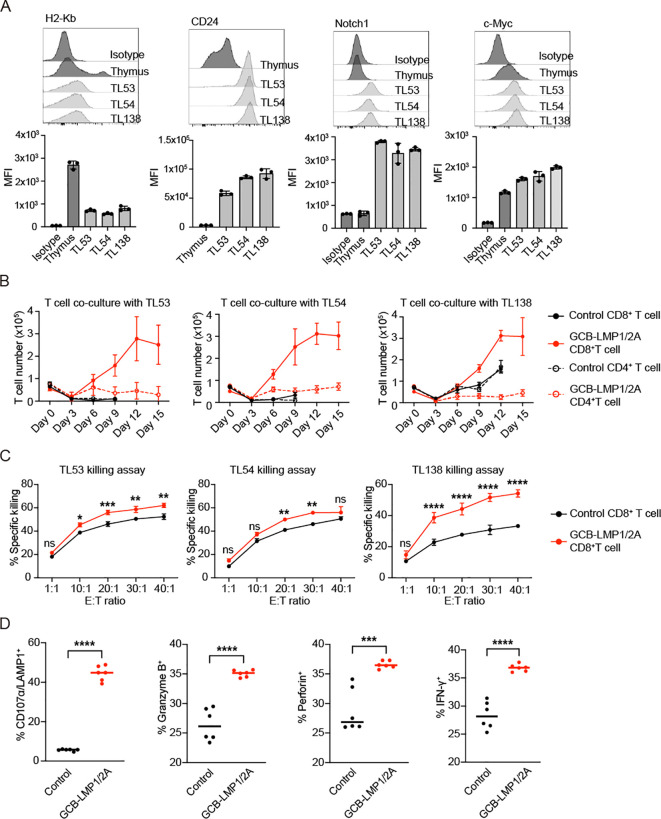
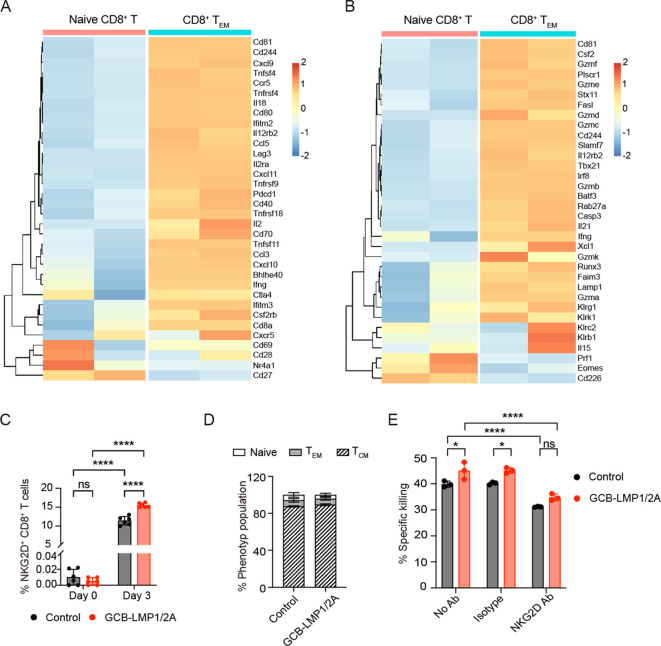
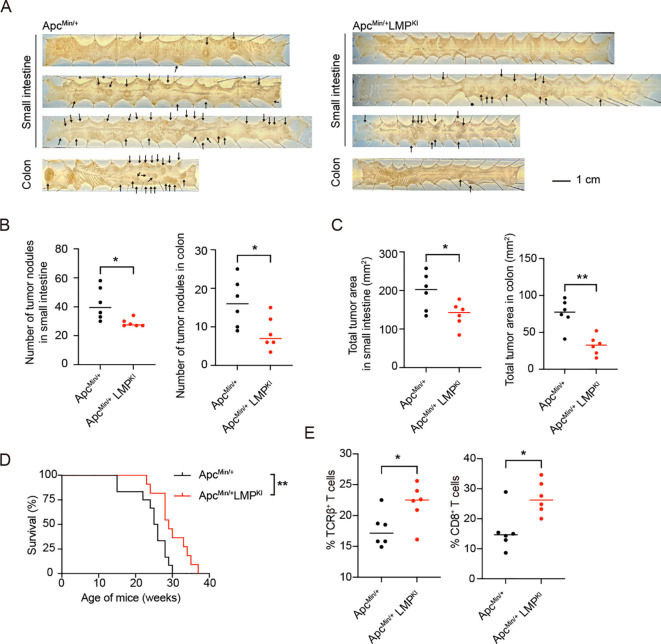
Epstein-Barr virus (EBV)-infected B cells effectively induce T cell-mediated immune surveillance that suppresses the proliferation of EBV+ B cells and development of lymphomas. However, it remains unclear whether EBV-specific T cells are involved in the surveillance of EBV-negative general tumors. To address this issue, we induced immune surveillance by expressing key EBV antigens, LMP1 and LMP2A, in germinal center B cells and investigated the formation of non-B cell tumors. LMP1/2A mice showed a significantly reduced incidence of radiation-induced T-cell acute lymphoblastic leukemia/lymphoma (T-ALL) even in the absence of LMP antigens in tumor cells and an extended life-span compared to control mice. LMP1/2A mice showed significantly higher numbers of activated memory T cells in both CD4+ and CD8+ αβT cell fractions compared to controls, suggesting their role in the elimination of tumor cells. Despite nearly absent MHC class I expression, tumor cells were effectively killed by CD8+ T cells activated upon LMP1/2A-expressing B cells. Transcriptome analysis identified upregulation of the NKG2D-NKG2DL pathway, emphasizing the capacity of LMP1/2A-induced T cells in the recognition of common tumor specific antigens. Moreover, not only T-cell tumors, but also intestinal tumors caused by ApcMin mutation were significantly suppressed by the LMP1/2A-induced immune surveillance. These results suggest that LMP1/2A-expression associated with EBV infection contributes to pan-tumor surveillance, implicating a beneficial aspect of EBV infection in humans and providing important insights into cancer prevention.

Keywords: ApcMin; Epstein-Barr virus; LMP1; LMP2A; NKG2D; T-ALL; immune surveillance; radiation-induced tumor.


Conflict of interest statement

The authors declare that the research was conducted in the absence of any commercial or financial relationships that could be construed as a potential conflict of interest.

Figures

Figure 1
Figure 1
Characterization of germinal center B cell-specific LMP1/2A-expressing mice. (A) Targeting strategy for conditional expression of LMP1 and LMP2A in germinal center (GC) B cells. LMP1, LMP2A, and EYFP reporter genes were targeted into the Rosa26 locus with the neomycin resistance stop cassette enabling constitutive expression of those genes after Cre-mediated excision of stop cassette (R26-LMP1/2A(iresEYFP)flSTOP mouse) and crossed with GC B cell-specific Cre strain, Cγ1-Cre mice. SA, splice acceptor. (B) Workflow for isolating and culturing LMP1/2A+ B cells from GCB-LMP1/2A mice (left). Morphological changes of B cells during culture, showing increased cell size and aggregation into large clumps (right). Scale bar, 100 μm. (C) Growth curves of in vitro cultured B cells from control and GCB-LMP1/2A mice (n=3). Statistical significance tested using two-way ANOVA with Bonferroni’s multiple comparisons test; **p < 0.01; ****p < 0.0001. (D) FACS analysis of in vitro cultured B cells. Proliferating cells expressed Fas, confirming their GC B cell identity. EYFP was used as a reporter for LMP1/2A expression. (E, F) Percentage and cell count of GC B cells (E) and CD8+ TEM cells (F) in the spleens of GCB-LMP1/2A mice compared to control mice (n=6). Statistical significance tested using an unpaired two-tailed Student’s t-test; ***p < 0.001.
Figure 2
Figure 2
Histological and flow cytometric analysis of mice subjected to total body irradiation. (A) Mice received 1.6 Gy of total body irradiation (TBI) weekly at indicated time points (vertical arrows) for a total four doses of 6.4 Gy. W, week. (B) Representative pictures of thymus and spleen from non-irradiated control mice (NC) and mice after 30 weeks of radiation (RI). mLN, mesenteric lymph nodes. Scale bar=0.5 cm. (C, D) Immunostaining of thymus (C) and spleen (D) from the indicated mice. (C) Thymus were stained with K5 and K8 antibodies to identify thymic epithelial cells. Thymic medulla, K5+; Thymic cortex, K8+. (D) Splenic B cell zone and T cell zone were stained with B220 and CD90.2, respectively. Scale bar=200 μm. (E-F) Representative FACS results of thymus from NC and RI mice with T-ALL. (E) CD4 and CD8 markers distinguish stages of T cell development. (F) CD24 and TCRβ markers distinguish mature and immature stage from 8SP cells. (G) Cell number of T-ALL (CD4-CD8+TCRβ+CD24+) in thymus from NC and RI mice. Each dot indicates one mouse (n=5). Statistical significance tested using an unpaired two-tailed Student’s t-test; **p < 0.01. All RI samples were collected from mice at the end stage of disease progression, between 15 and 30 weeks after radiation, based on humane endpoint criteria detailed in the Materials and methods section.
Figure 3
Figure 3
T-ALL incidence and survival curve of total body irradiated mice. (A) Illustration of the TCRβ locus and positions of the PCR primers used for detection of TCRβ rearrangements. The lower panels display gel electrophoresis of PCR products from three primer sets: F-Dβ 1/R-Jβ 1.6 (top), F-Dβ 2/Jβ 2.6 (middle), and F-Dβ 1/R-Jβ 2.6 (bottom). Clonal bands are indicated by arrowheads. N, Normal TCRβ rearrangements; C, Associated with clonal expansion. (B) Monoclonal tumor incidence of T-ALL, n=14 in each group. (C) Kaplan–Meier survival curves for mice after radiation (log-rank test, **p < 0.01). Number of mice are indicated.
Figure 4
Figure 4
Changes in thymic cell populations following radiation exposure. (A) Total thymic cell counts after the last radiation exposure. Number of mice at week 1 (n=4), week 2 (n=5), week 3 (n=5), and week 4 (n=3). (B) Representative FACS plots of CD4 and CD8 double-negative cells in the thymus at indicate week after the last radiation (left). The percentage in DN fraction (upper right) and absolute number (lower right) of DN3 cells (CD44-CD25+) in thymus at indicated time points. Statistical analysis was performed using two-way ANOVA with Bonferroni’s multiple comparisons test; *p < 0.05; ***p < 0.001; ****p < 0.0001; ns, not significant. (C-E) Percentages and absolute numbers of each T cells in thymus at 3 weeks after the last radiation. (C) The percentage and absolute numbers of TCRβ+CD8+ and TCRβ+CD4+ T cells in thymus. (D) The Percentage and absolute numbers of CD69+ in TCRβ+CD8+ or TCRβ+CD4+ T cell fractions. (E) The Percentage and absolute numbers of CD44+ in TCRβ+CD8+ or TCRβ+CD4+ T cell fractions. Number of mice in unirradiated controls (n=4), RI-Control (n=8), and RI-GCB-LMP1/2A (n=8). Statistical analysis was performed using One-way ANOVA with Bonferroni’s multiple comparisons test; *p < 0.05; **p < 0.01; ***p < 0.001; ****p < 0.0001.
Figure 5
Figure 5
CD8+ T cells exhibit proliferation and cytotoxic activity after co-culture with tumor cells. (A) Flow cytometry of tumor cell lines (TL53, TL54, and TL138) assessed for H2-Kb, CD24, Notch1, and c-Myc expression. Histograms display fluorescence intensity profiles relative to normal thymus and isotype controls. Bar charts below each histogram represent mean fluorescence intensity (MFI) values. All tumor lines exhibit H2-Kb-/low, CD24+, Notch1+, and c-Myc+ phenotypes. (B) Co-culture of control and GCB-LMP1/2A T cells with tumor cell lines TL53, TL54, and TL138 over 15 days. CD8+ and CD4+ T cell number were counted every 3 days, with each point representing the mean ± SD from three replicates. (C) Killing assay of activated CD8+ T cells from control and GCB-LMP1/2A mice against tumor lines TL53, TL54, and TL138. CD8+ T cells were pre-activated in vitro by co-culture with BLMP1/2A for 3 days. Killing efficiency was measured across different effector-to-target (E:T) ratios. Data represent the mean ± SD from three replicates. Statistical analysis was performed using two-way ANOVA with Bonferroni’s multiple comparisons test; *p < 0.05; **p < 0.01; ***p < 0.001; ****p < 0.0001; ns, not significant. (D) Percentages of CD107α/LAMP1+, Granzyme B+, Perforin+, and IFN-γ+ CD8+ T cells were measured after a 3-day co-culture of CD8+ T cells from the control and GCB-LMP1/2A (n=6 per group) with BLMP1/2A cells. Statistical significance tested using an unpaired two-tailed Student’s t-test; ****p < 0.0001.
Figure 6
Figure 6
Differentially expressing genes in CD8+ T cells activated by LMP1/2A-expressing B cells. (A, B) CD8+ TEM cells were purified on day 25 of in vitro culture with LMP1/2A-expressing tumor cells and analyzed for mRNA expression by microarray. Data were normalized by RMA normalization and log2 transformed. Heatmaps show the expression of activation-related genes (A) and cytotoxicity-related genes (B) in CD8+ TEM cells compared to naive CD8+ T cells. (C) NKG2D expression levels on CD8+ T cells from GCB-LMP1/2A and control mice before and after co-culture with BLMP1/2A cells on day 3. (D) Population of various phenotypes within the NKG2D+ CD8+ T cells. (E) Killing assay of TL53 cells with no antibody (No Ab), IgG1 isotype antibody (Isotype) and NKG2D antibody (NKG2D Ab). Data represent the mean ± SD from three replicates. Statistical analysis was performed using two-way ANOVA with Bonferroni’s multiple comparisons test; *p < 0.05; ****p < 0.0001; ns, not significant.
Figure 7
Figure 7
Analysis of LMP1/2A-induced immune surveillance in the ApcMin-induced intestinal tumor formation. (A) Representative macroscopic images of small intestines and colons from ApcMin/+ and ApcMin/+LMPKI mice at 22-week-old with arrows indicating tumor nodules. Scale bar=1 cm. (B, C) Quantification of tumor nodules number in small intestine and colon (B). Quantification of total tumor area in small intestine and colon (C). Each dot represents an individual mouse (n=6 per group). Statistical analysis was performed using an unpaired two-tailed Student’s t test; *p < 0.05; **p < 0.01. (D) Kaplan-Meier survival curves for ApcMin/+ and ApcMin/+LMPKI mice (n=12 per group; log-rank test, **p < 0.01). (E) Flow cytometry analysis of tumor-infiltrating lymphocytes (TILs), showing percentages of TCRβ+ T cells in CD45+ lymphocytes fractions and CD8+ in TCRβ+ T cell fractions in ApcMin/+ and ApcMin/+LMPKI mice (n=6 per group). Statistical analysis was performed using an unpaired two-tailed Student’s t test; *p < 0.05.

Similar articles

References

    1. Lieberman PM. Keeping it quiet: chromatin control of gammaherpesvirus latency. Nat Rev Microbiol. (2013) 11:863–75. doi: 10.1038/nrmicro3135 - DOI - PMC - PubMed
    1. Barton ES, White DW, Cathelyn JS, Brett-McClellan KA, Engle M, Diamond MS, et al. Herpesvirus latency confers symbiotic protection from bacterial infection. Nature. (2007) 447:326–9. doi: 10.1038/nature05762 - DOI - PubMed
    1. Machiels B, Dourcy M, Xiao X, Javaux J, Mesnil C, Sabatel C, et al. A gammaherpesvirus provides protection against allergic asthma by inducing the replacement of resident alveolar macrophages with regulatory monocytes. Nat Immunol. (2017) 18:1310–20. doi: 10.1038/ni.3857 - DOI - PubMed
    1. Dourcy M, Maquet C, Dams L, Gilliaux G, Javaux J, Desmecht D, et al. A gammaherpesvirus licenses cd8 T cells to protect the host from pneumovirus-induced immunopathologies. Mucosal Immunol. (2020) 13:799–813. doi: 10.1038/s41385-020-0293-7 - DOI - PMC - PubMed
    1. Young LS, Yap LF, Murray PG. Epstein–barr virus: more than 50 years old and still providing surprises. Nat Rev Cancer. (2016) 16:789–802. doi: 10.1038/nrc.2016.92 - DOI - PubMed

MeSH terms

Substances

LinkOut - more resources