. 2025 Jun 4:16:1576193.
doi: 10.3389/fimmu.2025.1576193. eCollection 2025.

Role of CD28+ PD-1+ Tc cells in immune response and prognosis prediction in hepatocellular carcinoma

Affiliations

Role of CD28+ PD-1+ Tc cells in immune response and prognosis prediction in hepatocellular carcinoma

Wuhan Yang et al. Front Immunol. .

Abstract

Background: CD28+PD-1+ Tc cells (CD8+ T cells) constitute a dysfunctional subset of T cell; however, the mechanisms underlying their dysfunction and their significance in hepatocellular carcinoma (HCC) remain unclear. We aimed to elucidate the prognostic significance and molecular characteristics of CD28+PD-1+ Tc cell infiltration in HCC.

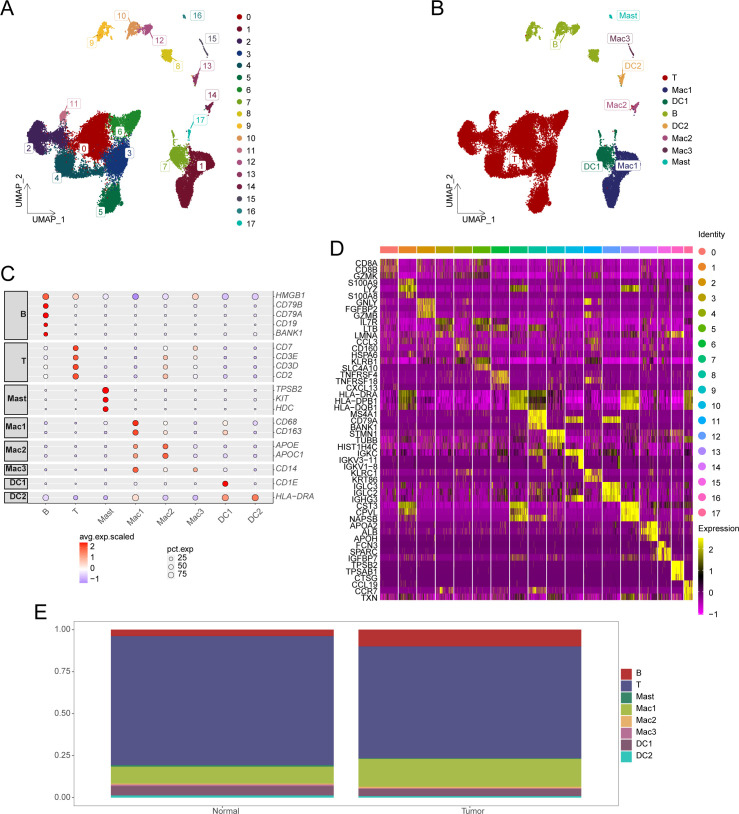
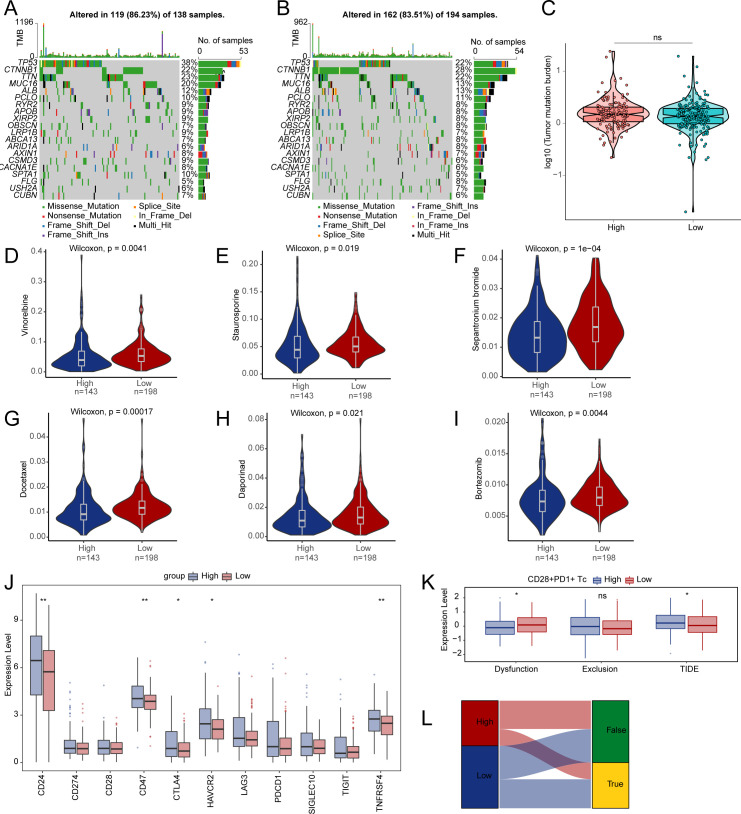
Methods: We established a single-cell HCC transcriptional map, focusing on cell-cell communication and trajectory analysis of CD28+PD-1+ Tc cells. We assessed the correlation between CD28+PD-1+ Tc-cell enrichment and prognosis and investigated potential molecular mechanisms using enrichment analyses. Flow cytometry was used to compare CD28+PD-1+ Tc-cell infiltration between HCC and adjacent normal tissues and cytotoxic factors and immune checkpoint expression were evaluated.

Results: Overall, 25,644 T cells were identified from single-cell RNA sequencing data from 10 HCC samples and corresponding normal samples. Overall T-cell infiltration was lower in HCC tissues, with significantly higher CD28+PD-1+ Tc-cell infiltration. Bulk RNA sequencing data integration revealed a correlation between higher CD28+PD-1+ Tc-cell infiltration and significantly worse prognosis. Flow cytometry confirmed higher CD28+PD-1+ Tc-cell enrichment in HCC tissues. Additionally, cytotoxic factor expression was significantly lower in CD28+PD-1+ Tc cells than in CD28-PD-1+ Tc cells, with lower expression of TIGIT and TIM-3 immune checkpoint molecules.

Conclusions: Significantly high CD28+PD-1+ Tc-cell enrichment in HCC indicates potential immune dysfunction. CD28+PD-1+ Tc-cell enrichment may serve as a sensitive prognostic marker and indicator for predicting treatment responses.

Keywords: CD28; PD-1; hepatocellular carcinoma; single-cell RNA-seq; t cell exhaustion; tumor microenvironment.


Conflict of interest statement

The authors declare that the research was conducted in the absence of any commercial or financial relationships that could be construed as a potential conflict of interest.

Figures

Figure 1
Figure 1
Identification of cell subsets from single-cell sequencing data. (A) UMAP plot displaying the distribution of HCC cell subsets. (B) UMAP plot showing annotation results for HCC cell subsets. (C) Expression of marker genes in each cell type. (D) Heatmap illustrating cell group-specific expressed genes. (E) Cumulative histogram showing the distribution of cell types in HCC and normal tissues. HCC, hepatocellular carcinoma; UMAP, Uniform Manifold Approximation and Projection.
Figure 2
Figure 2
Characterization of gene expression profiles within T-cell subsets. (A) UMAP plot illustrating the distribution of T-cell subsets. (B) UMAP plot displaying annotation results for T-cell subsets. (C) Expression levels of marker genes across various cell types. (D) Cumulative histogram showing the distribution of T-cell subpopulations in HCC and normal tissues. (E) Visualization of GSVA analysis results through heatmap. HCC, hepatocellular carcinoma; UMAP, Uniform Manifold Approximation and Projection; GSVA, gene set variation analysis.
Figure 3
Figure 3
Survival analysis and ROC curve of high and low enrichment groups of CD28+PD-1+ Tc cells in patients with HCC. (A) Survival analysis of high and low enrichment groups of CD28+PD-1+ Tc cells in patients with HCC. (B) ROC curve validating the CD28+PD-1+ Tc-cell enrichment level. HCC, hepatocellular carcinoma; ROC, Receiver Operating Characteristic.
Figure 4
Figure 4
Enrichment score of CD28+PD-1+ Tc cells as an independent prognostic factor. (A) Forest plot illustrating the outcomes of univariate Cox regression analysis on clinical characteristics. (B) Forest plot depicting the results of multivariate Cox regression analysis on clinical characteristics. (C) Nomogram for predicting 1-, 3-, and 5-year survival rates. (D) Calibration curves for the nomogram at 1, 3, and 5 years.
Figure 5
Figure 5
Differences in TMB, drug sensitivity, and TIDE between high- and low-enrichment groups. (A, B) The top 20 genes with the highest mutation frequencies in both groups. (C) Comparison of TMB between two enrichment groups. Differences in drug sensitivity for vinorelbine (D), staurosporine (E), sepantronium bromide (F), docetaxel (G), daporinad (H), bortezomib (I) between two groups. (J) Boxplot depicting the expression of immune checkpoints between two groups. (K) Differences in immune therapy responses assessed by the TIDE prediction between two groups. (L) Sankey diagram evaluating immune therapy responses between high- and low-enrichment groups using the TIDE prediction. TMB, tumor mutation burden; TIDE, tumor immune dysfunction and exclusion. ns, p ≥ 0.05; *, p < 0.05; **, p < 0.01.
Figure 6
Figure 6
Infiltration of CD28+PD-1+ Tc cells in HCC and adjacent tissues. (A) Representative scatter plot showing the percentage of CD28+PD-1+ Tc cells vs CD28-PD-1+ Tc cells in adjacent tissues. (B) Representative scatter plot showing the percentage of CD28+PD-1+ Tc cells vs CD28-PD-1+ Tc cells in HCC tissues. (C) The percentage of CD28+PD-1+ Tc cells in HCC tissues was significantly higher than that in adjacent tissues (p< 0.001). HCC, hepatocellular carcinoma. ***, p < 0.001.
Figure 7
Figure 7
Assessment of the cytotoxic function of CD28+PD-1+ Tc cells in HCC tissues. (A) Representative distribution plot of TNF-α, IFN-γ, granzyme B, and perforin expression in CD28+PD-1+ Tc cells compared with CD28-PD-1+ Tc cells; (B) In HCC tissues, the expression levels of TNF-α (P<0.001), IFN-γ (P<0.05), granzyme B (P<0.05), and perforin (P<0.05) were significantly lower in CD28+PD-1+ Tc cells than in CD28-PD1+ Tc cells. HCC: hepatocellular carcinoma. *, p < 0.05; ***, p < 0.001.
Figure 8
Figure 8
Detection of immune checkpoint molecule expression in CD28+PD-1+ Tc cells in HCC tissues. (A) Representative samples showing expression levels of CTLA4, TIGIT, and TIM3 in CD28+PD-1+ Tc cells compared with CD28-PD-1+ Tc cells; (B) In HCC tissues, the expression levels of TIGIT (p < 0.05) and TIM3 (p < 0.05) in CD28+PD-1+ Tc cells were significantly lower than those in CD28-PD1+ Tc cells, whereas CTLA4 expression did not show significant changes. HCC, hepatocellular carcinoma. ns, p ≥ 0.05; *, p < 0.05.

Similar articles

References

    1. Siegel RL, Miller KD, Wagle NS, Jemal A. Cancer statistics, 2023. CA Cancer J Clin. (2023) 73:17–48. doi: 10.3322/caac.21763 - DOI - PubMed
    1. Li Q, Xia C, Li H, Yan X, Yang F, Cao M, et al. Disparities in 36 cancers across 185 countries: secondary analysis of global cancer statistics. Front Med. (2024) 18:911–20. doi: 10.1007/s11684-024-1058-6 - DOI - PubMed
    1. Dagogo-Jack I, Shaw AT. Tumour heterogeneity and resistance to cancer therapies. Nat Rev Clin Oncol. (2018) 15:81–94. doi: 10.1038/nrclinonc.2017.166 - DOI - PubMed
    1. Desa DE, Strawderman RL, Wu W, Hill RL, Smid M, Martens J, et al. Intratumoral heterogeneity of second-harmonic generation scattering from tumor collagen and its effects on metastatic risk prediction. BMC Cancer. (2020) 20:1217. doi: 10.1186/s12885-020-07713-4 - DOI - PMC - PubMed
    1. El-Kenawi A, Hanggi K, Ruffell B. The immune microenvironment and cancer metastasis. Cold Spring Harb Perspect Med. (2020) 10:a037424. doi: 10.1101/cshperspect.a037424 - DOI - PMC - PubMed

MeSH terms