. 2025 Jun 4:16:1612987.
doi: 10.3389/fimmu.2025.1612987. eCollection 2025.

Integrated transcriptomics and machine learning reveal REN as a dual regulator of tumor stemness and NK cell evasion in Wilms tumor progression

Affiliations

Integrated transcriptomics and machine learning reveal REN as a dual regulator of tumor stemness and NK cell evasion in Wilms tumor progression

Qingfei Cao et al. Front Immunol. .

Abstract

Introduction: Wilms tumor (WT) is the most common pediatric kidney cancer, which presents significant therapeutic challenges, particularly in high-risk cases, due to chemotherapy resistance and immunosuppressive tumor microenvironments (TMEs). Tumor stemness and immune evasion mechanisms are implicated in poor clinical outcomes, yet the molecular drivers underpinning these processes remain inadequately understood.

Methods: We employed an integrative approach combining single-cell RNA sequencing (scRNA-seq), spatial transcriptomics, bulk RNA-seq, and advanced machine learning techniques to uncover molecular regulators of tumor behavior in WT. A novel Cancer Stemness Prognostic Index (CSPI) was developed using machine learning algorithms to stratify WT patients by risk and histological subtype. Additionally, molecular docking simulations and in vitro functional assays were performed to validate the role of key regulators in tumor stemness and immune evasion, as well as to explore potential therapeutic strategies targeting these molecular drivers.

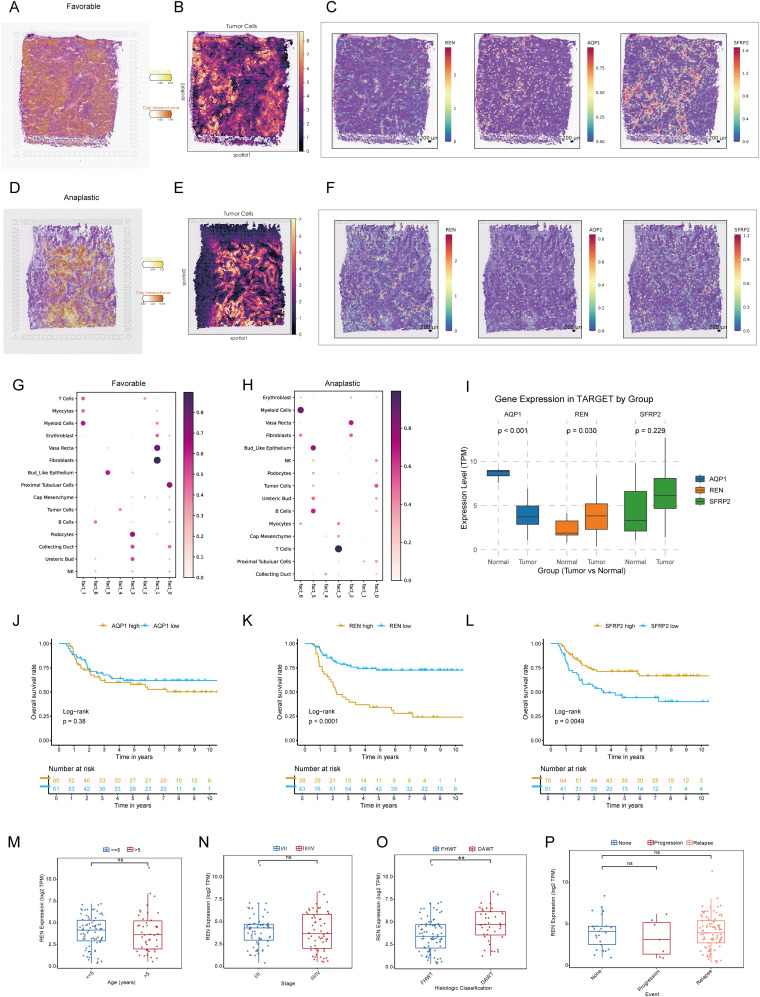
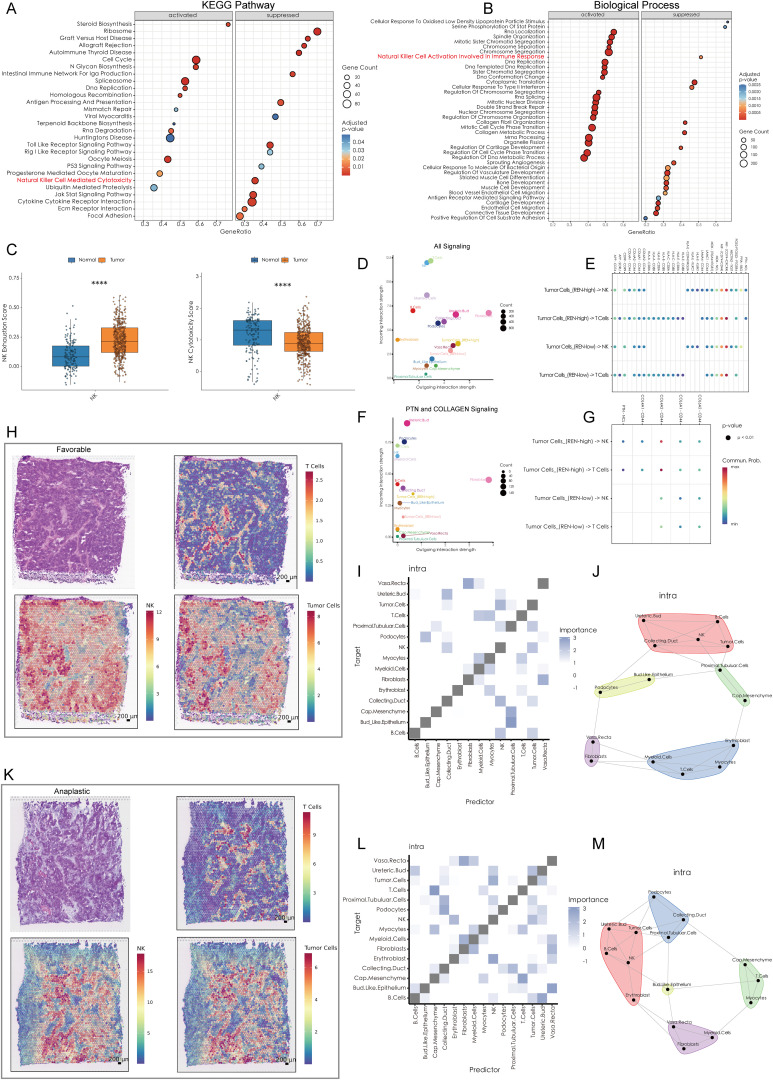
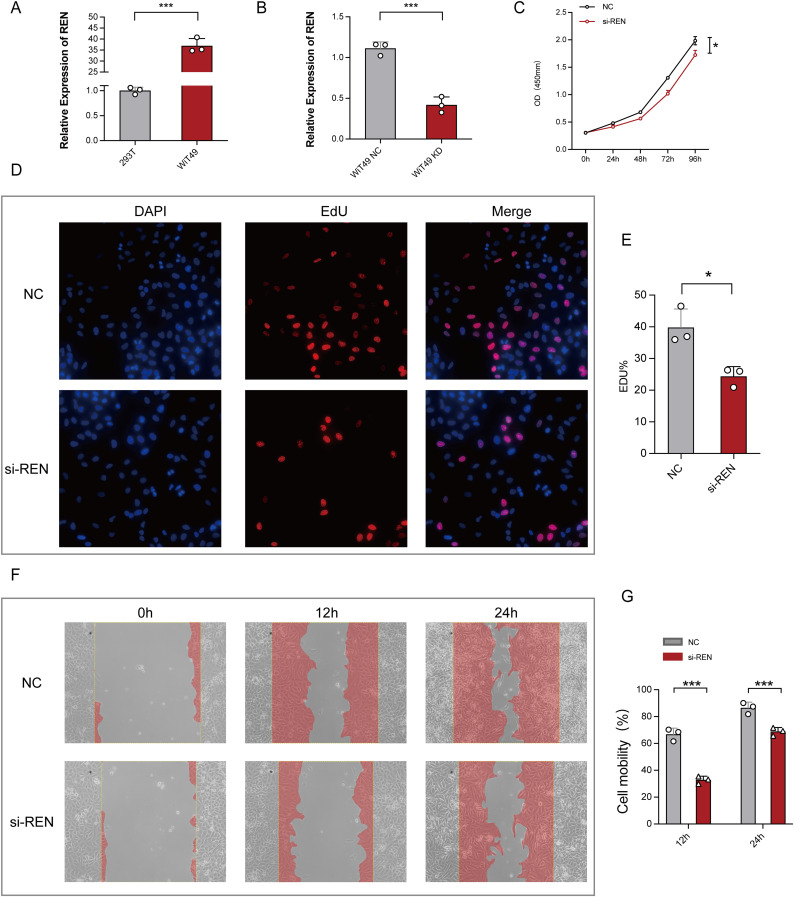
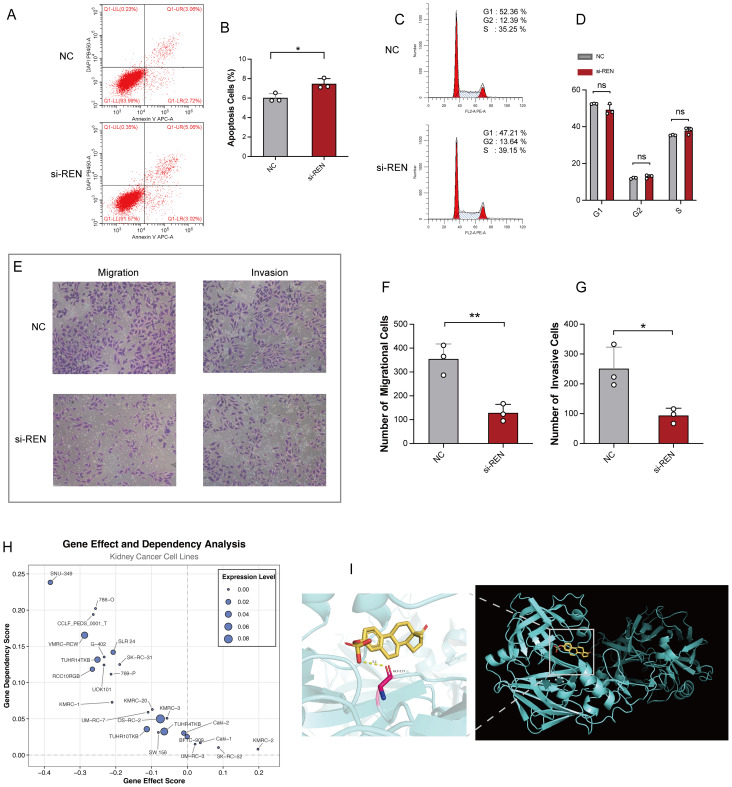
Results: Renin gene (REN) emerged as a central regulator of tumor stemness and immune evasion in WT. High-CSPI tumors exhibited enhanced tumor stemness phenotypes, metabolic reprogramming (ROS/oxidative phosphorylation), and suppressed immune activity. Spatial transcriptomics revealed distinct histological subtype-specific localization of stemness-related gene expression and physical proximity between REN-expressing tumor cells and natural killer (NK) cells. At spatial and single-cell resolution, REN-expressing tumor cells promoted NK cell exhaustion via PTN-NCL and COL4A1-CD44 ligand-receptor interactions, while showing limited impact on T cell dysfunction. Molecular docking identified estrogen-based compounds as potential REN inhibitors. Functional assays validated REN knockdown as significantly impairing tumor proliferation, migration, and survival in vitro.

Discussion: This study establishes REN as a pivotal driver of tumor stemness and immune evasion in WT, playing a dual role in promoting tumor aggressiveness and suppressing NK-mediated immune surveillance. Targeting REN offers promising therapeutic opportunities for high-risk WT cases by simultaneously inhibiting tumor progression and restoring immune function. These findings emphasize REN's potential as a transformative target for precision oncology and underscore the value of integrative transcriptomics in advancing personalized cancer treatment strategies.

Keywords: Wilms tumor; cancer stemness prognostic index; natural killer cell evasion; renin gene; tumor microenvironment; tumor stemness.


Conflict of interest statement

The authors declare that the research was conducted in the absence of any commercial or financial relationships that could be construed as a potential conflict of interest.

Figures

Figure 1
Figure 1
Elevated tumor stemness promotes Wilms tumor progression and shapes the tumor microenvironment. (A–D) Comparison of mRNAsi across clinical and pathological parameters, including age (A), tumor stage (B), histologic classification (C), and tumor event status (D), within the TARGET-WT cohort. (E) Kaplan-Meier survival analysis demonstrating the association between mRNAsi levels and overall survival. (F) Spearman correlation analysis between mRNAsi and tumor microenvironment components, including tumor purity, suppressor cell populations, and immune cell infiltration. (G) Tumor-specific signature scores highlighting molecular processes enriched in high mRNAsi groups, including exosome assembly, ferroptosis, and m6A methylation. (H) Evaluation of tumor microenvironment scores stratified by mRNAsi, showing alterations in oncogenic pathways such as excision repair, CD8+ effector cell abundance, and cell cycle regulation. Statistical significance was assessed using appropriate tests, where *p < 0.05, **p < 0.01, ***p < 0.001, ****p < 0.0001, and ns denotes not significant.
Figure 2
Figure 2
Development and validation of the cancer stemness prognostic index using integrated machine learning. (A) Frequency distribution of candidate genes identified through bootstrap-driven Lasso regression across 1,000 iterations. (B) Performance metrics (C-index) of CSPI derived from 101 integrated machine learning models, highlighting the superior predictive capability of the elastic net (Enet) method [α = 0.2]. (C–E) Calibration curves showing alignment between predicted probabilities and observed outcomes for 1-, 3-, and 5-year survival predictions, respectively. (F, H, J) Receiver operating characteristic (ROC) curves evaluating CSPI’s predictive performance in the training cohort (F), test cohort (H), and overall cohort (J). (G, I, K) Kaplan-Meier survival curves demonstrating significantly worse clinical outcomes in patients with high CSPI scores across all cohorts. (L, M) Distribution and survival status of patients based on CSPI in the TARGET-WT cohort, stratifying individuals into high- and low-CSPI groups based on median CSPI values. (N) Heatmap of expression levels for 16 key genes constituting the CSPI across high and low CSPI groups. (O) Correlation analysis between CSPI scores and immune cell profiles.
Figure 3
Figure 3
Functional characterization of CSPI and identification of core tumor stemness genes. (A) Correlation analysis demonstrating the positive association between CSPI scores and tumor stemness (mRNAsi), indicating elevated stemness in patients with high CSPI. (B) Gene Set Variation Analysis highlighting activation of key pathways in high-CSPI patients (C) KEGG pathway enrichment analysis of DEGs between high- and low-CSPI groups. (D) Univariate and multivariate Cox regression analyses identifying CSPI as an independent prognostic factor, emphasizing its robustness and predictive capability beyond clinical features. (E) Heatmap displaying the top 10 upregulated and downregulated DEGs between Wilms tumor tissues and adjacent normal tissues, derived from multi-cohort analysis using the RRA algorithm. (F) Venn diagram illustrating the intersection between RRA-selected DEGs and CSPI-associated genes, highlighting three core tumor stemness genes (REN, SFRP2, and AQP1).
Figure 4
Figure 4
Single-cell landscape of the tumor microenvironment in Wilms tumor. (A) Evaluation of nine batch correction algorithms for scRNA-seq data processing, highlighting “scANVI” as the top-performing method for resolving batch effects while retaining biological variance. (B) Hierarchical cell annotation workflow illustrated via a Sankey plot, which depicts three levels of classification detailing cellular identities within the Wilms tumor microenvironment. (C) UMAP visualization of tissue group distribution and level 2 cell annotations, showcasing cellular heterogeneity across normal and tumor tissues. (D) Heatmap of cell type-specific marker gene expression, confirming accurate cell type identification and annotation. (E) Bar plot showing inter-sample variability in the proportion of identified cell populations, reflecting differences in cellular composition across individual samples. (F) Tissue preference analysis demonstrating significant enrichment of specific cell types within tumor tissues compared to normal tissues (G) Copy number variation analysis based on hierarchical clustering and CNV profiles, identifying clusters with malignant properties. (H–J) Visualization of CNV-based classification, including UMAP plots displaying CNV-derived clustering (H), cell annotations incorporating CNV features (I), and CNV scores distinguishing malignant cells (J). (K) Updated level 3 cell annotations integrated with CNV data, pinpointing malignant tumor cell populations within the Wilms tumor microenvironment. (L) Validation of bulk RNA-seq-derived core stemness genes (SFRP2, AQP1, and REN) at single-cell resolution, revealing cell type-specific expression patterns.
Figure 5
Figure 5
Spatial Transcriptomic Validation and Prognostic Analysis of Key Tumor Stemness Genes in Wilms Tumor. (A–C) Spatial deconvolution of favorable Wilms tumor tissues identifies tumor cells concentrated within specific clusters, indicative of high differentiation potential. REN demonstrates spatially restricted and tumor-specific expression, whereas SFRP2 and AQP1 show diffuse expression across the tissue. (D–F) Spatial deconvolution of anaplastic Wilms tumor tissues reveals diverse cellular co-localization, characteristic of lower differentiation and enhanced malignancy. REN maintains distinct tumor-specific localization, while SFRP2 and AQP1 display widespread expression patterns. (G–H) Cellular co-localization and interaction patterns analyzed using NMF algorithm. (I) Comparative analysis of gene expression in the TARGET-WT cohort between tumor and normal tissues, showing significant differential expression for REN and AQP1. (J–L) Kaplan-Meier survival analysis of AQP1, REN and SFRP2 in TARGET-WT cohort. (M–P) Comparison of REN expression across clinical and pathological parameters, including age (M), tumor stage (N), histologic classification (O), and tumor event status (P), within the TARGET-WT cohort. Statistical significance was assessed using appropriate tests, where **p < 0.01 and ns denotes not significant.
Figure 6
Figure 6
High REN Expression Reshapes Tumor-Immune Cell Communication and Spatial Dynamics in Wilms Tumors. (A) Gene Set Enrichment Analysis based on KEGG pathways, depicting the activated and suppressed biological pathways associated with REN expression in tumor tissues. (B) GSEA using Gene Ontology biological processes, highlighting the activated and suppressed biological processes associated with REN expression in tumor tissues. (C) Box plots illustrating NK cell functional impairment in tumor tissues, with reduced exhaustion markers and diminished cytotoxic activity compared to normal tissues. (D) Overall cell-cell communication network analysis within the TME, indicating NK and T cells as primary recipients of interaction signals from other cell types. (E) Comparison of cell-cell communication patterns in high-REN versus low-REN tumor cells. (F) PTN and COLLAGEN signaling networks reveal major producers and recipients within the TME. (G) Ligand-receptor pair analysis identifies REN-specific interactions, such as PTN-NCL and COL4A1-CD44, which are exclusively enriched in tumor cells with high REN expression and absent in low-REN-expressing cells. (H, K) Spatial maps illustrating tumor cell, NK cell, and T cell distributions across favorable and anaplastic subtypes of WT, highlighting physical proximity between tumor cells and NK cells. (I, L) Co-localization heatmaps exhibit the spatial relationship of each cell type in single spot across favorable and anaplastic subtypes of WT. (J, M) Co-localization network diagrams providing a detailed visualization of cell-to-cell co-localization preferences within the TME. Statistical significance was assessed using appropriate tests, where ****p < 0.0001, and ns denotes not significant.
Figure 7
Figure 7
Functional Validation of REN Expression in Wilms Tumor Cells. (A) Relative REN mRNA expression levels as analyzed by RT-qPCR, demonstrating significant upregulation of REN in WiT49 cells compared to 293T cells. (B) Efficiency of REN knockdown using siRNA in WiT49 cells, as confirmed by RT-qPCR, showing significantly reduced REN expression compared to the negative control (NC) group. (C) CCK-8 proliferation assay assessing cellular activity over time, showing reduced proliferation rates in REN-knockdown (si-REN) cells compared to the NC group. (D) Fluorescent images from EdU incorporation assays comparing DNA synthesis in NC and si-REN groups. Representative images show DAPI staining (nuclei), EdU incorporation (cell proliferation), and merged overlays. (E) Quantification of EdU-positive cells indicates a significant reduction in tumor cell proliferation in the si-REN group compared to the NC group. (F) Representative images of wound healing assays evaluating cell migration at 0, 12, and 24 hours in NC and si-REN groups. Red shading denotes migration area. (G) Quantitative analysis of cell mobility at 24 and 48 hours post-wound generation, showing significantly lower migration rates in si-REN cells compared to NC cells. Statistical significance was assessed using appropriate tests, where *p < 0.05, ***p < 0.001 and ns denotes not significant.
Figure 8
Figure 8
REN Knockdown Enhances Apoptosis and Impairs Tumor Migration, Invasion, and Survival. (A) Representative flow cytometry plots showing apoptosis rates in the REN-knockdown (si-REN) and negative control (NC) groups. (B) Quantification of apoptotic cells, revealing significantly higher apoptosis rates in the si-REN group compared to the NC group. (C) Flow cytometry analysis of cell cycle distribution, presenting G1, G2, and S phase percentages in both NC and si-REN groups. (D) Statistical comparison of cell cycle distribution, showing no significant differences between the NC and si-REN groups across all phases. (E) Representative images of transwell migration and invasion assays comparing NC and si-REN cells. (F) Quantitative analysis of migratory cells, showing a significant reduction in cell migration upon REN knockdown. (G) Quantification of invasive cells, indicating a significant decrease in invasive capability in the si-REN group compared to the NC group. (H) Gene dependency analysis using DepMap data for 26 renal carcinoma cell lines, illustrating that most kidney cancer cell lines exhibit high dependency on REN expression for survival. (I) Molecular docking model showing the interaction between estrogen proteins and the REN protein, with predictions indicating binding events that lead to reduced REN mRNA expression. Statistical significance was assessed using appropriate tests, where *p < 0.05, **p < 0.01 and ns denotes not significant.

Similar articles

References

    1. Maciaszek JL, Oak N, Nichols KE. Recent advances in Wilms’ tumor predisposition. Hum Mol Genet. (2020) 29:R138–49. doi: 10.1093/hmg/ddaa091 - DOI - PubMed
    1. Hol JA, Jewell R, Chowdhury T, Duncan C, Nakata K, Oue T, et al. Wilms tumour surveillance in at-risk children: Literature review and recommendations from the SIOP-Europe Host Genome Working Group and SIOP Renal Tumour Study Group. Eur J Cancer. (2021) 153:51–63. doi: 10.1016/j.ejca.2021.05.014 - DOI - PubMed
    1. Spreafico F, Fernandez CV, Brok J, Nakata K, Vujanic G, Geller JI, et al. Wilms tumour. Nat Rev Dis Primers. (2021) 7:75. doi: 10.1038/s41572-021-00308-8 - DOI - PubMed
    1. Perlman EJ, Grundy PE, Anderson JR, Jennings LJ, Green DM, Dome JS, et al. WT1 mutation and 11P15 loss of heterozygosity predict relapse in very low-risk wilms tumors treated with surgery alone: A children’s oncology group study. J Clin Oncol. (2011) 29:698–703. doi: 10.1200/JCO.2010.31.5192 - DOI - PMC - PubMed
    1. Cresswell GD, Apps JR, Chagtai T, Mifsud B, Bentley CC, Maschietto M, et al. Intra-tumor genetic heterogeneity in wilms tumor: clonal evolution and clinical implications. EBioMedicine. (2016) 9:120–9. doi: 10.1016/j.ebiom.2016.05.029 - DOI - PMC - PubMed

MeSH terms

LinkOut - more resources