. 2025 Jun 4:16:1578590.
doi: 10.3389/fimmu.2025.1578590. eCollection 2025.

Partial depletion of circulating neutrophil granulocytes in mice exacerbates the inflammatory response and hypothermia during LPS induced severe systemic inflammation

Affiliations

Partial depletion of circulating neutrophil granulocytes in mice exacerbates the inflammatory response and hypothermia during LPS induced severe systemic inflammation

Jessica Hernandez et al. Front Immunol. .

Abstract

Introduction: During acute inflammation, immune-to-brain signaling plays a pivotal role in the generation of sickness responses such as fever or hypothermia. Neutrophil granulocytes (NG) are a crucial component of the immune system and modulate inflammation. Moreover, neutropenic fever is a severe condition for immunocompromised patients that can be life threatening. Using a mouse model of partial NG depletion, we aimed to investigate how neutropenia alters immune-to-brain signaling and the development of sickness responses during high-dose-LPS-induced inflammation.

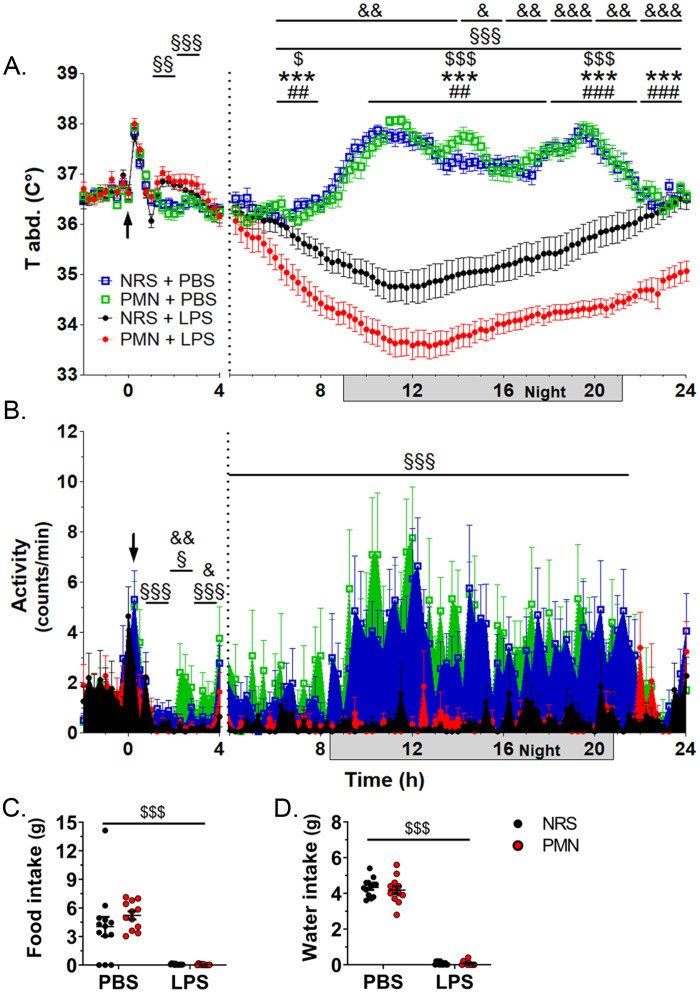
Methods: To deplete NGs, mice were injected intraperitoneally (IP) with heterologous anti-polymorphonuclear leukocyte serum at 1:4 ratio in PBS (PMN, 1.82 mg/kg IgG) or normal rabbit serum (NRS, 1 mg/kg IgG) as a control. To induce inflammation, mice were injected IP with lipopolysaccharide (LPS, 2.5 mg/kg) or PBS as a control 24 h after PMN or NRS. Physiological parameters were documented using a telemetric system that continuously recorded: food and water intake, locomotor activity, and core body temperature. At 4 h or 24 h after LPS-stimulation, brain and serum samples were collected and analyzed for peripheral and brain inflammatory markers.

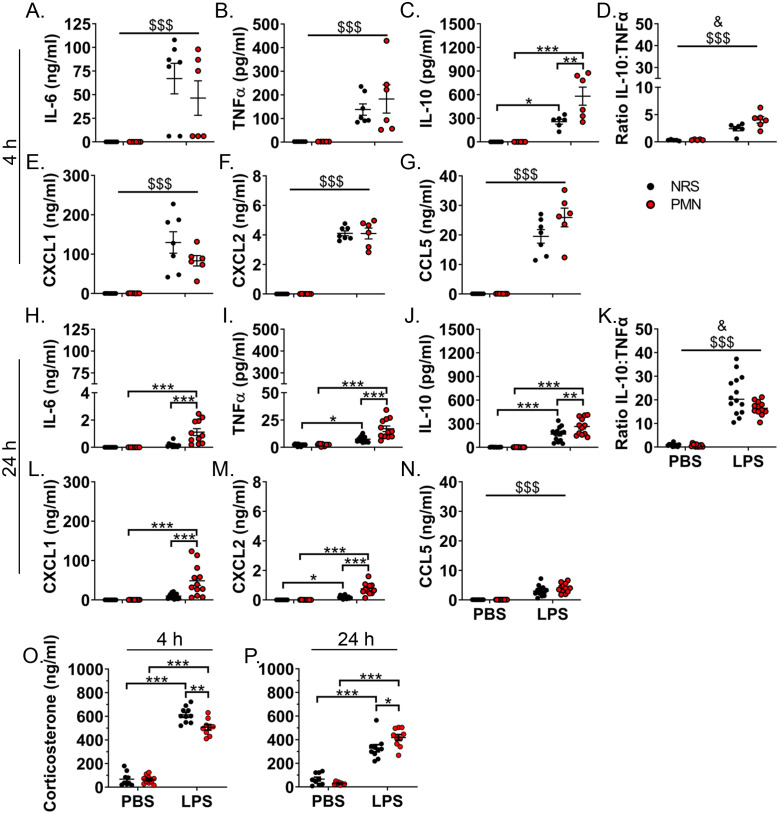
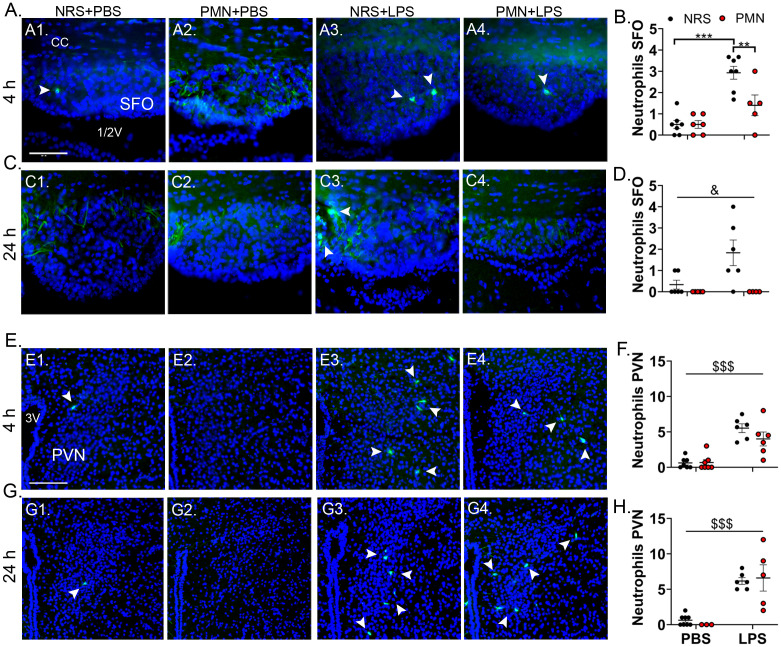
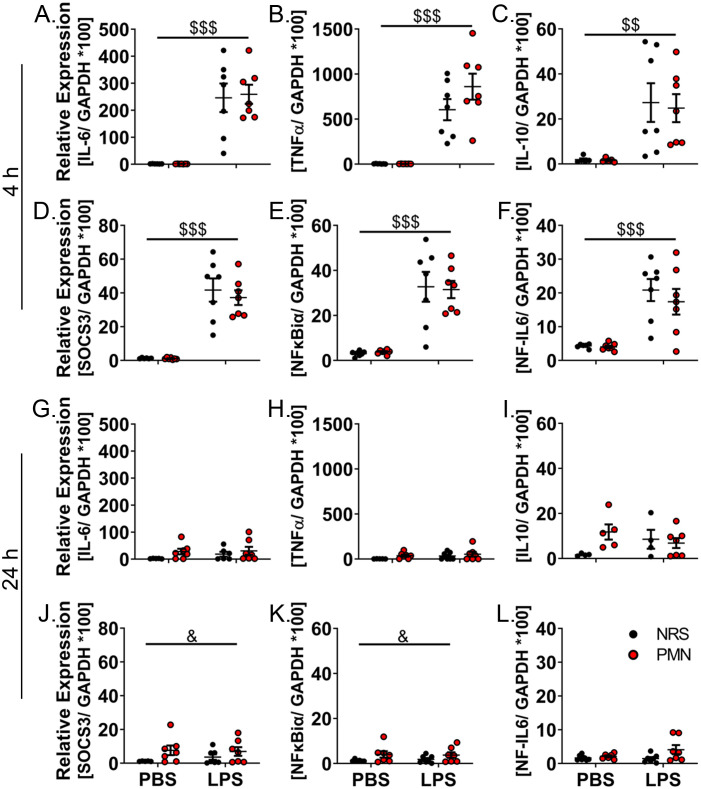
Results: After stimulation with LPS, PMN-pretreated mice showed neutropenia (significantly by ~25% of the control value) and attenuated NG recruitment to the brain in a structure dependent manner. LPS-induced hypothermia was more severe in PMN-pretreated mice while other physiological parameters were only altered by LPS alone. Additional analyses in NG depleted mice revealed that corticosterone levels showed an early reduced but late increased magnitude, and circulating cytokines like interleukin-10 were exacerbated during LPS-induced inflammation. Despite a weak overall impact on the brain, the hypothalamus of neutropenic mice presented exacerbated LPS-induced levels of IL-6, a key mediator of inflammation, compared to immunocompetent control mice.

Discussion: Overall, we found that partial NG depletion exaggerates the peripheral inflammatory response and this strong peripheral reaction may contribute to the exacerbation of sickness symptoms most likely involving circulating IL-10 with strong implications for clinical cases of neutropenic patients.

Keywords: hypothermia; immune-to-brain signaling; inflammation; neutropenia; neutrophil granulocytes; sickness response.


Conflict of interest statement

The authors declare that the research was conducted in the absence of any commercial or financial relationships that could be construed as a potential conflict of interest.

Figures

Figure 1
Figure 1
Neutrophil granulocyte depletion exacerbated LPS-induced hypothermia but not other physiological parameters. An intra-abdominal transmitter continuously recorded the physiological parameters of mice pre-treated with anti-polymorphonuclear serum (PMN) or normal rabbit serum (NRS) by intraperitoneal (IP) injection and subsequently challenged with IP lipopolysaccharide (LPS, 2.5 mg/kg) or phosphate buffered saline (PBS) as indicated by an arrow. (A) Core body temperature (T abd.). (B) Activity counts per minute. Data are presented as line graphs over time, grey boxes indicate the dark or night cycle, with mean ± SEM (n=23–24 [-2–4 h p.i.] / n=14 [4–24 h p.i.]). (C) Total food intake at 24 h p.i. with LPS. (D) Total water intake at 24 h p.i. with LPS. Data are presented as dotplots with mean ± SEM (n=11-13). (A, B) Statistical analysis were performed by Two-way repeated measures ANOVA and a Holm-Bonferroni post-hoc test with the effects: &PMN, §LPS; $NRS+PBS vs. NRS+LPS, *PMN+PBS vs. PMN+LPS, #NRS+LPS vs. PMN+LPS. (C, D) Statistical analysis were performed by Two-way ANOVA with the main effect $LPS (§ p<0.05, §§ p<0.01, §§§ p<0.001, & p<0.05, && p<0.01, &&& p<0.001, $ p<0.05, $$$ p<0.001, ## p<0.01, ### p<0.001, ***p<0.001).
Figure 2
Figure 2
Peripheral inflammation was enhanced and corticosterone production altered by neutrophil granulocyte depletion during LPS-induced inflammation. Circulating levels of inflammatory mediators in the serum were compared between PMN or NRS pre-treated mice after PBS or LPS IP injection (2.5 mg/kg) 4 h and 24 h after stimulation. (A, H) Interleukin (IL)-6. (B, I) Tumor necrosis factor (TNF)α. (C, J) IL-10. (D, K) Ratio of IL-10:TNFα. (E, L) CXCL1. (F, M) CXCL2. (G, N) CCL5. (O, P) Corticosterone. Data are presented as dotplots with mean ± SEM (n=5–7 [4 h p.i.] / n=10–14 [24 h p.i.]). Statistical analysis was performed by Two-way ANOVA and Tukey post-hoc test with the main effects: &PMN, $LPS (*p< 0.05, **p< 0.01, ***p< 0.001, & p< 0.05, $$$ p< 0.001).
Figure 3
Figure 3
LPS-induced neutrophil granulocyte recruitment to the brain was attenuated in a structure dependent manner by pre-treatment with PMN but not NRS. (A, C) Immunofluorescence staining of neutrophil granulocytes (green) at the level of the subfornical organ (SFO) 4 h or 24 h after stimulation (scale bar = 50 μm). (B, D) The number of neutrophil granulocytes in the SFO were counted and compared between PMN or NRS pre-treated mice after PBS or LPS IP injection 4 h or 24 h after stimulation. Data are presented as dotplots with mean ± SEM (n=4-7). (E, G) Immunofluorescence staining of neutrophil granulocytes (green) at the level of the paraventricular nucleus (PVN) for the indicated time point (scale bar = 100 μm). (F, H) The number of neutrophil granulocytes in the PVN were counted and compared between PMN or NRS pre-treated mice after PBS or LPS IP injection 4 h or 24 h after stimulation. Data are presented as dotplots with mean ± SEM (n=3-8). The corpus callosum (cc) and 1/2/3 ventricle (v) are shown as structural reference points. Dapi (blue) visualizes the surrounding tissue. Statistical analysis were performed by Two-way ANOVA and Tukey post-hoc test with the main effects: &PMN, $LPS (**p< 0.01, ***p< 0.001, & p< 0.05, $$$ p< 0.001).
Figure 4
Figure 4
LPS-induced expression of inflammatory signaling pathways in the hypothalamus was altered by neutrophil granulocyte depletion 24 h after LPS-stimulation. RT-qPCR analysis of hypothalamic inflammation was compared between PMN or NRS pre-treated mice after PBS or LPS IP injection 4 h or 24 h after stimulation. (A, G) IL-6. (B, H) TNFα. (C, I) IL-10. (D, J) Suppressor of cytokine signaling 3 (SOCS3). (E, K) Nuclear factor κB inhibitor α (NFκBiα). (F, L) Nuclear factor (NF)-IL6. Data are presented as dotplots with mean ± SEM (n=4-7). Statistical analysis were performed by Two-way ANOVA with the main effects: &PMN, $LPS (& p< 0.05, $$ p< 0.01, $$$ p< 0.001).
Figure 5
Figure 5
Expression of prostaglandin E2 catalyzing enzymes was altered by neutrophil granulocyte depletion 24 h after PBS- or LPS-stimulation. RT-qPCR analysis of hypothalamic prostaglandin E2 enzymes were compared between PMN or NRS pre-treated mice after PBS or LPS IP injection 4 h or 24 h after stimulation. (A, C) Cyclooxygenase 2 (COX2). (B, D) Microsomal prostaglandin E synthase (mPGES). Data are presented as dotplots with mean ± SEM (n=6-7). Statistical analysis were performed by Two-way ANOVA with the main effects: &PMN, $LPS (& p< 0.05, $$$ p< 0.001).
Figure 6
Figure 6
LPS-induced IL-6, CXCL2, and CCL5 levels in the hypothalamus were exacerbated by neutrophil granulocyte depletion. Hypothalamic levels of inflammatory mediators were compared between PMN or NRS pre-treated mice after PBS or LPS IP injection 4 h or 24 h after stimulation. (A, H) IL-6. (B, I) TNFα. (C, J) IL-10. (D, K) CXCL1. (E, L) CXCL2. (F, M) CXCL5. (G, N) CCL5. Data are presented as dotplots with mean ± SEM (n=6-7). Statistical analysis were performed by Two-way ANOVA and Tukey post-hoc test with the main effect: $LPS (*p< 0.05, **p< 0.01, ***p< 0.001, $ p< 0.05, $$$ p< 0.001).
Figure 7
Figure 7
Neutrophil extracellular trap (NET) formation in the brain was not affected by neutrophil granulocyte depletion. (A, B) Immunofluorescence staining of the NET markers citrullinated histone H3 (H3cit; red) and DNA/histone complex (DNA/His; green) at the level of the median preoptic nucleus (MnPO) 4 h or 24 h after stimulation (overview scale bar = 25 μm, insert scale bar = 10 μm). The arcuate nucleus (ac) is shown as a structural reference point. Dapi (blue) visualizes the surrounding tissue. (C, E) Raw integrated density (Raw IntDen) for H3Cit in relation to Dapi were compared between PMN or NRS pre-treated mice after PBS or LPS IP injection 4 h or 24 h after stimulation. (D, F) Raw IntDen for DNA/His in relation to Dapi were compared between PMN or NRS pre-treated mice after PBS or LPS IP injection 4 h or 24 h after stimulation. (G) Raw IntDen for H3Cit in relation to Dapi were compared over time. (H) Raw IntDen for DNA/His in relation to Dapi were compared over time. Data are presented as dotplots with mean ± SEM (n=4-5). Statistical analysis were performed by Two-way ANOVA with the main effects: §Time (§ p< 0.05).

Similar articles

References

    1. Semmler A, Hermann S, Mormann F, Weberpals M, Paxian SA, Okulla T, et al. Sepsis causes neuroinflammation and concomitant decrease of cerebral metabolism. J Neuroinflammation. (2008) 5:38. doi: 10.1186/1742-2094-5-38 - DOI - PMC - PubMed
    1. Karampela I, Fragkou PC. Future perspectives in the diagnosis and treatment of sepsis and septic shock. Medicina (Kaunas). (2022) 58. doi: 10.3390/medicina58070844 - DOI - PMC - PubMed
    1. Schiel X, Hebart H, Kern WV, Kiehl MG, Solch JP, Wilhelm S, et al. Sepsis in neutropenia–guidelines of the infectious diseases working party (AGIHO) of the german society of hematology and oncology (DGHO). Ann Hematol. (2003) 82 Suppl 2:S158–66. doi: 10.1007/s00277-003-0770-6 - DOI - PubMed
    1. Wiersinga WJ, Leopold SJ, Cranendonk DR, van der Poll T. Host innate immune responses to sepsis. Virulence. (2014) 5:36–44. doi: 10.4161/viru.25436 - DOI - PMC - PubMed
    1. Pizzo PA. Management of fever in patients with cancer and treatment-induced neutropenia. N Engl J Med. (1993) 328:1323–32. doi: 10.1056/NEJM199305063281808 - DOI - PubMed

LinkOut - more resources