Potential Errors in CMAQ NO:NO2 Ratios and Upper Tropospheric NO2 Impacting the Interpretation of TROPOMI Retrievals
- PMID: 40534900
- PMCID: PMC12172011
- DOI: 10.1021/acsestair.4c00198
Potential Errors in CMAQ NO:NO2 Ratios and Upper Tropospheric NO2 Impacting the Interpretation of TROPOMI Retrievals
Abstract
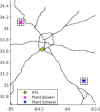
Although Chemical Transport Models (CTMs) such as the Community Multiscale Air Quality Model (CMAQ) have been used in linking observations of trace gases to emissions and developing vertical column distributions, there remain consistent biases between CTM simulations and satellite retrievals. Simulated tropospheric NO2 vertical column densities (VCDs) are generally higher over areas with large NO x sources when compared with retrievals, while an opposite bias is found over low NO x regions. Artificial (i.e., numerical) dilution in the model, where emissions are mathematically dispersed uniformly within the originating CTM grid, can impact modeled NO:NO2 ratios, while lower CTM VCD levels often observed over rural areas can be attributed to missing emission sources of NO x or flawed horizontal/vertical transport. Potential causes of both low and high biases are assessed in this study using CMAQ and Tropospheric Monitoring Instrument (TROPOMI) NO2 retrievals. It was found that more detailed modeling of NO x plumes to assess the NO:NO2 ratio in two power plant plumes can mitigate the effect of artificial computational dilution, reducing the bias and overall differences in the observed vs modeled plumes (errors reduced by 30%). Adjustments of upper tropospheric NO2 led to overall improvements, with a reduction in CMAQ bias (-43% to -29%) and improved spatial correlation (0.81 to 0.86). This study highlights the importance of having accurate modeled NO:NO2 ratios when comparing models to retrievals and the impact of unintentional numerical dilution.
Keywords: NO2 vertical column densities; NOx ratio; TROPOMI; chemical transport models; power plants; satellite retrievals.
© 2025 The Authors. Published by American Chemical Society.
Figures


Similar articles
-
Assessing the comparative effects of interventions in COPD: a tutorial on network meta-analysis for clinicians.Respir Res. 2024 Dec 21;25(1):438. doi: 10.1186/s12931-024-03056-x. Respir Res. 2024. PMID: 39709425 Free PMC article. Review.
-
Prenatal administration of progestogens for preventing spontaneous preterm birth in women with a multiple pregnancy.Cochrane Database Syst Rev. 2019 Nov 20;2019(11):CD012024. doi: 10.1002/14651858.CD012024.pub3. Cochrane Database Syst Rev. 2019. PMID: 31745984 Free PMC article.
-
Spatiotemporal mapping and assessment of daily ground NO2 concentrations in China using high-resolution TROPOMI retrievals.Environ Pollut. 2021 Mar 15;273:116456. doi: 10.1016/j.envpol.2021.116456. Epub 2021 Jan 8. Environ Pollut. 2021. PMID: 33477063
-
Use of β-adrenoreceptor drugs and Parkinson's disease incidence in women from the French E3N cohort study.J Parkinsons Dis. 2025 Jun;15(4):789-804. doi: 10.1177/1877718X251330993. Epub 2025 Apr 29. J Parkinsons Dis. 2025. PMID: 40302366
-
Molecular feature-based classification of retroperitoneal liposarcoma: a prospective cohort study.Elife. 2025 May 23;14:RP100887. doi: 10.7554/eLife.100887. Elife. 2025. PMID: 40407808 Free PMC article.
References
-
- Ialongo I., Virta H., Eskes H., Hovila J., Douros J.. Comparison of TROPOMI/Sentinel-5 Precursor NO2 observations with ground-based measurements in Helsinki. Atmospheric Measurement Techniques. 2020;13(1):205–218. doi: 10.5194/amt-13-205-2020. - DOI
-
- Lorente A., Boersma K. F., Eskes H. J., Veefkind J. P., van Geffen J. H. G. M., de Zeeuw M. B., Denier van der Gon H. A. C., Beirle S., Krol M. C.. Quantification of nitrogen oxides emissions from build-up of pollution over Paris with TROPOMI. Sci. Rep. 2019;9(1):20033. doi: 10.1038/s41598-019-56428-5. - DOI - PMC - PubMed
-
- Kim H. C., Kim S., Lee S.-H., Kim B.-U., Lee P.. Fine-Scale Columnar and Surface NOx Concentrations over South Korea: Comparison of Surface Monitors, TROPOMI, CMAQ and CAPSS Inventory. Atmosphere. 2020;11(1):101. doi: 10.3390/atmos11010101. - DOI
-
- Kim S.-W., Heckel A., Frost G. J., Richter A., Gleason J., Burrows J. P., McKeen S., Hsie E.-Y., Granier C., Trainer M.. NO2 columns in the western United States observed from space and simulated by a regional chemistry model and their implications for NOx emissions. J. Geophys. Res. 2009 doi: 10.1029/2008JD011343. - DOI
-
- Copernicus Space Component Mission Management Team. S5P Products. https://sentinels.copernicus.eu/web/sentinel/data-products/-/asset_publi... (accessed 2021 Aug 2).
LinkOut - more resources
Full Text Sources
