

Strong Host Modulation of Rhizosphere-to-Endosphere Microbial Colonisation in Natural Populations of the Pan-Palaeotropical Keystone Grass Species, Themeda triandra
- PMID: 40534981
- PMCID: PMC12174961
- DOI: 10.1002/ece3.71595
Strong Host Modulation of Rhizosphere-to-Endosphere Microbial Colonisation in Natural Populations of the Pan-Palaeotropical Keystone Grass Species, Themeda triandra
Abstract
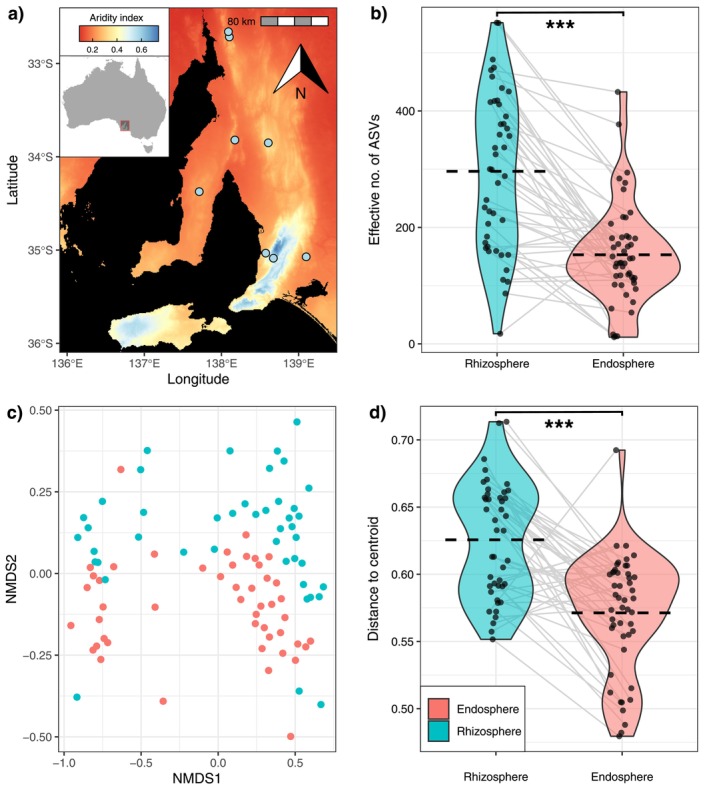
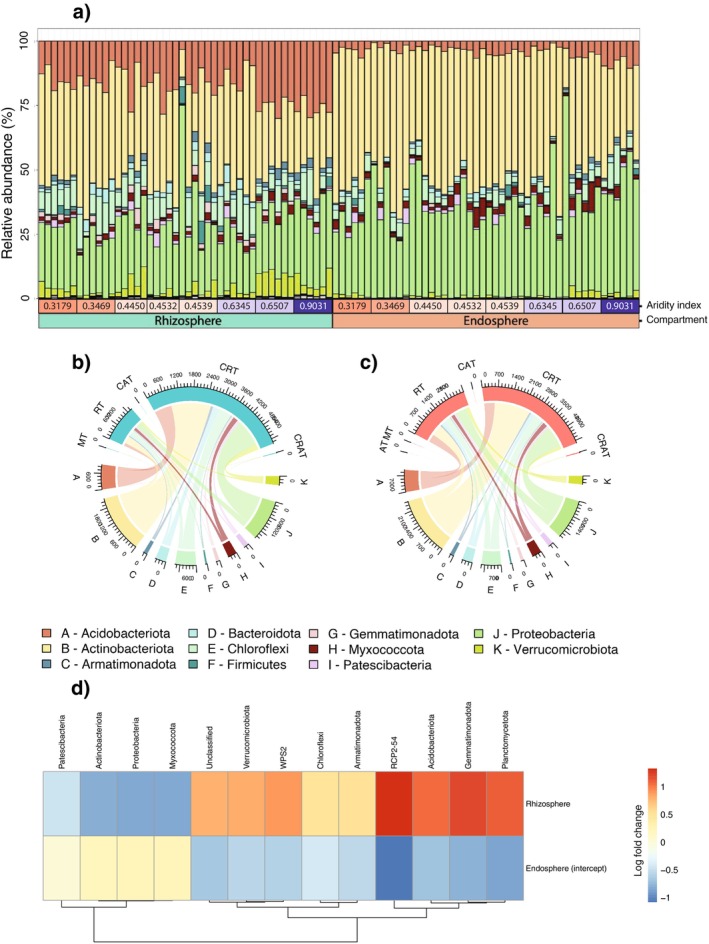
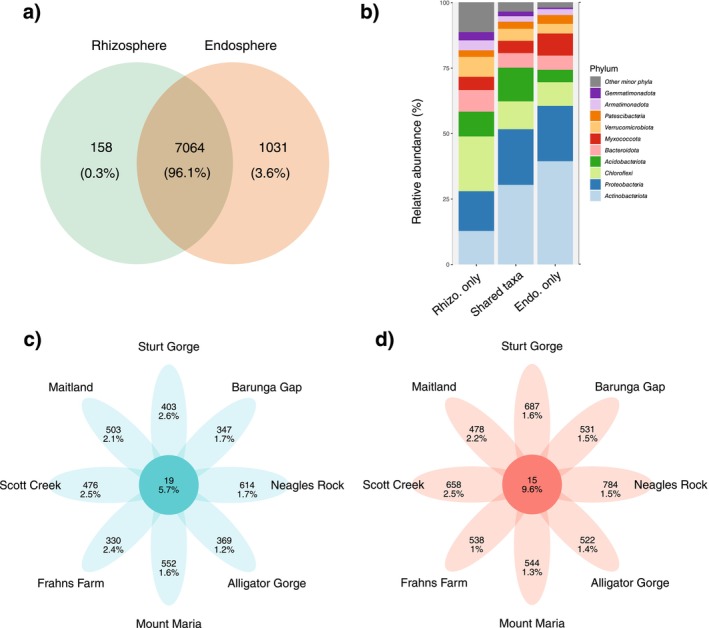
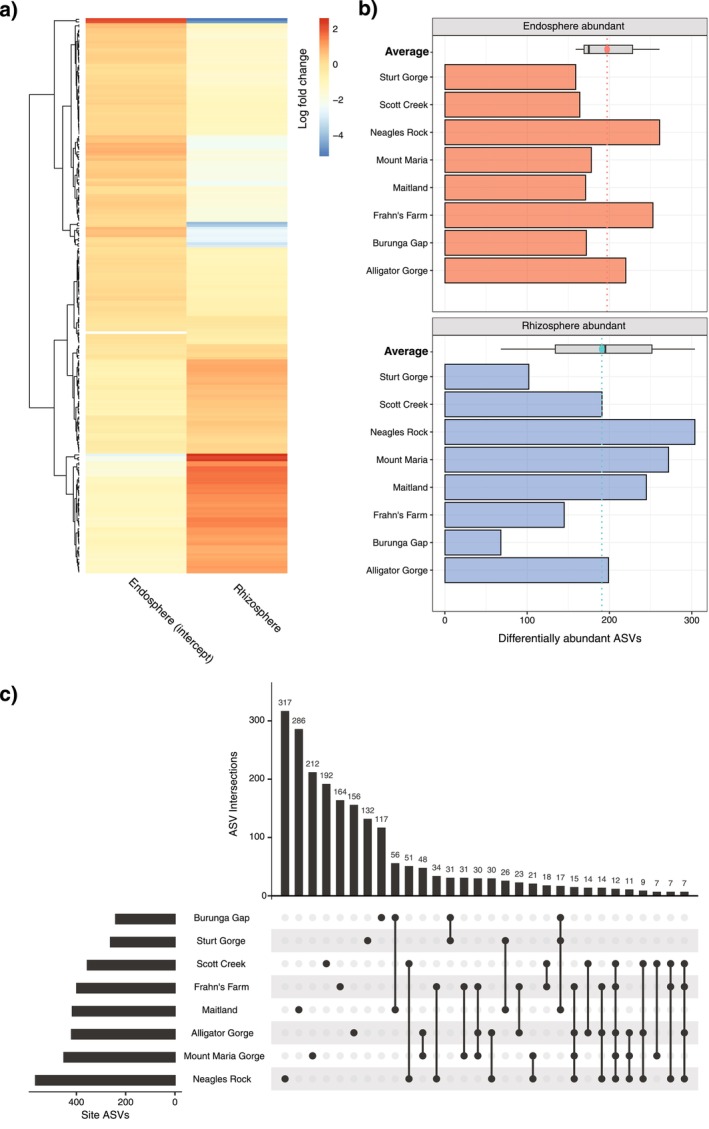
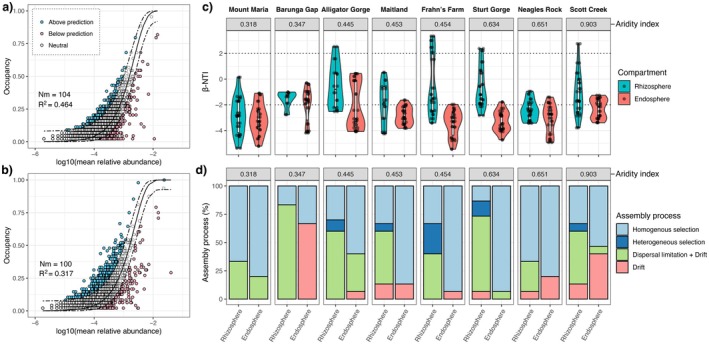
Soil microbiota can colonise plant roots through a two-step selection process, involving recruitment of microbiota first from bulk soil into plant rhizospheres, then into root endospheres. This process is poorly understood in all but a few model species (e.g., Arabidopsis), which is surprising given its fundamental role in plant and soil ecology. Here, we examined the microbial community assembly processes across the rhizospheres and root endospheres in eight natural populations of the pan-palaeotropical C4 grass, Themeda triandra, in southern Australia. Using a space-for-time substitution approach, we assessed whether bacterial root colonisation patterns conformed to the two-step model and tested whether community assembly was driven more by deterministic or stochastic processes. Our results show that the two-step selection process shaped bacterial recruitment dynamics across these natural T. triandra populations, and we provide clear evidence that host plants influence microbial assembly via deterministic pressures that produce strong community convergence within endospheres. These findings highlight the central role of host filtering in shaping a conserved 'core' endosphere microbiome. However, limited understanding of these endosphere communities constrains efforts to harness these important relationships to, for example, improve plant propagation and revegetation practices.
Keywords: Themeda triandra; endosphere; microbial ecology; neutral theory model; rhizosphere; two‐step selection process.
© 2025 The Author(s). Ecology and Evolution published by British Ecological Society and John Wiley & Sons Ltd.
Conflict of interest statement
The authors declare no conflicts of interest.
Figures
Similar articles
-
Arid Soil Bacterial Legacies Improve Drought Resilience of the Keystone Grass, Themeda triandra.Mol Ecol. 2025 Aug 18:e70062. doi: 10.1111/mec.70062. Online ahead of print. Mol Ecol. 2025. PMID: 40820964
-
Ecological mechanisms of microbial assembly in clonal plant Glechoma longituba: from soil to endosphere.Appl Environ Microbiol. 2025 Jun 18;91(6):e0033625. doi: 10.1128/aem.00336-25. Epub 2025 May 12. Appl Environ Microbiol. 2025. PMID: 40353652 Free PMC article.
-
A tale of two vineyards: parsing site-specific differences in bacterial and fungal communities of wine grapes from proximal vineyards and their changes during processing in a single winery.Appl Environ Microbiol. 2025 Jun 18;91(6):e0052625. doi: 10.1128/aem.00526-25. Epub 2025 May 5. Appl Environ Microbiol. 2025. PMID: 40323100 Free PMC article.
-
Assessing the comparative effects of interventions in COPD: a tutorial on network meta-analysis for clinicians.Respir Res. 2024 Dec 21;25(1):438. doi: 10.1186/s12931-024-03056-x. Respir Res. 2024. PMID: 39709425 Free PMC article. Review.
-
How Useful Are Plant Traits in Explaining Variation in Phyllosphere Microbial Abundance and Composition Across Hosts?Environ Microbiol. 2025 Jun;27(6):e70123. doi: 10.1111/1462-2920.70123. Environ Microbiol. 2025. PMID: 40527519 Free PMC article.
References
-
- Abdelfattah, A. , Tack A. J. M., Lobato C., Wassermann B., and Berg G.. 2023. “From Seed to Seed: The Role of Microbial Inheritance in the Assembly of the Plant Microbiome.” Trends in Microbiology 31: 346–355. - PubMed
-
- ALA . 2014. Mean Annual Aridity Index. Atlas of Living Australia.
-
- Bai, B. , Liu W., Qiu X., Zhang J., Zhang J., and Bai Y.. 2022. “The Root Microbiome: Community Assembly and Its Contributions to Plant Fitness.” Journal of Integrative Plant Biology 64: 230–243. - PubMed
-
- Bardgett, R. D. , Bullock J. M., Lavorel S., et al. 2021. “Combatting Global Grassland Degradation.” Nature Reviews Earth and Environment 2: 720–735.
LinkOut - more resources
Full Text Sources
Miscellaneous
