

Dynamic nomogram for predicting the overall survival and cancer-specific survival of patients with gastrointestinal neuroendocrine tumor: a SEER-based retrospective cohort study and external validation
- PMID: 40535122
- PMCID: PMC12173924
- DOI: 10.3389/fonc.2025.1594591
Dynamic nomogram for predicting the overall survival and cancer-specific survival of patients with gastrointestinal neuroendocrine tumor: a SEER-based retrospective cohort study and external validation
Abstract
Background: Gastrointestinal neuroendocrine tumor (GI-net) is a rare heterogeneous tumor, and there is a lack of models to predict its prognosis. Our study aims to develop and validate two new nomograms to predict the overall survival (OS) and cancer-specific survival (CSS) of GI-net patients and investigate their application value.
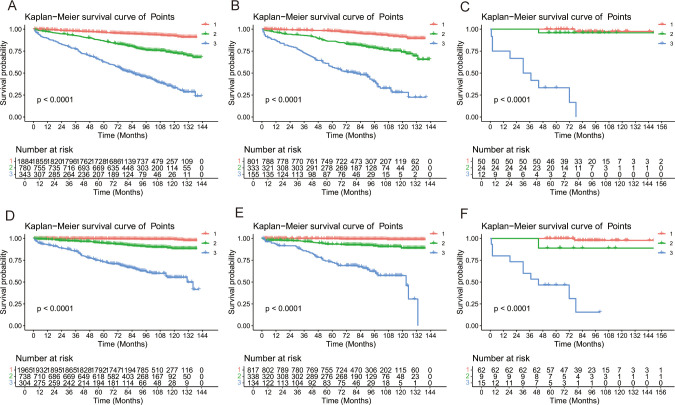
Methods: SEER*Stat 8.4.4 software was used to download clinicopathological information of GI-net patients between 2010 and 2015 from the Surveillance, Epidemiology, and End Results (SEER) database. These patients were randomly divided into a training group (n=3007) and an internal-validation group (n=1289) at a 7:3 ratio. Patients from the Fourth Hospital of Hebei Medical University were enrolled in this study to form the external-validation group (n=86). Univariate and multivariate Cox analyses were performed to explore the independent prognostic factors and establish two nomograms. The concordance index (C-index), area under the time-dependent receiver operating characteristic curve (AUC), calibration curve, and decision curve analysis (DCA) were used to evaluate the nomograms. X-tile was used to divide GI-net patients into high-, medium-, and low-risk groups. Kaplan-Meier (KM) curves and log-rank tests were used to compare survival differences among the three groups.
Results: Seven variables (age, site, size, grade, M stage, surgery, and chemotherapy) were selected to establish the nomogram for OS, and 6 variables (age, size, grade, M stage, surgery, and chemotherapy) were selected for CSS. The C indices (0.785, 0.813, and 0.936 in the training, internal-validation, and external-validation groups for OS; 0.888, 0.893, and 0.930 for CSS, respectively) and AUCs (≥0.7) indicated that the nomograms had satisfactory discriminative ability. Calibration curve analysis and DCA revealed that the nomogram had a satisfactory ability to predict OS and CSS. KM curves indicated that each of the two nomograms clearly differentiated the high-, medium-, and low-risk groups. In addition, two online risk calculators were developed to predict the OS and CSS of these patients visually.
Conclusions: Our nomograms may play an important role in predicting 3- and 5-year OS and CSS for GI-net patients. Risk stratification systems and online risk calculators can be utilized in clinical practice to help doctors create personalized treatment plans.
Keywords: cancer-specific survival (CSS); gastrointestinal neuroendocrine tumor (GI-net); nomogram; overall survival (OS); surveillance epidemiology and end results (SEER) database.
Copyright © 2025 Wang, Wang, Song, Ma, Zheng, Guo, Wang, Zhang and Er.
Conflict of interest statement
The authors declare that the research was conducted in the absence of any commercial or financial relationships that could be construed as a potential conflict of interest.
Figures


Similar articles
-
Development and validation of a nomogram for predicting overall and cancer-specific survival in elderly patients (≥ 65 years) with epithelial ovarian cancer.Eur J Med Res. 2025 Sep 1;30(1):831. doi: 10.1186/s40001-025-03114-0. Eur J Med Res. 2025. PMID: 40890885 Free PMC article.
-
Development and validation of nomograms for predicting survival of locally advanced rectosigmoid junction cancer patients: a SEER database analysis.Transl Cancer Res. 2025 May 30;14(5):2808-2821. doi: 10.21037/tcr-24-1810. Epub 2025 May 27. Transl Cancer Res. 2025. PMID: 40530120 Free PMC article.
-
Two web-based dynamically interactive nomograms and risk stratification systems for predicting survival outcomes and guiding treatment in non-metastatic nasopharyngeal carcinoma.J Cancer Res Clin Oncol. 2023 Nov;149(17):15969-15987. doi: 10.1007/s00432-023-05363-0. Epub 2023 Sep 8. J Cancer Res Clin Oncol. 2023. PMID: 37684510 Free PMC article. Clinical Trial.
-
Smoking Adversely Affects Survival of Metastatic Lung Carcinoid Patients: Analysis of a Large International Audit and Prognostic Models for Metastasis-Free Survival and Overall Survival.Neuroendocrinology. 2025 Jul 2:1-13. doi: 10.1159/000547192. Online ahead of print. Neuroendocrinology. 2025. PMID: 40602391 Review.
-
Limitations of nomogram models in predicting survival outcomes for glioma patients.Front Immunol. 2025 Mar 18;16:1547506. doi: 10.3389/fimmu.2025.1547506. eCollection 2025. Front Immunol. 2025. PMID: 40170838 Free PMC article.
References
-
- Yao JC, Hassan M, Phan A, Dagohoy C, Leary C, Mares JE, et al. One hundred years after “carcinoid”: epidemiology of and prognostic factors for neuroendocrine tumors in 35,825 cases in the United States. J Clin oncology: Off J Am Soc Clin Oncology. (2008) 26:3063–72. doi: 10.1200/JCO.2007.15.4377 - DOI - PubMed
LinkOut - more resources
Full Text Sources