

Distinct Airway Microbiome and Metabolite Profiles in Eosinophilic and Neutrophilic Asthma
- PMID: 40535324
- PMCID: PMC12174932
- DOI: 10.2147/JAA.S521800
Distinct Airway Microbiome and Metabolite Profiles in Eosinophilic and Neutrophilic Asthma
Abstract
Background: Asthma is a chronic, heterogeneous disease driven by inflammatory phenotypes, primarily eosinophilic asthma (EA) and neutrophilic asthma (NEA). While allergen triggers are well-known, the role of the airway microbiome and metabolites in asthma exacerbations remains poorly understood.
Methods: We recruited 64 participants (24 EA, 20 NEA, 20 healthy controls [HC]) for the discovery cohort, with validation in an external cohort (10 EA, 8 NEA, 8 HC). Induced sputum samples were analyzed using 16S rRNA sequencing to profile bacterial composition and non-targeted metabolomics to assess airway metabolites. Random forest models identified diagnostic markers, validated in the external cohort.
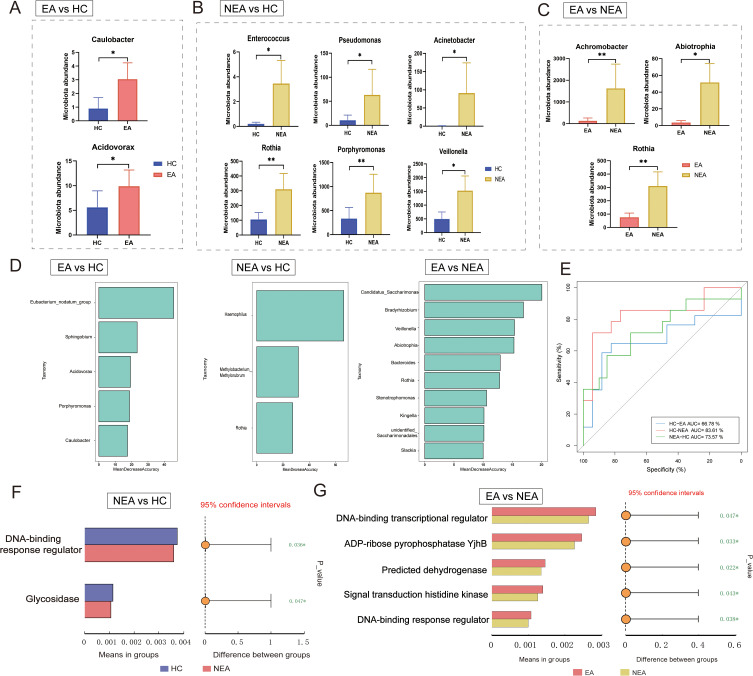
Results: Significant shifts in airway microbiota were observed, particularly between NEA and HC, and between EA and NEA. Four bacterial general-Stenotrophomonas, Streptococcus, Achromobacter, and Neisseria-were consistently identified across groups. Veillonella was more abundant in NEA vs HC, while Achromobacter was enriched in NEA vs EA, indicating distinct microbial signatures. Metabolomic profiling revealed distinct pathways: pyrimidine metabolism (EA vs HC), tryptophan metabolism (NEA vs HC), and arachidonic acid metabolism (EA vs NEA). Microbial-metabolite correlations indicated microbiota-driven metabolic activity. Biomarker candidates were validated in the external cohort.
Conclusion: The airway microbiota and metabolites are intricately linked to asthma exacerbations, with distinct patterns between EA and NEA. These findings highlight their potential as diagnostic biomarkers and therapeutic targets for personalized asthma management.
Keywords: 16S rRNA amplicon sequencing; biomarker; eosinophilic; metabolomics; neutrophils asthma.
© 2025 Liu et al.
Conflict of interest statement
The authors have declared that no competing interest exists.
Figures


Similar articles
-
Oscillometry-defined small airway dysfunction in steroid-naïve adult bronchial asthma: association with eosinophilic and non-eosinophilic phenotypes.J Asthma. 2025 Sep 5:1-7. doi: 10.1080/02770903.2025.2552737. Online ahead of print. J Asthma. 2025. PMID: 40911390
-
Integrating Gut Microbiome and Metabolomics with Magnetic Resonance Enterography to Advance Bowel Damage Prediction in Crohn's Disease.J Inflamm Res. 2025 Jun 11;18:7631-7649. doi: 10.2147/JIR.S524671. eCollection 2025. J Inflamm Res. 2025. PMID: 40535353 Free PMC article.
-
Molecular feature-based classification of retroperitoneal liposarcoma: a prospective cohort study.Elife. 2025 May 23;14:RP100887. doi: 10.7554/eLife.100887. Elife. 2025. PMID: 40407808 Free PMC article.
-
Retrospective Analysis of Gut Microbiota and Metabolomic Profiles in Pregnant Women: Association with Cesarean Section Risk.Int J Womens Health. 2025 Jun 12;17:1763-1770. doi: 10.2147/IJWH.S526040. eCollection 2025. Int J Womens Health. 2025. PMID: 40530360 Free PMC article.
-
Defining disease severity in atopic dermatitis and psoriasis for the application to biomarker research: an interdisciplinary perspective.Br J Dermatol. 2024 Jun 20;191(1):14-23. doi: 10.1093/bjd/ljae080. Br J Dermatol. 2024. PMID: 38419411 Free PMC article. Review.
References
LinkOut - more resources
Full Text Sources
