

A Nomogram Combining Two Novel Biomarkers for Predicting Lung Adenocarcinoma in Ground-Glass Nodule Patients
- PMID: 40535419
- PMCID: PMC12176472
- DOI: 10.1155/humu/8647969
A Nomogram Combining Two Novel Biomarkers for Predicting Lung Adenocarcinoma in Ground-Glass Nodule Patients
Abstract
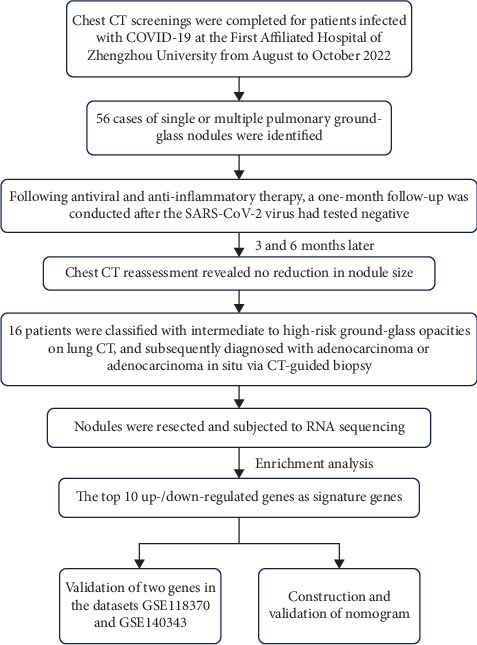
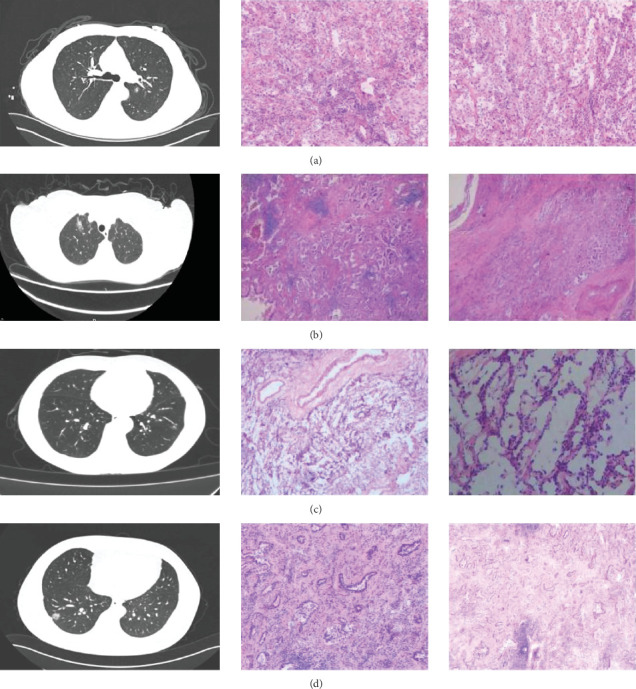
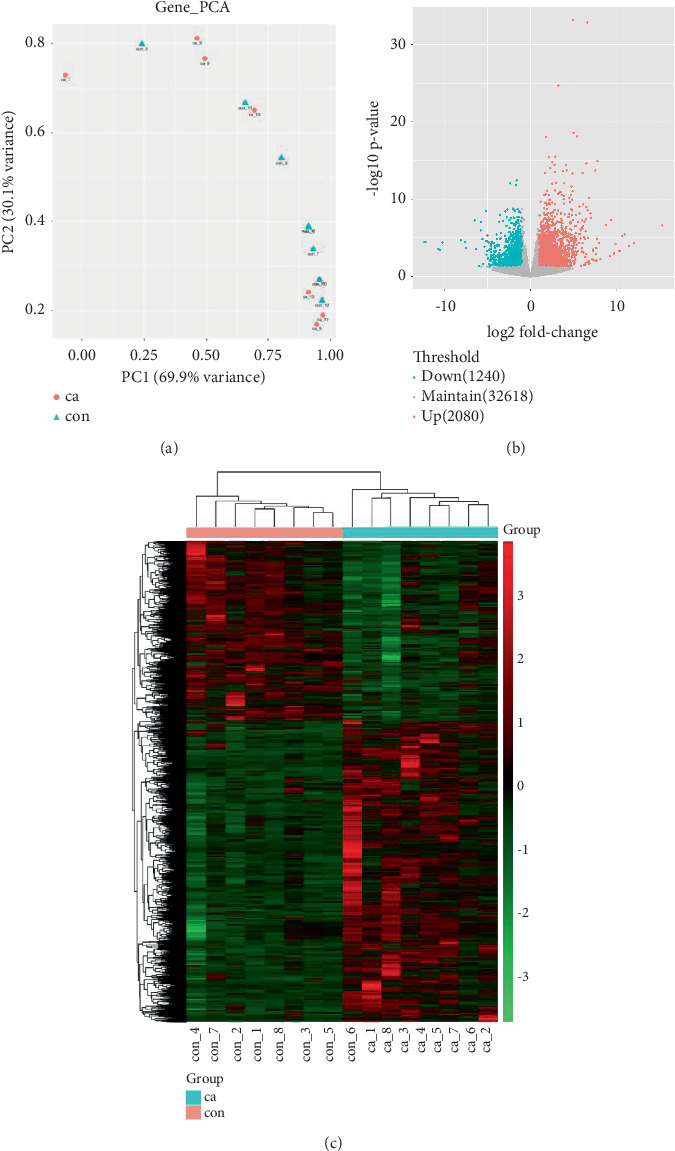
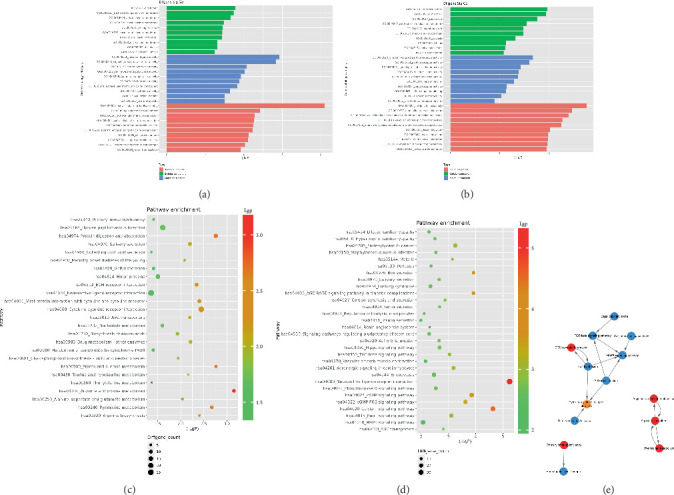
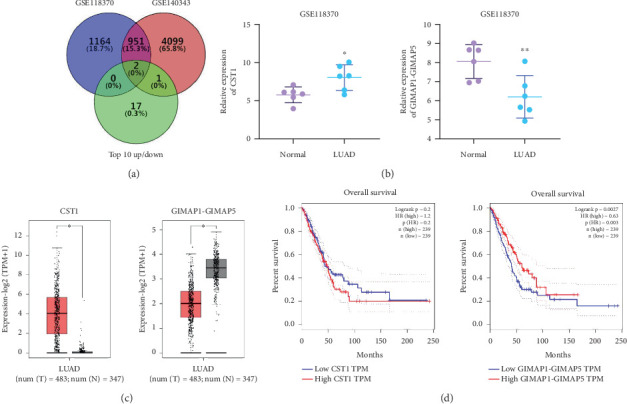
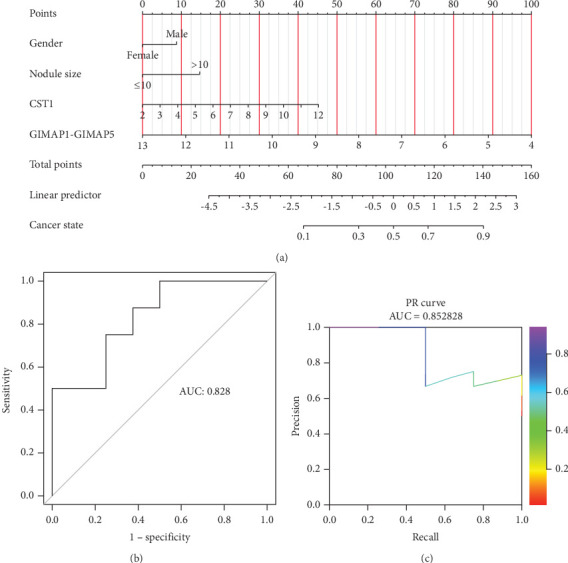
Objective: Combination of CT imaging and RNA sequencing techniques was used to explore the potential biomarkers specific to lung adenocarcinoma within pulmonary ground-glass nodules. Method: The imaging and pathological data of patients with pulmonary ground-glass nodules who underwent chest CT scanning were confirmed through surgical procedures. Based on the pathological results, the patients were categorized into a benign nodule group and a malignant nodule group. Subsequently, RNA sequencing was conducted to analyze gene expression information in the pulmonary ground-glass nodules of these 16 patients. Results: CT signs demonstrated statistical significance in both benign and malignant nodules. A total of 2080 upregulated genes and 1240 downregulated genes were identified through RNA sequencing in malignant nodules compared to benign nodules. CST1 exhibited increased expression among the upregulated genes in lung adenocarcinoma tissues compared to lung tissues. Among the downregulated genes, only GIMAP1-GIMAP5 showed decreased expression in lung adenocarcinoma tissues. Finally, we validated the clinical significance of CST1 and GIMAP1-GIMAP5 in patients with lung adenocarcinoma, particularly highlighting a strong correlation between GIMAP1-GIMAP5 expression levels and prognosis for patients. A visual nomogram predictive model for pulmonary ground-glass nodules was constructed (area under the receiver operating characteristic curve (AUC) > 0.8). Conclusion: We constructed a nomogram combining CST1 and GIMAP1-GIMAP5 expression for predicting lung adenocarcinoma in ground-glass nodules in the context of COVID-19. This nomogram addresses the unique diagnostic challenges posed by COVID-19, where overlapping pulmonary imaging findings between viral pneumonia and early lung cancer necessitate robust molecular-aided discrimination.
Keywords: RNA sequencing technology; lung adenocarcinoma; nomogram; pulmonary ground-glass nodules.
Copyright © 2025 Yameng Li and Qingxian Zhang. Human Mutation published by John Wiley & Sons Ltd.
Conflict of interest statement
The authors declare no conflicts of interest.
Figures
Similar articles
-
Plasma exosomal tsRNA may be used as a marker for differential diagnosis of benign and malignant pulmonary nodules.J Transl Med. 2025 Jul 1;23(1):712. doi: 10.1186/s12967-025-06737-3. J Transl Med. 2025. PMID: 40597381 Free PMC article.
-
A nomogram for predicting invasiveness of lung adenocarcinoma manifesting as pure ground-glass nodules: incorporating subjective CT signs and histogram parameters based on artificial intelligence.J Cancer Res Clin Oncol. 2023 Nov;149(17):15323-15333. doi: 10.1007/s00432-023-05262-4. Epub 2023 Aug 25. J Cancer Res Clin Oncol. 2023. PMID: 37624396 Free PMC article.
-
Radiomics Nomogram Based on Optimal Volume of Interest Derived from High-Resolution CT for Preoperative Prediction of IASLC Grading in Clinical IA Lung Adenocarcinomas: A Multi-Center, Large-Population Study.Technol Cancer Res Treat. 2024 Jan-Dec;23:15330338241300734. doi: 10.1177/15330338241300734. Technol Cancer Res Treat. 2024. PMID: 39569528 Free PMC article.
-
Value of circulating tumor cell assisting low-dose computed tomography in screening pulmonary nodules based on existing liquid biopsy techniques: a systematic review with meta-analysis and trial sequential analysis.Clin Transl Oncol. 2024 Dec;26(12):3252-3263. doi: 10.1007/s12094-024-03556-8. Epub 2024 Jun 13. Clin Transl Oncol. 2024. PMID: 38869739
-
The TSANZ Practical Guide for Clinicians in the Management of Screen- and Incidentally-Detected Nodules.Respirology. 2025 Jul;30(7):558-573. doi: 10.1111/resp.70065. Epub 2025 May 29. Respirology. 2025. PMID: 40438947 Free PMC article. Review.
References
MeSH terms
Substances
LinkOut - more resources
Full Text Sources
Medical
