

Long-term trends in rubella incidence across various regions and age groups in China, 2004-2021
- PMID: 40535443
- PMCID: PMC12174117
- DOI: 10.3389/fpubh.2025.1566999
Long-term trends in rubella incidence across various regions and age groups in China, 2004-2021
Erratum in
-
Correction: Long-term trends in rubella incidence across various regions and age groups in China, 2004-2021.Front Public Health. 2025 Jul 9;13:1650142. doi: 10.3389/fpubh.2025.1650142. eCollection 2025. Front Public Health. 2025. PMID: 40703165 Free PMC article.
Abstract
Background: Rubella remains a global public health concern due to the risk of congenital rubella syndrome (CRS). Despite ongoing control measures, China-along with 85% of WHO Western Pacific countries-failed to achieve the 2020 elimination target. This study aimed to analyze temporal trends in rubella incidence across regions and age groups in China to inform and refine national elimination strategies.
Methods: This descriptive study employed a joinpoint regression model to analyze trends in rubella incidence across different regions and age groups in China. The Spearman rank correlation coefficient test was used to examine the correlation between RCV1 coverage and incidence.
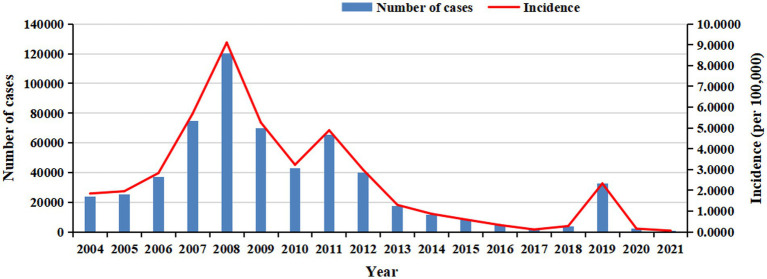
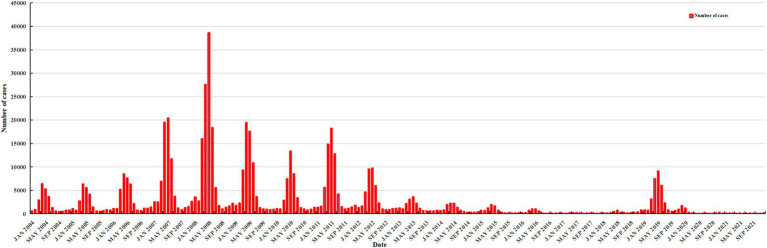
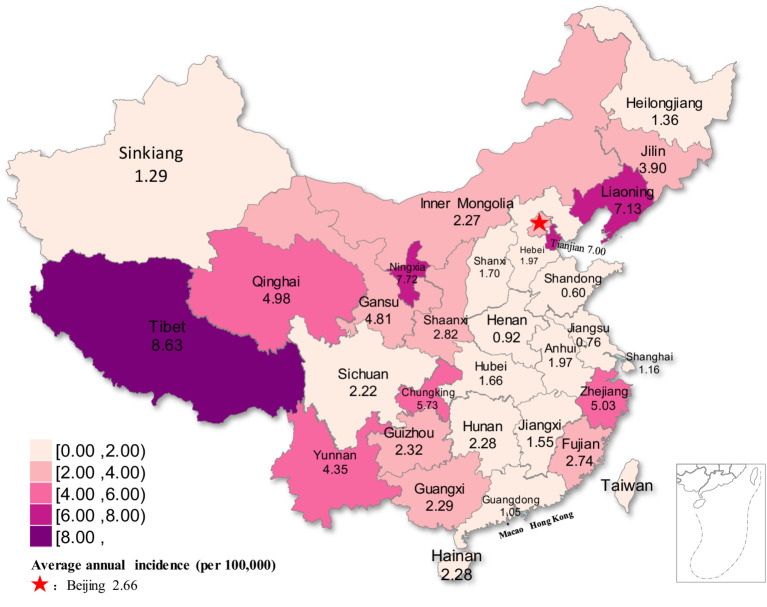
Results: From 2004 to 2021, a total of 583,418 rubella cases were reported in China, with an average annual incidence of 2.3994 cases per 100,000 population. Monthly cases peaked in April and May. The overall trend in rubella incidence remained stable, with an average annual percent change (AAPC) of -6.36% (p = 0.291). However, from 2008 to 2021, the annual percent change (APC) was -18.41% (p = 0.002), demonstrating a significant downward trend. Regions with an average annual incidence exceeding 5 cases per 100,000 population were mainly located in western and eastern China. Significant decreasing trends in rubella incidence were observed in five regions (all p < 0.05). Age groups with average annual incidence rates above 4 cases per 100,000 population were primarily among children and teenagers. Thirteen age groups showed decreasing trends (all p < 0.05). From 2010 to 2021, annual rubella incidence decreased as RCV1 coverage increased, indicating a statistically significant negative correlation (rs = -0.793, p = 0.002).
Conclusion: From 2004 to 2021, China's rubella incidence significantly decreased due to enhanced surveillance and high vaccination coverage, particularly among children aged 0-9 years and in one-sixth of the country's regions. Key recommendations include (1) increasing healthcare investment in underdeveloped regions to improve immunization access, (2) strengthening surveillance and vaccine management in areas with large migrant populations, and (3) implementing supplementary immunization activities (SIAs) targeting teenagers and adults to further reduce the disease burden.
Keywords: China; descriptive study; incidence; joinpoint regression model; rubella.
Copyright © 2025 Su, Su, Huang, Yang, Li and Li.
Conflict of interest statement
The authors declare that the research was conducted in the absence of any commercial or financial relationships that could be construed as a potential conflict of interest.
Figures


References
-
- Chinese Center for Disease Control and Prevention . Categories of infectious diseases. [internet] (2022) [2024 January 04]. Available online at: https://en.chinacdc.cn/health_topics/infectious_diseases/202203/t2022030...
MeSH terms
Substances
LinkOut - more resources
Full Text Sources
Medical
Miscellaneous