. 2025 Jun 4:15:1591285.
doi: 10.3389/fcimb.2025.1591285. eCollection 2025.

Salivary microbiota and IgA responses are different in pre-diabetic individuals compared to normoglycemic controls

Affiliations

Salivary microbiota and IgA responses are different in pre-diabetic individuals compared to normoglycemic controls

Nahoko Kato-Kogoe et al. Front Cell Infect Microbiol. .

Abstract

Introduction: In recent years, changes in the oral microbiota of patients with type 2 diabetes mellitus (T2DM) have been increasingly recognized. The salivary microbiota may also be altered in pre-diabetes, which is the earliest stage of abnormal blood glucose regulation and a reversible stage preceding T2DM; however, its characteristics are poorly understood. Salivary immunoglobulin A (IgA) is a host defense factor central to the oral immune system and may play an important role in regulating the salivary microbiota. Given that alterations in immunoreactivity are observed in pre-diabetes, we hypothesized that the salivary IgA response may also be altered; however, limited knowledge exists regarding this. Therefore, in the present study, we aimed to evaluate the characteristics of salivary microbiota and IgA responses against salivary microbiota in individuals with pre-diabetes, comparing them to those in individuals with normoglycemia.

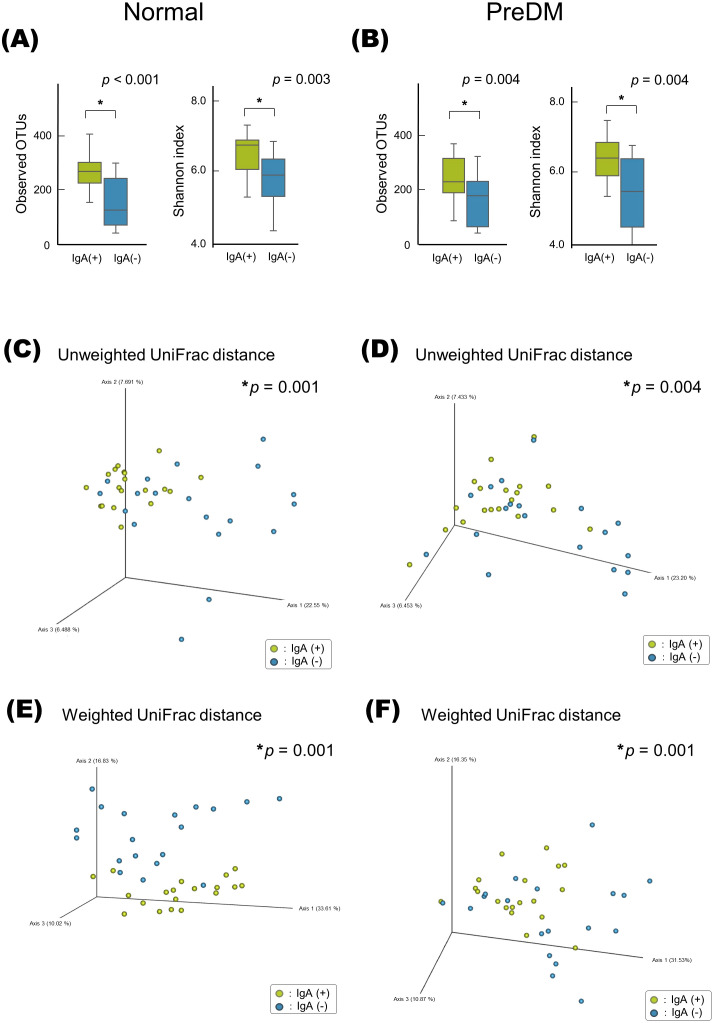
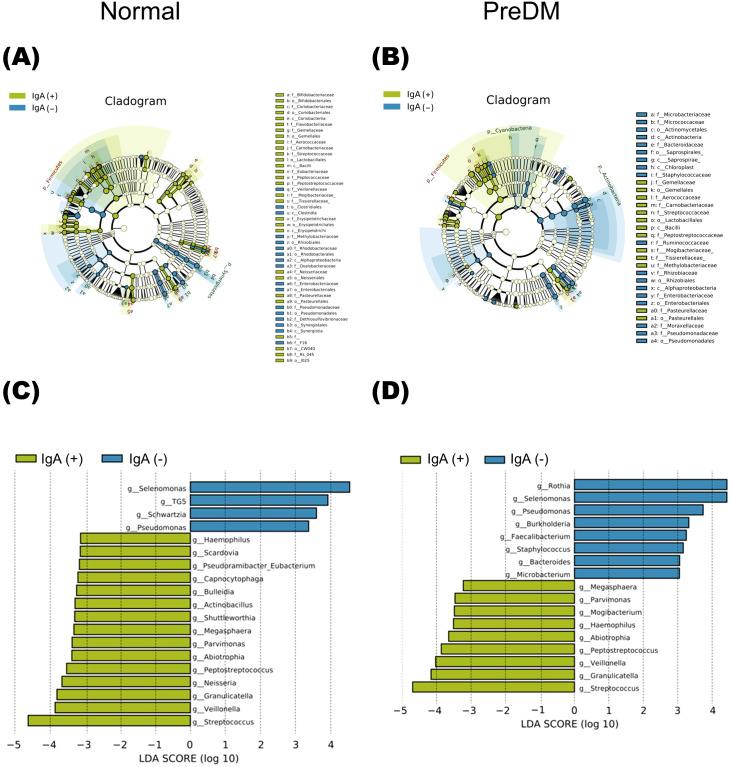
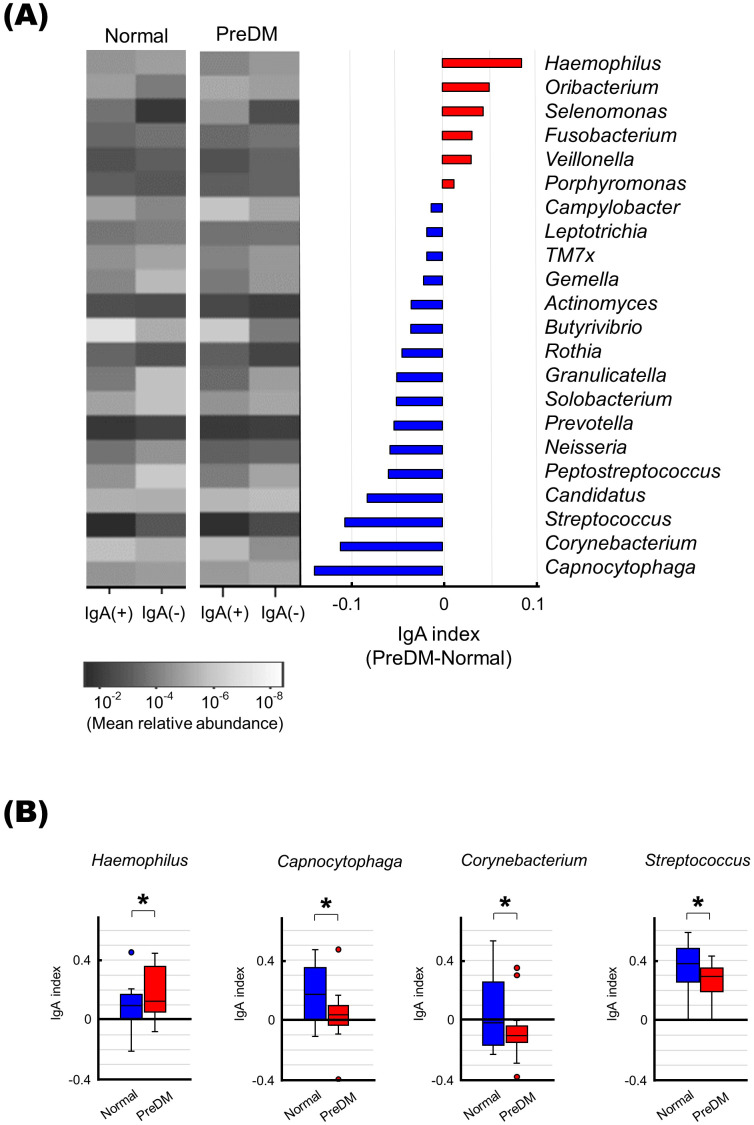
Methods: Saliva samples were collected from 101 pre-diabetic individuals (PreDM group) and 101 age- and sex-matched normoglycemic controls (Normal group). Further, 16S rRNA metagenomic analysis was performed to compare bacterial microbiota composition. For each of the 19 saliva samples from the PreDM and Normal groups, IgA-enriched and IgA-nonenriched fractions were separated via magnetic-activated cell sorting, followed by 16S rRNA metagenomic analysis. The IgA index was calculated to evaluate the difference in the IgA response to each bacterium between the PreDM and Normal groups.

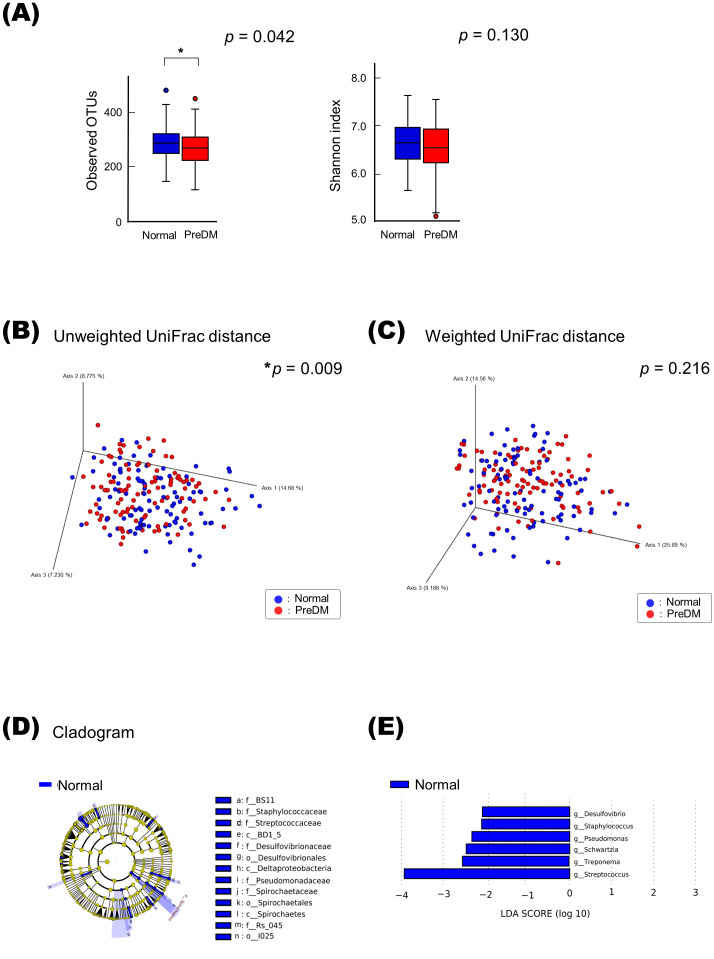
Results: Bacterial species richness was significantly lower in the PreDM group than in the Normal group (observed operational taxonomic unit index, p = 0.042), and a difference between these groups was noted in the overall salivary microbiota structure (unweighted UniFrac distances, p = 0.009). Salivary IgA responses against several bacterial genera differed between the PreDM and Normal groups. Significantly higher IgA responses were noted against Haemophilus in the PreDM group, with lower responses against Capnocytophaga, Corynebacterium, and Streptococcus relative to those in the Normal group.

Conclusions: Salivary microbiota and IgA responses differ between pre-diabetic individuals and normoglycemic controls. The current findings advance our understanding of the interaction between oral bacteria and host immune responses in patients with a poor glycemic status.

Keywords: 16S rRNA; IgA-seq; immunoglobulin A; microbiota; pre-diabetes; saliva.


Conflict of interest statement

The authors declare that this research was conducted in the absence of any commercial or financial relationships that could be construed as potential conflicts of interest.

Figures

Figure 1
Figure 1
Differences in salivary microbiota between the PreDM and Normal groups. Alpha-diversity of the salivary microbiota (A). Operational taxonomic unit (OTU) and Shannon indices in the Normal (n = 101, blue) and PreDM (n = 101, red) groups. *p < 0.05, compared among groups using the Kruskal–Wallis test. Beta-diversity of salivary microbiota. Unweighted (B) and weighted UniFrac distances (C). Principal coordinate analysis (PCoA) plots for samples from 101 participants in the Normal group (blue) and 101 participants in the PreDM group (red). *p < 0.05, compared between groups using PERMANOVA with 999 permutations. Differentially abundant bacterial genera between the Normal and PreDM groups were identified using linear discriminant analysis effect size (LEfSe). Cladograms of differentially abundant bacterial taxa, with each layer representing a different taxon (D). The enriched taxa in the Normal group (blue) are presented in the cladogram, while such were not found in the PreDM group. The central point represents the root of the tree (bacteria), and each ring represents the next lower taxonomic level (phylum to genus: p, phylum; c, class; o, order; f, family; g, genus). Histogram of the linear discriminant analysis (LDA) scores for differentially abundant bacterial taxa between Normal and PreDM groups (E). LDA scores ≥ 2.0 are shown. Blue represents significantly abundant taxa in the Normal group compared to the PreDM group.
Figure 2
Figure 2
Alpha- and beta-diversity of microbiota in IgA-enriched and IgA-nonenriched fractions. Alpha-diversity of salivary microbiota in the Normal (A) and PreDM (B) groups. Operational taxonomic unit (OTU) and Shannon indices in the IgA-enriched (IgA (+)) and IgA-nonenriched (IgA (-)) fractions. *p < 0.05, compared among groups using the Kruskal–Wallis test. Beta-diversity of salivary microbiota. Unweighted UniFrac distances of Normal (C) and PreDM (D), and Weighted UniFrac distances of Normal (E) and PreDM (F). Principal coordinate analysis (PCoA) plot for 19 samples of IgA (+) and (IgA (-) fractions. *p < 0.05, compared between groups using PERMANOVA, 999 permutations.
Figure 3
Figure 3
The differentially abundant bacterial genera between IgA-enriched and IgA-nonenriched fractions identified by linear discriminant analysis effect size (LEfSe). Cladogram of differentially abundant bacterial taxa, where each layer represents a different taxon in the Normal (A) and PreDM (B) groups. The enriched taxa in the IgA-enriched (IgA (+)) and IgA-nonenriched (IgA (-)) fractions are presented in the cladogram. Histogram of the linear discriminant analysis (LDA) scores for differentially abundant bacterial taxa between IgA (+) and IgA (-) fractions from Normal (C) and PreDM (D) groups. LDA scores ≥ 3.0 are shown. Yellow represents significantly abundant taxa in the IgA (+) fraction compared to those in the IgA (-) fraction. Blue represents significantly abundant taxa in the IgA (-) fraction compared with those in the IgA (+) fraction.
Figure 4
Figure 4
Differences in IgA responses to specific bacteria in the PreDM and Normal groups. (A) The left panel shows a heat map showing the mean relative abundance of 22 bacterial genera present in more than 50% of the participants in each fraction. IgA-enriched [IgA (+)) and IgA-nonenriched (IgA (-)] fractions of saliva from the Normal and PreDM groups (n = 19 each) are shown. The bar graph shows the IgA index difference between PreDM and Normal groups. IgA indexes are shown in order of size in PreDM. Red indicates bacterial genera with a larger IgA index in PreDM, blue indicates bacterial genera with a larger IgA index in Normal. (B) Boxplots of IgA index for each bacterial genus for the normal and PreDM groups are shown. *p < 0.05, compared between groups.

Similar articles

References

    1. American Diabetes Association (2022). 2. Classification and diagnosis of diabetes: standards of medical care in diabetes-2022. Diabetes Care 45, S17–s38. doi: 10.2337/dc22-S002 - DOI - PubMed
    1. Borgnakke W. S. (2019). IDF Diabetes Atlas: Diabetes and oral health - A two-way relationship of clinical importance. Diabetes Res. Clin. Pract. 157, 107839. doi: 10.1016/j.diabres.2019.107839 - DOI - PubMed
    1. Borisy G. G., Valm A. M. (2021). Spatial scale in analysis of the dental plaque microbiome. Periodontol 2000 86, 97–112. doi: 10.1111/prd.12364 - DOI - PMC - PubMed
    1. Brown E. L., Essigmann H. T., Hoffman K. L., Palm N. W., Gunter S. M., Sederstrom J. M., et al. (2020). Impact of diabetes on the gut and salivary igA microbiomes. Infect. Immun. 88, e00301–20. doi: 10.1128/iai.00301-20 - DOI - PMC - PubMed
    1. Bunker J. J., Bendelac A. (2018). IgA responses to microbiota. Immunity 49, 211–224. doi: 10.1016/j.immuni.2018.08.011 - DOI - PMC - PubMed

MeSH terms

LinkOut - more resources