. 2025;16(6):1634-1655.
doi: 10.1007/s12671-025-02584-x. Epub 2025 May 7.

Multidimensional Analysis of Twin Sets During an Intensive Week-Long Meditation Retreat: A Pilot Study

Affiliations

Multidimensional Analysis of Twin Sets During an Intensive Week-Long Meditation Retreat: A Pilot Study

Juan P Zuniga-Hertz et al. Mindfulness (N Y). 2025.

Abstract

Objectives: Meditation has long been known to promote health. We utilized a multidisciplinary approach to investigate the impact of mind-body interventions on the body in a twin cohort during a week-long meditation retreat.

Method: This study was designed to address individual changes controlling for intersubject trait variation and explore the role of genetic background on multi-omic factors during meditation. Transcriptomic analysis was carried out from whole blood samples, while metabolomic and biochemical studies were carried out in blood plasma. Quantitative electroencephalography studies, coupled with biometric analysis and molecular studies at multiple time points, were carried out in twins meditating together and in twins separated and simultaneously either meditating or listening to a documentary.

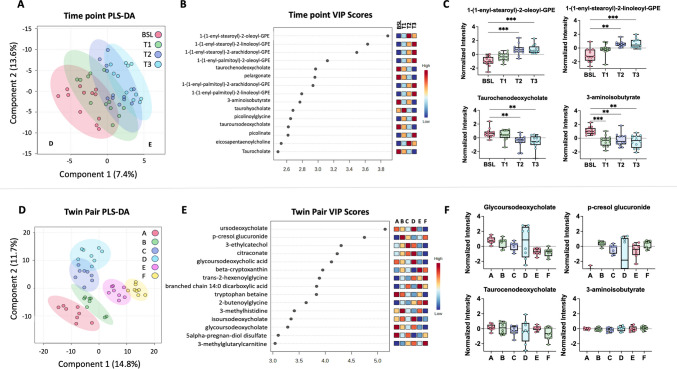
Results: Changes in gene expression, metabolites, and cytokines in blood plasma associated with specific meditative states showed patterns of change relative to the time point being assessed. Twin sets were similar in multiple domains before the start of the retreat, showed considerable divergence at the mid-point, and looked more similar by the end of the retreat. Twin pairs showed significant spectral power correlations in separate rooms and when only one twin meditated. These similarities were not observed in mismatched twin pairs. Heart rate dynamics assessments showed alignment among twin pairs, absent between unmatched pairs.

Conclusions: To our knowledge, this pilot study is novel within the twin research paradigm and is a first step toward exploring the effects of meditation in twins.

Preregistration: This study was not preregistered and was carried out under IRB protocol MED02#20211477.

Supplementary information: The online version contains supplementary material available at 10.1007/s12671-025-02584-x.

Keywords: Brain activity; Gene expression; Meditation; Metabolomics; Mind–body practices; Quantitative electroencephalography (qEEG).


Conflict of interest statement

Conflict of interestJoe Dispenza is employed by Encephalon, Inc., which runs the meditation retreats. The remaining authors declare that the research was conducted without any commercial or financial relationships that could be construed as a potential conflict of interest.

Figures

Fig. 1
Fig. 1
Schematic representation of twin study experimental design. A Outcome measures. B Timeline of meditation and data collection schedule for the 7-day meditation retreat. The retreat included 17 meditations (M1-17). Created with BioRender.com
Fig. 2
Fig. 2
Principal component analysis (PCA) of normalized genes. A Clustering by twin pair IDs. B Clustering by baseline, T1, T2, and T3 groups. Colored areas indicate cluster overlaps according to respective legends. Baseline, n = 10; T1, n = 10; T2, n = 6; T3, n = 7
Fig. 3
Fig. 3
Transcriptomic changes as a function of time. A Hierarchical clustering analysis of the differentially expressed genes ranked by decreasing variance across groups and biological replicates (FC > 1.5, padj < 0.1, baseline n = 10 samples/group; T1 n = 10 samples/group; T2 n = 6 samples/group; T3 n = 7 samples/group). Heatmap colors correspond to absolute gene expression (log2 (normalized counts)): blue, yellow, and red correspond to low to high gene expression according to the scale. BD Volcano scatter plots (− log10p vs. log2FC) of significant DEGs in T1 (B), T2 (C), and T3 (D) relative to baseline/T0. Red and green colors indicate up- and downregulated DEGs, respectively. Gray dots — genes below significance and FC thresholds. Thresholds (log2FC > 0.58 or log2FC < − 0.58) and − log10p < 0.05 are indicated by dashed lines. Selected DEGs are labeled
Fig. 4
Fig. 4
Cluster analysis by Gene Ontology (GO). Biological processes (A), cellular components (B), and molecular functions (C) were identified by enrichment analysis of significant DEGs (p < 0.05) in T1, T2, and T3 relative to baseline/T0. Circle size corresponds to gene ratios (a fraction of differentially expressed genes found in the gene set) and the Fisher exact test p (p < 0.05, blue to red colors — lower to higher significance) according to the scales. H/L columns: GO term is predicted to have higher (H) or lower (L) activity relative to baseline/T0. Lists of GO terms and statistical parameters are included in Supplementary Table S3
Fig. 5
Fig. 5
Changes in selected plasma cytokines, biologically active enzymes, and growth factors. A Percent change (T3 — baseline/T0) for top five upregulated (green) and downregulated (red) proteins. B Percent change (T3 — baseline/T0) for gut-brain axis-related cytokines and proteins showing upregulated (green) and downregulated (red) factors. Protein arrays were performed on blood collected at baseline/T0 (Days 00 or 0) and at T3 (Day 7)
Fig. 6
Fig. 6
Top 15 significantly changed circulating plasma metabolites. A Time point partial least squares-discriminant analysis (PLS-DA) of metabolite changes for baseline (BSL)/T0 (pink), T1 (green), T2 (dark blue), and T3 (light blue). While some metabolites are present in baseline/T0 and T3 time points, significant overlap can be seen throughout the subsequent time points analyzed. B Time point variable importance in projection (VIP) scores indicate the top 15 metabolites changed throughout the retreat. C Box plots demonstrating statistically significant increases in 1-(1-enyl-stearoyl)−2-oleoyl-glycerophosphoethanolamine (GPE) and 1-(1-enyl-stearoyl)−2-linoleoyl-GPE and decreases in taurochenodeoxycholate/TCDCA and 3-aminoisobutyrate/BAIBA. D Twin pair PLS-DA analysis of metabolite changes in twin pairs A (pink), B (green), C (purple), D (light blue), E (magenta), and F (yellow). A strong clustering of metabolites by twin pair was observed. E Twin pair VIP scores for the top 15 metabolites changed during the retreat. F Box plots demonstrating statistically significant changes in glycoursodeoxycholate, p-cresol glucuronide, taurochenodeoxycholate/TCDCA, and 3-aminoisobutyrate/BAIBA
Fig. 7
Fig. 7
Heatmaps of meditation-induced plasma metabolite change over time. Metabolites are classed by relevant pathways, including fatty acid metabolism, primary bile acid metabolism, secondary bile acid metabolism, phosphatidylcholine metabolism, gamma-glutamyl cycle, and tryptophan metabolism. Pathways with an observed increase (pink) or decrease (green) are shown along with corresponding biological processes. BSL, baseline
Fig. 8
Fig. 8
Heart rate dynamics in meditating monozygotic and dizygotic twins. A Comparison of BBI time series in four meditating twin pairs. (A), (B), and (C) correspond to monozygotic twin pairs, while (D) corresponds to a dizygotic twin pair. Data was collected during meditation period 2 (M2, as depicted in Fig. 1). B Mean BBI Pearson correlation between each twin participant and the remaining 7 twin participants for all 17 meditation periods. Values for co-twins are represented by red circles (∙), while values for non-twin pairs are shown as black squares ( <). Each twin group was separated during three of the following meditation periods M3, M4, M9, M10, M14, and M15. C Mean BBI absolute difference between each twin participant and the remaining 7 twin participants for all 17 meditation periods. Values for co-twins are represented by red circles (∙), while values for non-twin pairs are shown as black squares ( <). D Mean and standard error of mean BBI Pearson correlation for T2, DT2, CT2, and N2 groups (defined in Table 2) for all 17 meditation periods. Wilcoxon rank-sum test was performed (*p < 0.05). E Mean and standard error of mean BBI difference for T2, DT2, CT2, and N2 groups for all 17 meditation periods. Wilcoxon rank-sum test was performed (*p < 0.05). F Average mean BBI Pearson correlation of all pairs in T2, DT2, C2, and N2 groups for each meditation period. G Average mean BBI Pearson correlation for T2, DT2, C2, and N2 groups for each meditation period
Fig. 9
Fig. 9
Scalp maps of correlation R-values significantly (p = 0.05) higher than randomly paired twins by bootstrap statistics. A Spectral correlations between twins during the joint baseline/T0 meditation before the retreat. B Spectral correlations during a retreat meditation while co-twins were separated and one was listening to a documentary

References

    1. Almsherqi, Z. A. (2021). Potential role of plasmalogens in the modulation of biomembrane morphology. Frontiers in Cell and Developmental Biology,9, 673917. 10.3389/fcell.2021.673917 - PMC - PubMed
    1. Alvarez-Lopez, M. J., Conklin, Q. A., Cosin-Tomas, M., Shields, G. S., King, B. G., Zanesco, A. P., Kaliman, P., & Saron, C. D. (2022). Changes in the expression of inflammatory and epigenetic-modulatory genes after an intensive meditation retreat. Comprehensive Psychoneuroendocrinology,11, 100152. 10.1016/j.cpnec.2022.100152 - PMC - PubMed
    1. Anders, S., & Huber, W. (2010). Differential expression analysis for sequence count data. Genome Biology,11(10), R106. 10.1186/gb-2010-11-10-r106 - PMC - PubMed
    1. Antoni, M. H., Lutgendorf, S. K., Blomberg, B., Carver, C. S., Lechner, S., Diaz, A., Stagl, J., Arevalo, J. M., & Cole, S. W. (2012). Cognitive-behavioral stress management reverses anxiety-related leukocyte transcriptional dynamics. Biological Psychiatry,71(4), 366–372. 10.1016/j.biopsych.2011.10.007 - PMC - PubMed
    1. Ashburner, M., Ball, C. A., Blake, J. A., Botstein, D., Butler, H., Cherry, J. M., Davis, A. P., Dolinski, K., Dwight, S. S., Eppig, J. T., Harris, M. A., Hill, D. P., Issel-Tarver, L., Kasarskis, A., Lewis, S., Matese, J. C., Richardson, J. E., Ringwald, M., Rubin, G. M., & Sherlock, G. (2000). Gene Ontology: Tool for the unification of biology. The Gene Ontology Consortium. Nature Genetics,25(1), 25–29. 10.1038/75556 - PMC - PubMed