

Spatial Epidemiologic Analysis of Fetal Birth Defects in Guangxi, China
- PMID: 40535711
- PMCID: PMC12176105
- DOI: 10.2147/IJGM.S521948
Spatial Epidemiologic Analysis of Fetal Birth Defects in Guangxi, China
Abstract
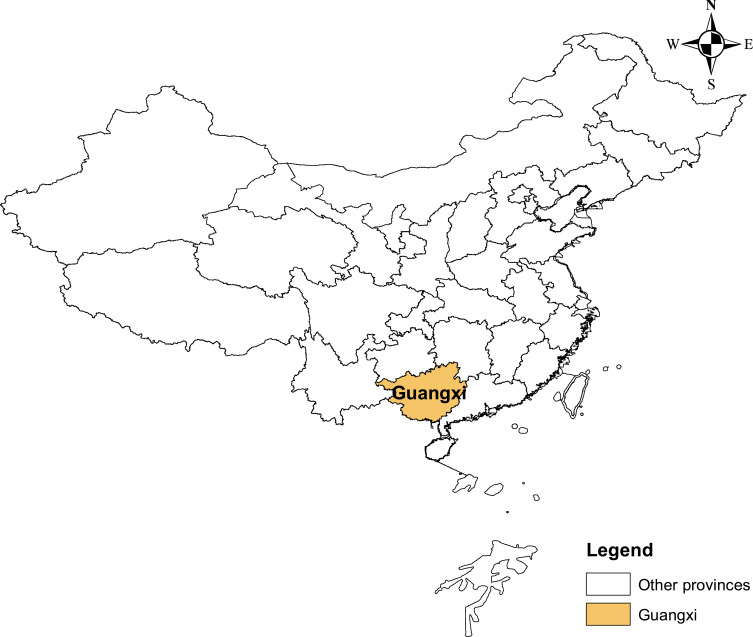
Purpose: To apply various spatial epidemiological approaches to detect spatial trends and geographical clusters of birth defects (BDs) prevalence in Guangxi, China, and to explore the risk factors for BDs.
Methods: Between 2016 and 2022, the Guangxi Birth Defects Monitoring Network (GXBDMN) monitored a total of 4.57 million fetuses in this study. The BDs data for fetuses could be obtained from the GXBDMN. The kriging interpolation, spatial autocorrelation, and spatial regression analyses were used to explore the spatial trends patterns, and risk factors of BDs.
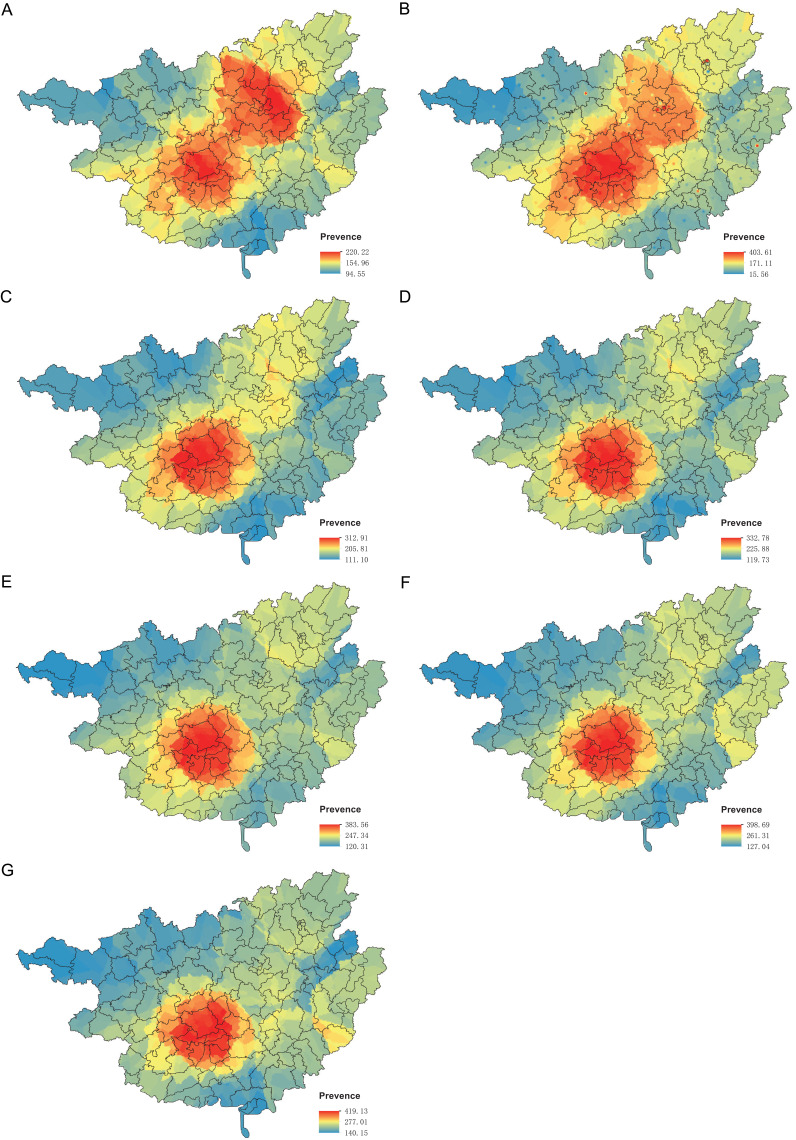
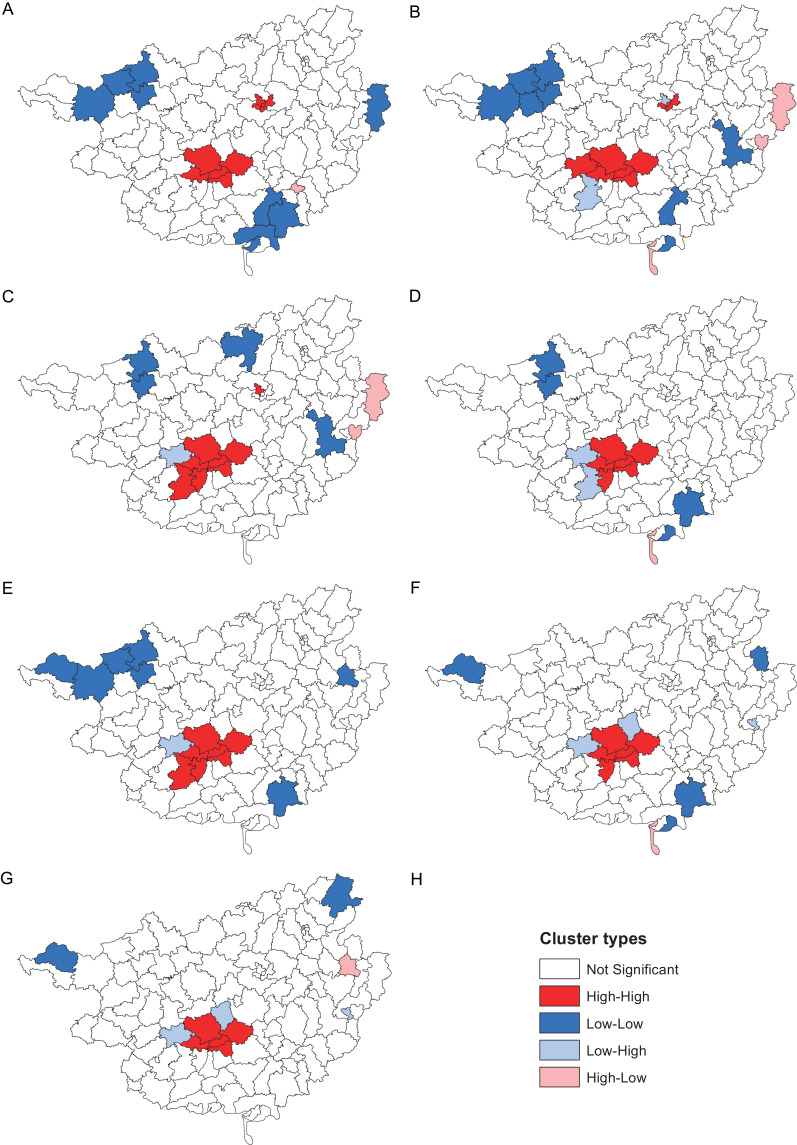
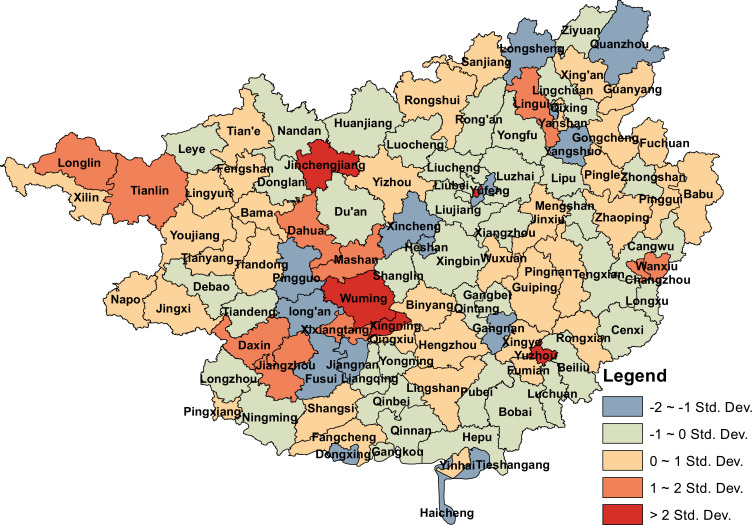
Results: Between 2016 and 2022, 101,786 fetuses were diagnosed with BDs, resulting in an overall BDs prevalence of 222.68 [95% confidence intervals (CI): 221.33-224.04] per 10,000 fetuses. The global spatial autocorrelation analysis showed a positive spatial autocorrelation in the prevalence of BDs at the county level. The local spatial autocorrelation analysis revealed that the primary clustering patterns of BDs prevalence were High-High and Low-Low. The local indicators of spatial association (LISA) cluster map and kriging interpolation analysis showed that the High-High cluster aggregation areas for the BDs prevalence were gradually shifted from Nanning and Liuzhou to Nanning from 2016 to 2022. The spatial lag model (SLM) results showed that the coefficients of education level (β=15.898, P=0.001), family monthly income per capita (β=0.010, P=0.005) and pre-gestational diabetes mellitus (PGDM)/gestational diabetes mellitus (GDM) (β=10.346, P=0.002) were statistically significant.
Conclusion: The spatial trends and geographical cluster patterns of county-level prevalence of BDs in Guangxi are very obvious. Especially, the trend of high clustering in the prevalence of BDs is particularly evident. In addition, BDs are becoming more prevalent due to higher education levels, an increase in family monthly income per capita of pregnant women, and pregnant women with PGDM or GDM.
Keywords: birth defects; fetuses; pregnant women; prevalence; spatial regression; spatiotemporal.
© 2025 Peng et al.
Conflict of interest statement
The authors report no conflicts of interest in this work.
Figures
Similar articles
-
Use of β-adrenoreceptor drugs and Parkinson's disease incidence in women from the French E3N cohort study.J Parkinsons Dis. 2025 Jun;15(4):789-804. doi: 10.1177/1877718X251330993. Epub 2025 Apr 29. J Parkinsons Dis. 2025. PMID: 40302366
-
Prevalence and odds of anxiety and depression in cutaneous malignant melanoma: a proportional meta-analysis and regression.Br J Dermatol. 2024 Jun 20;191(1):24-35. doi: 10.1093/bjd/ljae011. Br J Dermatol. 2024. PMID: 38197404
-
[Disease burden and future trend predictions of age-related hearing loss in China and worldwide from 1990 to 2021].Beijing Da Xue Xue Bao Yi Xue Ban. 2025 Jun 18;57(3):545-553. doi: 10.19723/j.issn.1671-167X.2025.03.019. Beijing Da Xue Xue Bao Yi Xue Ban. 2025. PMID: 40509833 Free PMC article. Chinese.
-
Epidemiological changes in tuberculosis and genotyping characteristics of Mycobacterium Tuberculosis in Ningxia, China.Front Microbiol. 2025 Jun 4;16:1582163. doi: 10.3389/fmicb.2025.1582163. eCollection 2025. Front Microbiol. 2025. PMID: 40535020 Free PMC article. Review.
-
[Analysis of the trend and spatial aggregation of cervical cancer mortality in Shandong Province, 1970-2021].Zhonghua Zhong Liu Za Zhi. 2025 Jun 23;47(6):485-490. doi: 10.3760/cma.j.cn112152-20231016-00198. Zhonghua Zhong Liu Za Zhi. 2025. PMID: 40534263 Chinese.
References
-
- World Health Organization. Congenital disorders: overview. 2025. Available from: https://www.who.int/health-topics/congenital-anomalies#tab=tab_1. Accessed February 07, 2025.
-
- World Health Organization. Congenital conditions. 2025. Available from: https://www.who.int/teams/maternal-newborn-child-adolescent-health-and-a.... Accessed February 07, 2025.
-
- National Health Commission of the people’s Republic of China. Notice on printing and distributing the national program for comprehensive prevention and control of birth defects (GWBFYF [2018] No.19). 2018. Available from: http://www.nhc.gov.cn/fys/s3589/201812/9644ce7d265342779099d54b6962a4e0..... Accessed February 07, 2025.
-
- Bai Z, Han J, An J, et al. The global, regional, and national patterns of change in the burden of congenital birth defects, 1990–2021: an analysis of the global burden of disease study 2021 and forecast to 2040. EClinicalMedicine. 2024;77:102873. doi: 10.1016/j.eclinm.2024.102873 - DOI - PMC - PubMed
LinkOut - more resources
Full Text Sources
