. 2025 Jun 4:16:1537053.
doi: 10.3389/fphar.2025.1537053. eCollection 2025.

Antimalarial compounds exhibit variant- and cell-type-specific activity against SARS-CoV-2 isolated in Panama

Affiliations

Antimalarial compounds exhibit variant- and cell-type-specific activity against SARS-CoV-2 isolated in Panama

Mario Quijada et al. Front Pharmacol. .

Abstract

Background: This study evaluates the antiviral activity of antimalarial compounds against SARS-CoV-2 variants isolated in Panama (2020-2022).

Methods: For this purpose, we conducted a series of in vitro assays in two host mammalian cell systems, Vero-E6 and Calu-3 cells, to assess the antiviral activity of twenty-six antimalarials and antiviral compounds against the Delta and A2.5 variants.

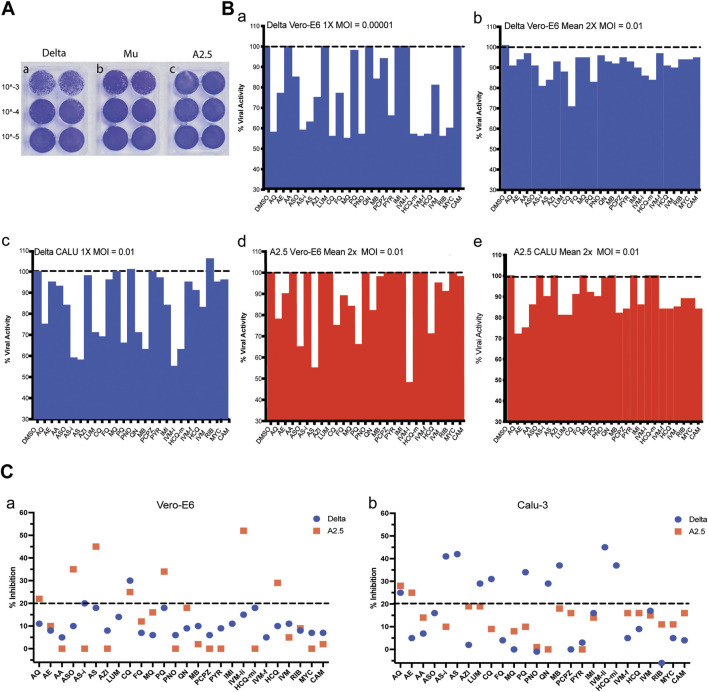
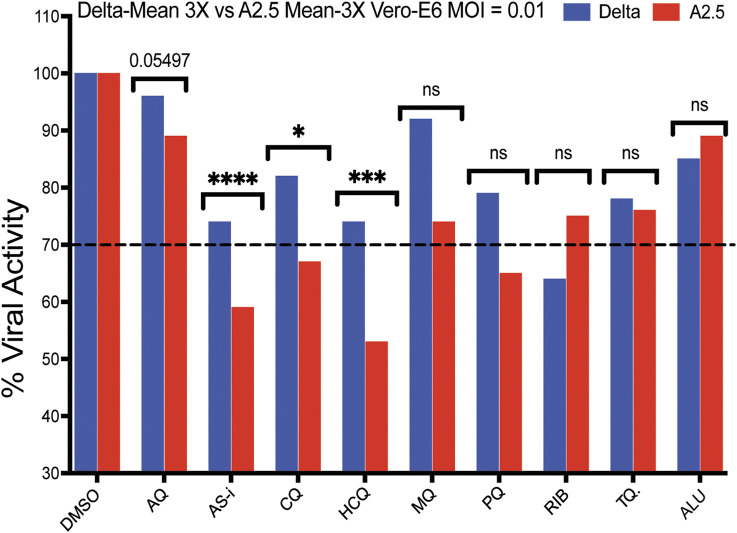
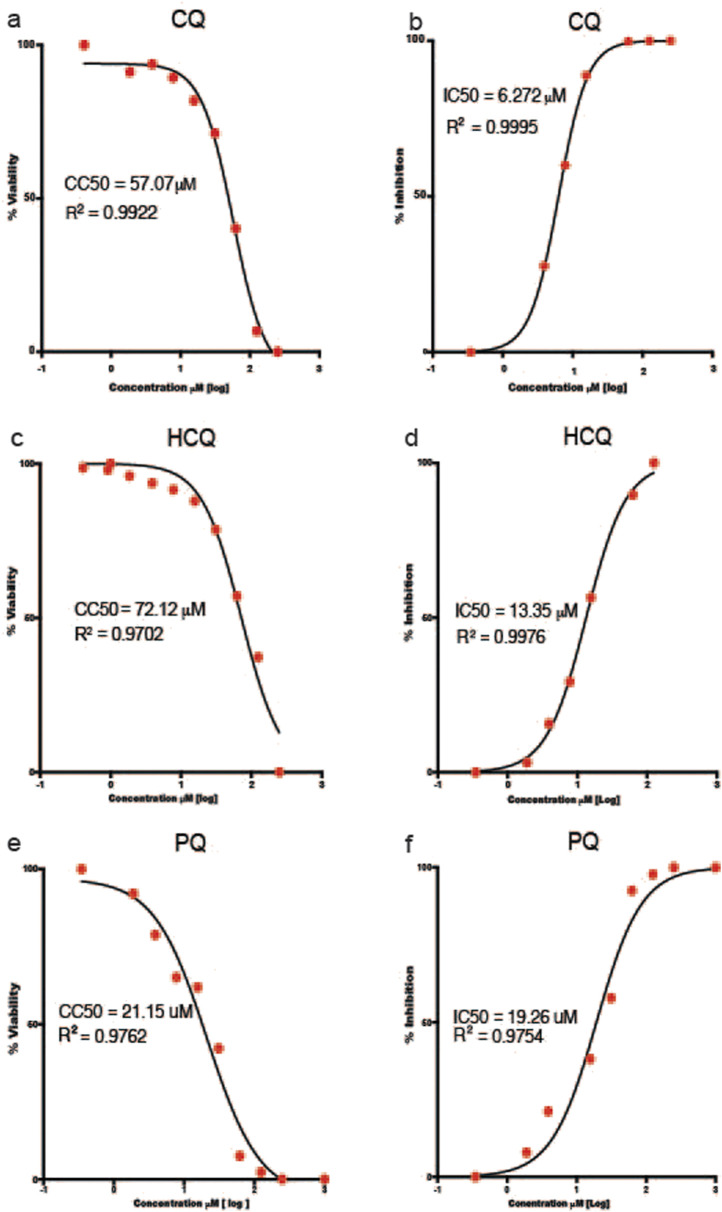
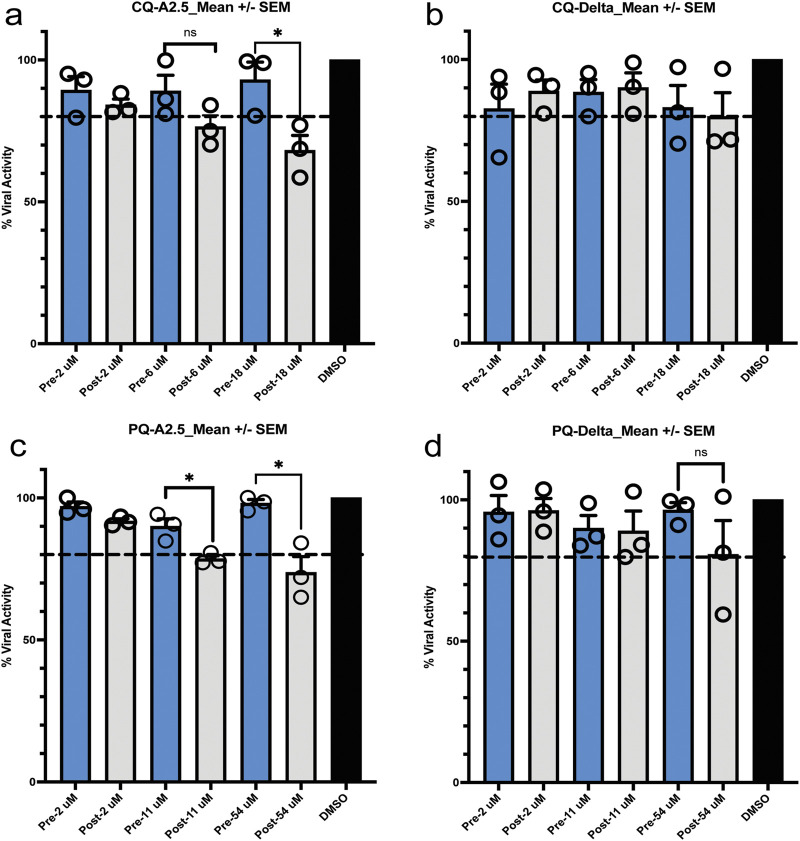
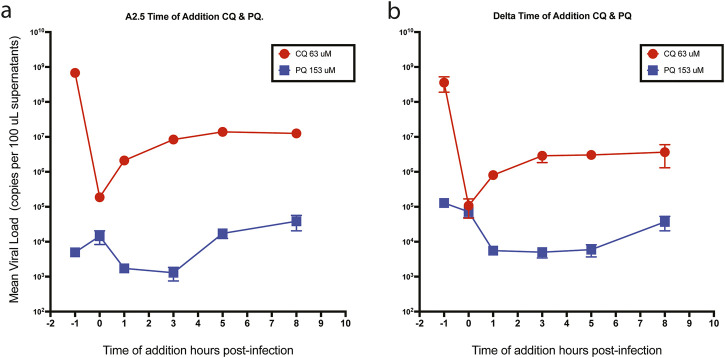
Results: In the initial screening using Vero-E6 cells, with an antiviral inhibition threshold of ≥20% and cell viability of ≥80%, chloroquine (CQ) significantly inhibited the Delta variant. Meanwhile, amodiaquine (AQ), artemisone (ASO), and ivermectin (IVM) showed activity against the A2.5 variant. In Calu-3 cells, a wider variety of compounds, including chloroquine (CQ), amodiaquine (AQ), artesunate (AS), lumefantrine (LUM), and hydroxychloroquine (HCQ), were found to be effective against the Delta variant. However, only amodiaquine (AQ) and arteether (AE) showed activity against the A2.5 variant, indicating that the response varies depending on the variant and the type of cells involved. Secondary screenings further demonstrated CQ's high inhibitory activity, with an IC50 of 6.3 μM and a selectivity index of 8, followed by HCQ, which was 1.8 times more potent against A2.5 than Delta. Time-of-addition experiments suggested that CQ and primaquine (PQ) were ineffective during the viral adsorption phase but showed a dose-dependent antiviral effect against the A2.5 variant in the early replication phase, whereas the Delta variant showed resistance.

Conclusion: This study underscores the critical role of selecting appropriate cell models for SARS-CoV-2 research, as drug efficacy varies between viral variants and host cell types.

Keywords: COVID-19; Calu-3; Panama; SARS-CoV-2 variants; Vero-E6; antimalarials; antivirals; in vitro.


Conflict of interest statement

The authors declare that the research was conducted in the absence of any commercial or financial relationships that could be construed as a potential conflict of interest.

Figures

FIGURE 1
FIGURE 1
Amino acid mutations analysis of the S protein and N proteins of the SARS-CoV-2 variants. Alignment of amino acid sequences of the S (a) protein and the N (b) protein of SARS-Cov-2 of the A2.5, Mu, and Delta variants circulating in Panama with reference to the isolate Wuhan-Hu-1 (NC_045512.2).
FIGURE 2
FIGURE 2
Viral titration and antiviral activity of antimalarial compounds against variants of the SARS-Cov-2 virus. (A) Virus titration by plaque forming units (PFU) was carried out in 6 well plates of Vero-E6 cells confluent monolayers infected with three dilutions in duplicate of viral stock (10−3 to 10−5) of the a) Delta, b) Mu, and c) A.2.5 variants of SARS-Cov2 isolated in Panama during 2020–2022. Titers were determined by counting the plaque number x reciprocal of dilution x reciprocal of the volume in mL expressed as PFU x ml-1. (B) a) Antiviral activity of 26 antimalarials and other compounds at their maximal non-cytotoxic concentration (MNCC) against the Delta and A2.5 variants in Vero-E6 and Calu-3 cells at a MOI = 0.00001. b-e) Antiviral activity at a MOI = 0.01. (C) Summary of the primary screening of antimalarial compounds against SARS-CoV-2 variants. a) Percentage of inhibition of active compounds against the Delta and A.2.5 variants in Vero-E6 cells. b) Percentage of inhibition of active compounds against the Delta and A.2.5 variants in Calu-3 cells. The black dashed line indicates the 20% viral inhibition threshold considered the selection limit equivalent to three standard deviations from the average inhibition of the DMSO control.
FIGURE 3
FIGURE 3
Antiviral activity of nine selected antimalarial compounds against variants of the SARS-CoV-2 virus. Antiviral activity against the Delta and A.2.5 variants in Vero-E6 cells. Bars indicate the mean viral load of three biological replicates (3X). Those compounds with a mean viral inhibition of ≥30% were selected for further analysis. Blue bars = Delta variant; Red bars = A2.5 variant. Multiple unpaired t-test statistical significance. * = P < 0.05; ** = P < 0.01; *** = P < 0.001; **** = P < 0.0001. ns = not significant. The antiviral activity of the compounds was determined using a qRT-PCR assay to quantify the viral load in infected Vero-E6 cells at a MOI = 0.01 relative to the non-treated controls. Tafenoquine (TQ), Artemisinin-Lumefantrine (ALU).
FIGURE 4
FIGURE 4
Half Maximal Cytotoxic Concentration 50% (CC50) and Half Maximal Inhibitory Concentration 50% (IC50) of selected antimalarial compounds. (a,b))chloroquine (CQ); (c,d) hydroxychloroquine (HCQ); and (e,f) primaquine (PQ) in Vero-E6 cells against the A.2.5 variant of SARS-CoV-2 at a MOI = 0.01. Sigmoidal 4 PL, X is log(Concentration), least square fit.
FIGURE 5
FIGURE 5
Pre- and post-exposure antiviral activity in Vero-E6 cells of chloroquine (CQ) and primaquine (PQ) cells to their IC90, CI 50, and IC10 against SARS-CoV-2 variants isolated in Panama. (a,b) Pre- and post-infection antiviral activity of CQ against the A2.5 and Delta variants; (c,d) Pre- and post-infection antiviral activity of PQ against the A2.5 and Delta variants. Vero-E6 cells were exposed to indicated μM concentrations of CQ and PQ 1 hour before (pre-infection) (blue column) or 1 hour after infection (post-infection) (gray column) with the A2.5 and Delta variants at MOI = 0.01. The dashed line indicates the threshold of 20%, indicative of the selection limit. The black circles indicate the percentage of antiviral activity in each biological replicate. *=p < 0.05. ns = not significant.
FIGURE 6
FIGURE 6
Time of drug addition. Mean viral loads of the A2.5 and Delta variants of SARS-CoV-2 in Vero-E6 cells treated with chloroquine (CQ) (red dots) and primaquine (PQ) (blue squares). (a) A2.5 (b) Delta. CQ (red dots) and PQ (blue squares) were added at 10-fold their IC50 at −1, 0, 3, 5, and 8 h of infection. Viral load = Mean ± SEM copies x 100 µL of supernatants. MOI = 0.01.
FIGURE 7
FIGURE 7
Epifluorescence and Western blot of Vero-E6 cells infected with the SARS-CoV-2 Delta variant. Indirect IFA in Vero-E6 cells infected with the Delta variant of SARS-CoV-2 at a MOI = 0.01 (1.2 × 10⁻⁶ PFU/mL) and incubated for 24 h in a CO2 atmosphere. (A) Epifluorescence images: a) light microscopy, b) DAPI, c) FITC, d) Merge 20X. (B) Merge 40X. Primary Ab against the N protein. Olympus IX73 inverted epifluorescence microscope (Tokyo, Japan). (C) Western blot analysis of Vero-E6 cell extracts infected with the SARS-CoV-2 Delta variant virus at different MOI and infection times. Lane: 1) Cell control. 2) Virus control + DMSO at 24 h of infection MOI 0.01. 3) Virus control + DMSO at 48 h of infection MOI 0.01. 4) Virus control at 48 h of infection MOI 0.00001. The antibody detects the N protein of SARS-CoV-2 at 55 kDa (yellow arrow). 5) Molecular weight markers.

Similar articles

References

    1. Arshad U., Pertinez H., Box H., Tatham L., Rajoli R. K. R., Curley P., et al. (2020). Prioritization of anti-SARS-cov-2 drug repurposing opportunities based on plasma and target site concentrations derived from their established human pharmacokinetics. Clin. Pharmacol. Ther. 108, 775–790. 10.1002/cpt.1909 - DOI - PMC - PubMed
    1. Baer A., Kehn-Hall K. (2014). Viral concentration determination through plaque assays: using traditional and novel overlay systems. J. Vis. Exp., e52065. 10.3791/52065 - DOI - PMC - PubMed
    1. Banerjee S., Banerjee D., Singh A., Kumar S., Pooja D., Ram V., et al. (2023). A clinical insight on new discovered molecules and repurposed drugs for the treatment of COVID-19. Vaccines (Basel) 11, 332. 10.3390/vaccines11020332 - DOI - PMC - PubMed
    1. Bauman J. L., Tisdale J. E. (2020). Chloroquine and hydroxychloroquine in the era of SARS - CoV2: caution on their cardiac toxicity. Pharmacotherapy 40, 387–388. 10.1002/phar.2387 - DOI - PubMed
    1. Bessis D., Trouillet-Assant S., Secco L. P., Bardin N., Blanc B., Blatiere V., et al. (2022). COVID-19 pandemic-associated chilblains: more links for SARS-CoV-2 and less evidence for high interferon type I systemic response. Br. J. Dermatol 187, 1032–1035. 10.1111/bjd.21820 - DOI - PMC - PubMed

LinkOut - more resources