. 2025 Jun 12;16(8):2737-2749.
doi: 10.7150/jca.101892. eCollection 2025.

Stanniocalcin-2 significantly promotes colorectal cancer progression by regulating cancer cell proliferation and invasion

Affiliations

Stanniocalcin-2 significantly promotes colorectal cancer progression by regulating cancer cell proliferation and invasion

Fang Li et al. J Cancer. .

Abstract

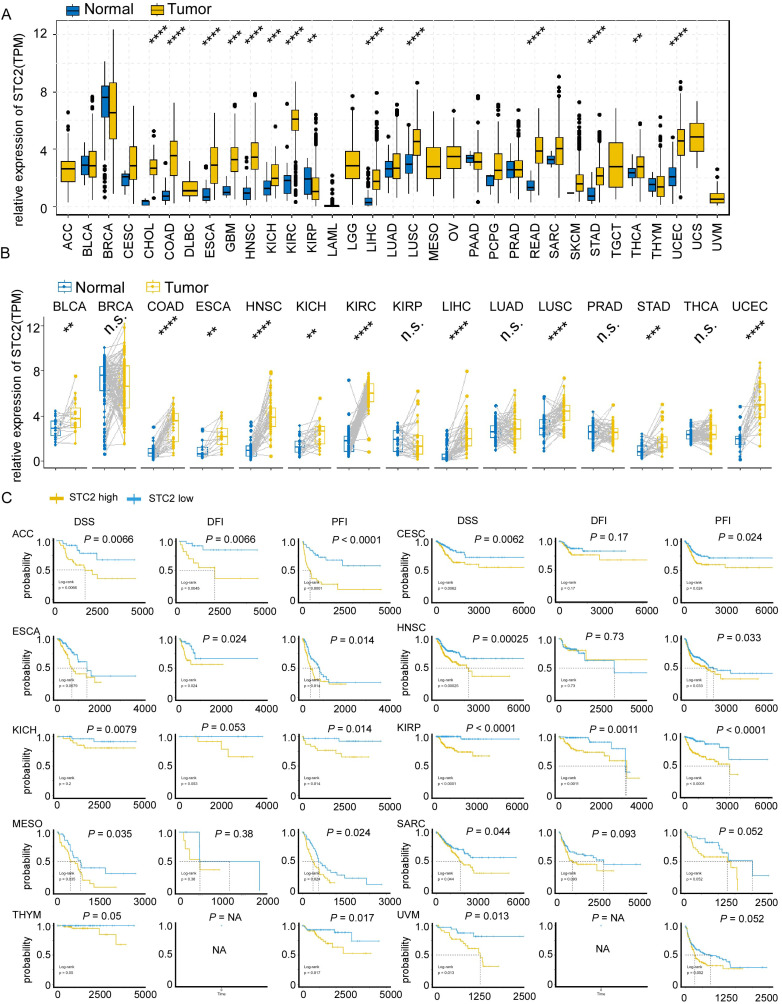
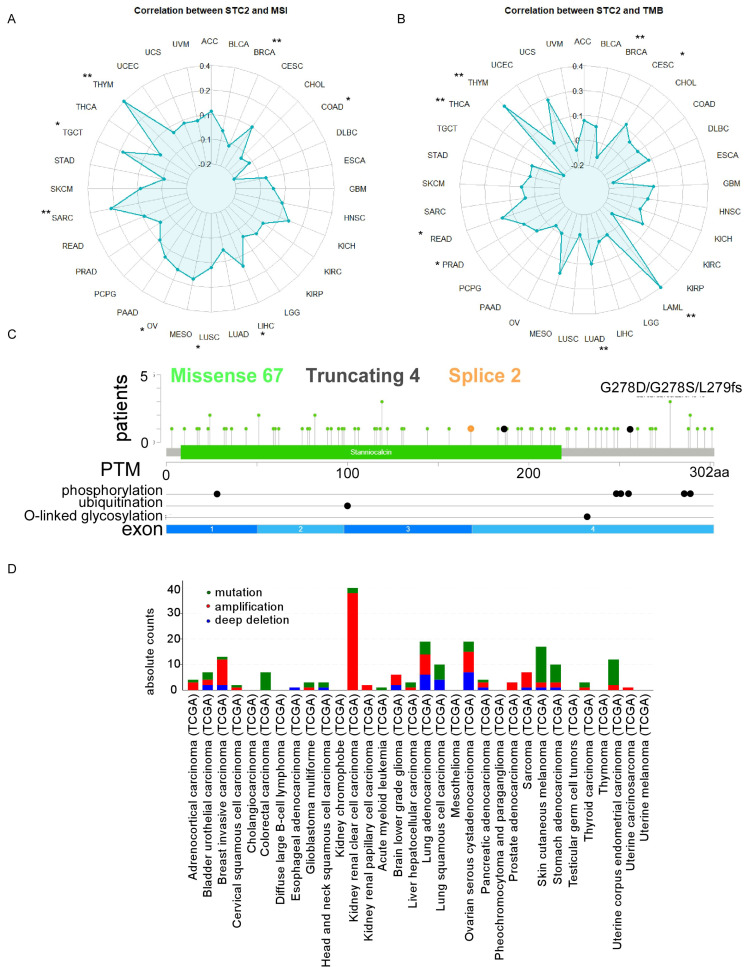
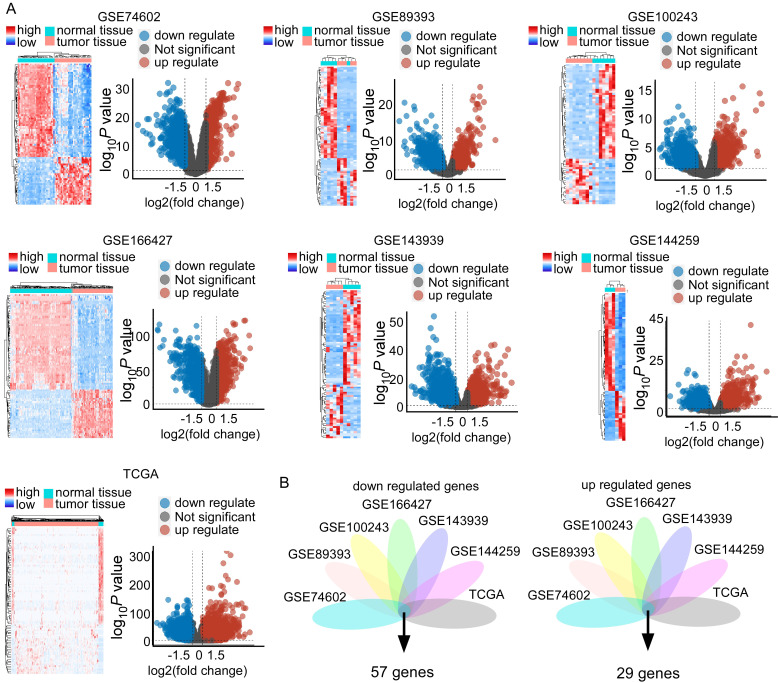
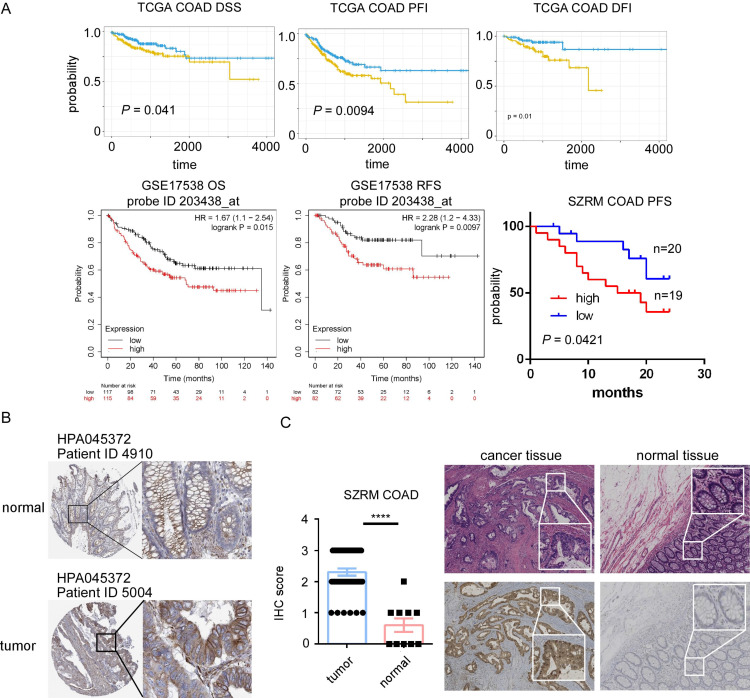
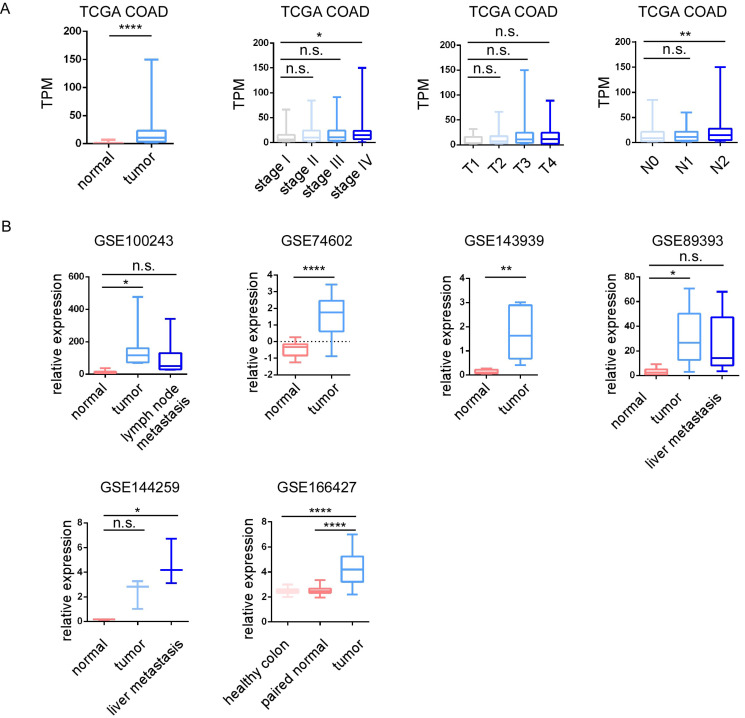
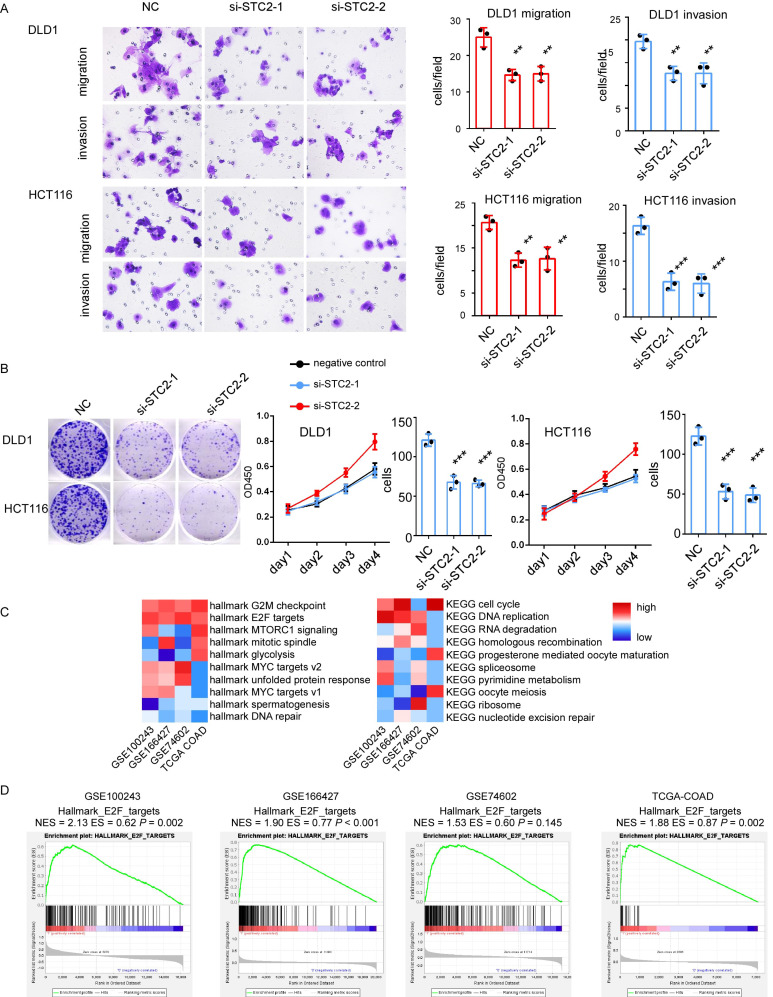
Colorectal cancer (CRC) remains a leading cause of cancer-related mortality worldwide. Our study delves into the molecular intricacies of CRC by analyzing gene expression profiles across multiple datasets, revealing significant gene alterations that distinguish CRC from normal tissues. We identified Stanniocalcin-2 (STC2) as a key regulator in CRC, associated with poor prognosis, survival outcomes and cancer cell proliferation or invasion. Through comprehensive data mining of the Gene Expression Omnibus (GEO), the European Bioinformatics Institute (EMBL-EBI), and The Cancer Genome Atlas (TCGA), we emphasized the role of STC2 in tumorigenesis. Our pan-cancer analysis established STC2's involvement in various cancer types, underscoring its potential as a universal biomarker. Additionally, we performed experimental research and found STC2 is significantly upregulated in CRC tissue and can promote CRC progression by regulating cancer cell invasion and proliferation. This study provides valuable insights into the oncogenic role of STC2, proposing it as a promising target for therapeutic intervention and a marker for aggressive cancer phenotypes.

Keywords: STC2; colorectal cancer; oncogenesis; pan-cancer; tumorigenesis.


Conflict of interest statement

Competing Interests: The authors have declared that no competing interest exists.

Figures

Figure 1
Figure 1
Expression and prognostic significance of STC2 across various cancer types. A. Box plots display the relative expression of STC2 in different cancer types and adjacent normal tissues. B. Box plots display the relative expression of STC2 in cancer tissue and paired adjacent normal tissues. C. Kaplan-Meier survival curves present disease-specific survival (DSS), disease-free interval (DFI), and progression-free interval (PFI), for different types of cancer. (yellow curve for high STC2 and blue curve for low STC2). Abbreviations: adrenocortical cancer (ACC), bladder cancer (BLCA), breast cancer (BRCA), cervical cancer (CESC), cholangiocarcinoma (CHOL), colon cancer (COAD), large B-cell lymphoma (DLBC), esophageal cancer (ESCA), glioblastoma (GBM), head and neck cancer (HNSC), kidney chromophobe cancer (KICH), kidney clear cell carcinoma (KIRC), kidneynpapillary cell carcinoma (KIRP), acute myeloid leukemia (LAML), lower grade glioma (LGG), liver cancer (LIHC), lung adenocarcinoma (LUAD), lung squamous cell carcinoma (LUSC), mesothelioma (MESO), ovarian cancer (OV), pancreatic cancer (PAAD), pheochromocytoma and paraganglioma (PCPG), prostate cancer (PRAD), rectal cancer (READ), sarcoma (SARC), melanoma (SKCM), stomach cancer (STAD), testicular cancer (TGCT), thyroid cancer (THCA), thymoma (THYM), endometrioid cancer (UCEC), uterine carcinosarcoma (UCS), ocular melanomas (UVM). ****, P < 0.0001; ***, P < 0.001; **, P < 0.01; *, P < 0.05; ns: not significant. 'NA' indicates that data for a particular metric was not available for that cancer type.
Figure 2
Figure 2
The impacts of STC2 on mutation and immune landscapes across cancer types. A. Radar charts display the correlation of STC2 expression with microsatellite instability (MSI). B. Radar charts display the correlation of STC2 expression with tumor mutational burden (TMB). C. Lollipop plot detailing the mutation spectrum of the STC2 gene across a cohort of patients. The plot shows the positions and frequency of missense, truncating, and splice site mutations along the STC2 protein, with post-translational modifications and glycosylation sites annotated. D. Bar chart showing the frequency of different types of genomic alterations (mutations, amplifications, and deep deletions) in STC2 across a range of cancer tissues. ****, P < 0.0001; ***, P < 0.001; **, P < 0.01; *, P < 0.05; ns: not significant.
Figure 3
Figure 3
Comparative data mining of differentially expressed gene in colorectal cancer versus non-tumorigenesis tissues indicates STC2 is significantly upregulated across several studies. A. Heatmaps and volcano plots display the expression levels and statistical significance of genes across seven independent datasets (GSE74602, GSE89393, GSE100243, GSE166427, GSE143939, GSE144259, and The Cancer Genome Atlas database). Volcano plots show log2 fold change versus -log10 P value for each gene. B. Venn diagrams illustrate the overlap of downregulated and upregulated genes in tumor tissue compared to normal tissue across the datasets. The central intersection identifies 57 commonly downregulated and 29 commonly upregulated genes.
Figure 4
Figure 4
STC2 involved in tumorigenesis of colorectal cancer (CRC). A. Kaplan-Meier survival curves from the TCGA COAD dataset show high expression of STC2 will predict poor DSS, PFI, and DFI. Survival analysis for overall survival (OS) and relapse-free survival (RFS) in GSE17538, highlighting the relationship between high expression of STC2 (probe ID 203438_at) and poor prognosis. High expression of STC2 associated with poor progression free survival in SZRM cohort (n=39). B. Immunohistochemical of STC2 expression in colorectal cancer tissue and normal colon tissue of HPA database (ID 4910 and ID 5004). C.Represent images of immunohistochemical of STC2 expression in colorectal cancer tissue and normal colon tissue in SZRM institution. The IHC score of STC2 was compared between cancer tissues and adjacent non-tumorigenesis colon tissues. ** P < 0.01, **** P < 0.0001, n.s. not significant).
Figure 5
Figure 5
The relative expression of STC2 in colorectal cancer (CRC). A.The relative expression of STC2 was compared between different tumor stages, T stage, N stage and M stage in TCGA COAD. B. The relative expression of STC2 was compared between different tumor stages, T stage, N stage and M stage in GSE100243, GSE74602, GSE143939, GSE89393, GSE144259 and GSE166427. The relative expression of STC2 was compared between cancer tissues and adjacent non-tumorigenesis colon tissues. ** P < 0.01, **** P < 0.0001, n.s. not significant).
Figure 6
Figure 6
Knockdown of STC2 impacts on colorectal cancer (CRC) cell proliferation, migration and invasion. A. Represent images of migration ability and invasion ability of CRC cell lines DLD1 and HCT116 after STC2 knockdown. Histogram of three independent experiments of migration and invasion assays after STC2 knockdown. B. The proliferation ability of DLD1 and HCT116 determined by the CCK8 assay and colony formation after STC2 knockdown. C. GSEA hallmark and GSEA KEGG pathway enrichment of high STC2 samples in different cohorts. D GSEA hallmark E2F targets of high STC2 samples in different cohorts. n.s., not significant, P > 0.05; * P < 0.05; ** P < 0.01; **** P < 0.0001.

Similar articles

References

    1. Siegel RL, Wagle NS, Cercek A, Smith RA, Jemal A. Colorectal cancer statistics, 2023. CA: a cancer journal for clinicians. 2023;73:233–54. - PubMed
    1. Siegel RL, Miller KD, Wagle NS, Jemal A. Cancer statistics, 2023. Ca Cancer J Clin. 2023;73:17–48. - PubMed
    1. Jeon J, Du M, Schoen RE, Hoffmeister M, Newcomb PA, Berndt SI. et al. Determining risk of colorectal cancer and starting age of screening based on lifestyle, environmental, and genetic factors. Gastroenterology. 2018;154:2152–64. e19. - PMC - PubMed
    1. Keum N, Giovannucci E. Global burden of colorectal cancer: emerging trends, risk factors and prevention strategies. Nature reviews Gastroenterology & hepatology. 2019;16:713–32. - PubMed
    1. Joshi AD. New insights into physiological and pathophysiological functions of stanniocalcin 2. Frontiers in endocrinology. 2020;11:172. - PMC - PubMed

LinkOut - more resources