. 2025 Jun 18;12(6):250094.
doi: 10.1098/rsos.250094. eCollection 2025 Jun.

Interactions between CNS regulation and serotonergic modulation of crayfish hindgut motility

Affiliations

Interactions between CNS regulation and serotonergic modulation of crayfish hindgut motility

Spandan Pathak et al. R Soc Open Sci. .

Abstract

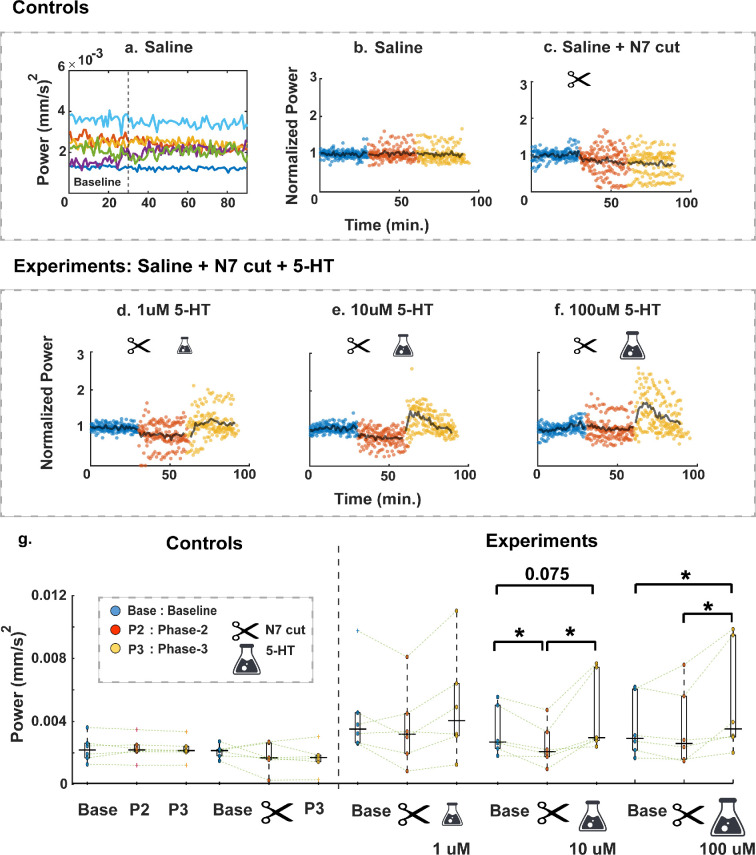
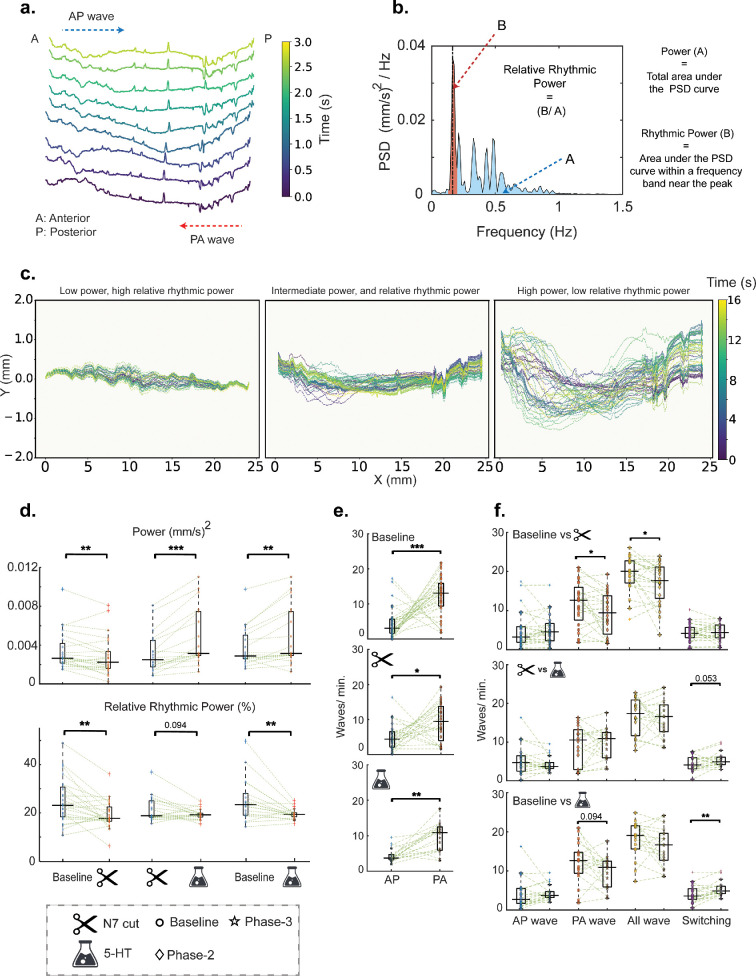
Motility is a critical function of the gastrointestinal (GI) system governed by neurogenic and myogenic processes. Due to its major role in maintaining homeostasis, overlapping mechanisms have evolved for its adaptive operation including modulation by the central nervous system (CNS), enteric nervous system (ENS) and intrinsic pacemaker cells. Our understanding of the modulatory mechanisms that underlie intestinal motility remains incomplete. Crayfish provide a tractable ex vivo model to study the interplay between CNS and neurochemical regulation of GI motor patterns. Our study investigated the effects of CNS denervation and exogenously applied serotonin (5-HT) on crayfish hindgut motility. Multiscale spatial measurements showed stable motility parameters throughout 90 min of control conditions. Denervation, i.e. separating the gut from the CNS, resulted in a significant decrease in the magnitude and synchrony of hindgut contractions, while preserving the underlying frequency and directional bias of the waves. Subsequent application of 5-HT to the denervated preparation enhanced motility but disrupted spatiotemporal coordination. Treatment with TTX (a sodium channel blocker) had minor impacts on motility metrics, indicating a prominent role of myogenic mechanisms. Our model provides a multiscale analysis framework to dissect CNS and interrelated neurochemistry contributions to GI motor dynamics.

Keywords: gut–brain axis; intestinal motility; invertebrate; optical flow; serotonin.


Conflict of interest statement

We declare we have no competing interests.

Figures

Schematic of experimental setup and image analysis workflow
Figure 1.
Schematic of experimental setup and image analysis workflow. (a)The hindgut–nerve cord preparation was dissected from the crayfish abdomen (illustration used with permission [19]). For the 5-HT experiments, a set of 30 individual experiments was collected and analysed from 30 individual animals. Each animal was only used once. The average weights and sizes for each condition (n = 6 per condition) were: saline on intact preparation 17.9 g ± 10.2 g/ 8.2 cm ± 1.4 cm; saline with N7 neurectomy 19.7 g ± 10.1 g/ 8.2 cm ± 1.6 cm; 1 μM 5-HT 16.7 g ± 6.5 g/ 8.0 cm ± 0.9 cm; 10 μM 5-HT 17.0g ± 5.0 g/ 8.0 cm ± 1.0 cm; 100 μM 5-HT 16.5 g ± 8.4 g/ 7.9 cm ± 1.1 cm. Average animal weights and sizes for the TTX experiments were: 14.7 g ± 1.9 g/ 8.1 cm ± 0.3 cm; (b) The ex vivo hindgut–nerve cord preparation was pinned on a sylgard-lined petri dish and video recorded at 10× magnification under three sequential conditions 30 min each) (other than TTX): 1. perfusion of crayfish saline (baseline) on intact preparation; 2. perfusion of crayfish saline on hindgut isolated from CNS by N7 neurectomy; 3. perfusion of crayfish saline (control) or perfusion of 5-HT at 1, 10 or 100 µM. A second control experiment video recorded the intact preparation superfused with saline throughout 90 min. (c) Pixel intensity-based thresholding was used to binarize the movies, extracting the hindgut outline in the process. Optical flow analysis was performed on the temporally smoothed time-lapses to capture movement of the hindgut. Arrow lengths quantify the magnitude of motion at different spatial locations while different directions are represented by colour-coded arrows on a circular map. Finally, all dorsal–ventral (DV) movements (perpendicular to the central axis of the gut) were averaged along the DV axis to obtain mean instantaneous velocities. Their changes in time were captured from the resultant ST plots with blue and red bands indicating periodic DV movement along two directions. Further, motility parameters like wave speed, spatial span and directionality were extracted from the bands. Detailed description of the image analysis pipeline can be found in §2.
Optical flow calculations capture the dynamics of hindgut movement
Figure 2.
Optical flow calculations capture the dynamics of hindgut movement. (a) Demonstration of motion capture workflow from isolated crayfish hindgut movies. Subsequently, a series of timeframes overlaid with optical flow vectors indicate wave-like propagation of local DV movements. (b) DV motility plot depicting different kinds of lateral waves. (c) Representative DV motility plot (saline treatment) for 30 s of gut movement under saline treatment. (Lower gut position values correspond to the anterior end.) The colour axis represents the velocities, with positive and negative values indicating movements towards the ventral and dorsal direction, respectively. (d) Local gut diameter as a function of time for the same gut movie as (c). (e) Power spectral density of the motility plot from (c) averaged along the spatial axis. (f) Identification of lateral gut waves based on instantaneous DV speed and spatial span threshold. Wave speed is calculated using the slope of the extracted wavebands. The colour axis represents the wave velocities with positive values indicating movements from the anterior to the posterior direction (i.e. AP waves). (g) Probability distribution of lateral wave velocities from a saline treatment of 15 min (same movie as (c–f)). (h) Lateral wave velocities of individual waves versus time from (c).
Hindgut movement over experimental runs.
Figure 3.
Hindgut movement over experimental runs (for varying treatments and all repeats). (a,b) Combined power and normalized power versus time for the six controls without denervation (the first 30 min are regarded as the baseline of each experiment). (c) Normalized power versus time for the six saline + N7 cut controls. (d–f) Normalized power versus time for all experimental runs. n = 6 for each of the saline + N7 cut + 5 HT concentrations. Blue, red and yellow correspond to three different phases of an experiment. Each dot represents characteristic power of lateral motion (averaged over 1 min) normalized by the mean baseline power for that experiment. Black lines show the median normalized power tracks across all experiments with similar treatment. The N7 neurectomy and 5-HT application were performed at 30 and 60 min from the start, respectively. (g) Average power during three different phases of an experiment for individual treatments (n = 6). Values for baseline, N7 neurectomy and 5-HT phases taken from the second, second and first 15 min of each phase, respectively. p-values were obtained using Friedman and Wilcoxon’s signed rank test criteria. Boxplot edges indicate the 25th−75th percentiles of the sample data and solid black horizontal lines indicate median values.
Dorsal-ventral motility and lateral waves after denervation, and serotonergic modulation.
Figure 4.
DV motility and lateral waves after denervation, and serotonergic modulation. (a) Depicting the temporal evolution of gut motility patterns over a 3-s window, with colour intensity representing the progression of time. (b) Defining power and relative rhythmic power from a demonstrative PSD curve. (c) Demonstrating representative examples of motility patterns that correspond to different degrees of power and rhythmic power. (d) Boxplots showing variation in total power and relative rhythmic power with different treatments. To test for statistical significance, movies with similar treatments were pooled. For 5-HT experiments, the number of repeats was n = 6 for each condition 1, 10 and 100  μm). Comparisons between baseline and N7 cut included all N7 cut movies (n = 24). Comparisons between N7 cut and 5-HT, as well as Baseline and 5-HT, were conducted using the pooled 5-HT dataset (n = 18). Each dot represents the corresponding power or relative rhythmic power values for the chosen 15-min interval of a unique movie. Relative rhythmic power = area under the PSD at peak frequency ± 0.04 Hz/total power. (e) Number of AP versus PA waves during the three phases of the experiments (baseline, N7 cut and 5-HT), pooling all movies with similar treatments. Sample sizes: Baseline (n = 30), N7 cut (n = 24) and 5-HT (n = 18). (f) Boxplots showing the variation in the number of AP waves, PA waves, total waves and directional switching events across different treatments. For baseline versus N7 cut comparisons, all N7 cut movies were used (n = 24). For both baseline versus 5-HT and N7 cut versus 5-HT comparisons, pooled 5-HT experiment movies were used (n = 18). p-values were obtained using Friedman and Wilcoxon’s signed rank test criteria. Total number of waves = no. of AP waves + no. of PA waves + no. of Mixed waves. Boxes indicate the interpolated 25th−75th percentiles of the sample data, and the horizontal solid black line indicates the median value.
Effects of TTX modulation in hindgut motility metrics (a) Number of spikes recorded during 15 minute time windows [15–30] min, 45−60 min, 105−120 min).
Figure 5.
Effects of TTX modulation on hindgut motility metrics. (a) Number of spikes recorded during 15- min time windows 15–30, 45−60 and 105−120 min). Number of repeats for TTX + saline wash experiments: n = 4. The recordings were performed either in the ANC (abdominal nerve cord) or N7. One experiment was without external stimulation. (b,c) Normalized power versus time for all TTX experimental runs. n = 6 for saline + TTX and n = 5 for saline + TTX + wash. TTX and saline profusion were administered at 30 and 60 min from the start, respectively. (d,e) Boxplots showing variation in total power and relative rhythmic power with TTX experiments. (f) No. of AP versus PA waves during three different phases of the TTX experiments (baseline, TTX, saline wash). (g,h) Boxplots showing variation in the no. of AP, and total waves with TTX treatments. (i,j) Boxplots depicting the number of PA waves, and the number of directional switching events across TTX experiments. Total number of waves = no. of AP waves + no. of PA waves + no. of mixed waves. Boxes indicate the interpolated 25th−75th percentiles of the sample data, and the solid black line indicates the median value.

Similar articles

References

    1. Arendt D, Denes AS, Jékely G, Tessmar-Raible K. 2008. The evolution of nervous system centralization. Phil. Trans. R. Soc. B 363, 1523–1528. ( 10.1098/rstb.2007.2242) - DOI - PMC - PubMed
    1. Spencer NJ, Hu H. 2020. Enteric nervous system: sensory transduction, neural circuits and gastrointestinal motility. Nat. Rev. Gastroenterol. Hepatol. 17, 338–351. ( 10.1038/s41575-020-0271-2) - DOI - PMC - PubMed
    1. Furness JB, Callaghan BP, Rivera LR, Cho HJ. 2014. The enteric nervous system and gastrointestinal innervation: integrated local and central control. In Advances in experimental medicine and biology microbial endocrinology: the microbiota–gut–brain axis in health and disease, pp. 39–71, vol. 817. New York, NY: Springer. ( 10.1007/978-1-4939-0897-4_3) - DOI - PubMed
    1. Camilleri M. 2021. Gastrointestinal motility disorders in neurologic disease. J. Clin. Invest. 131, e143771. ( 10.1172/JCI143771) - DOI - PMC - PubMed
    1. Rao M, Gershon MD. 2016. The bowel and beyond: the enteric nervous system in neurological disorders. Nat. Rev. Gastroenterol. Hepatol. 13, 517–528. ( 10.1038/nrgastro.2016.107) - DOI - PMC - PubMed

LinkOut - more resources