. 2025 Aug;12(29):e15508.
doi: 10.1002/advs.202415508. Epub 2025 Jun 19.

Mesenchymal Stromal Cell Secretome and Its Key Bioactive Metabolites Induce Long-Term Neuroprotection After Traumatic Brain Injury in Mice

Affiliations

Mesenchymal Stromal Cell Secretome and Its Key Bioactive Metabolites Induce Long-Term Neuroprotection After Traumatic Brain Injury in Mice

Francesca Pischiutta et al. Adv Sci (Weinh). 2025 Aug.

Abstract

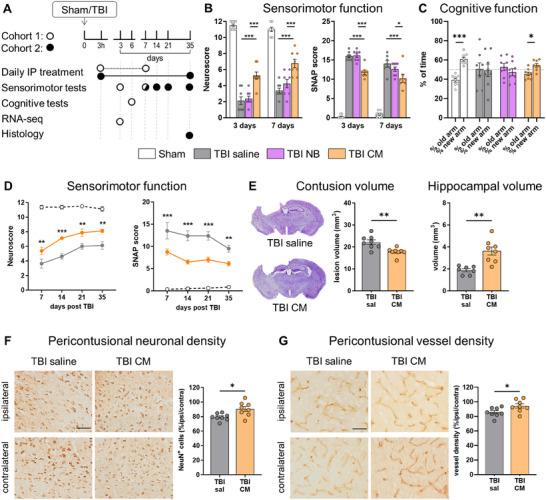
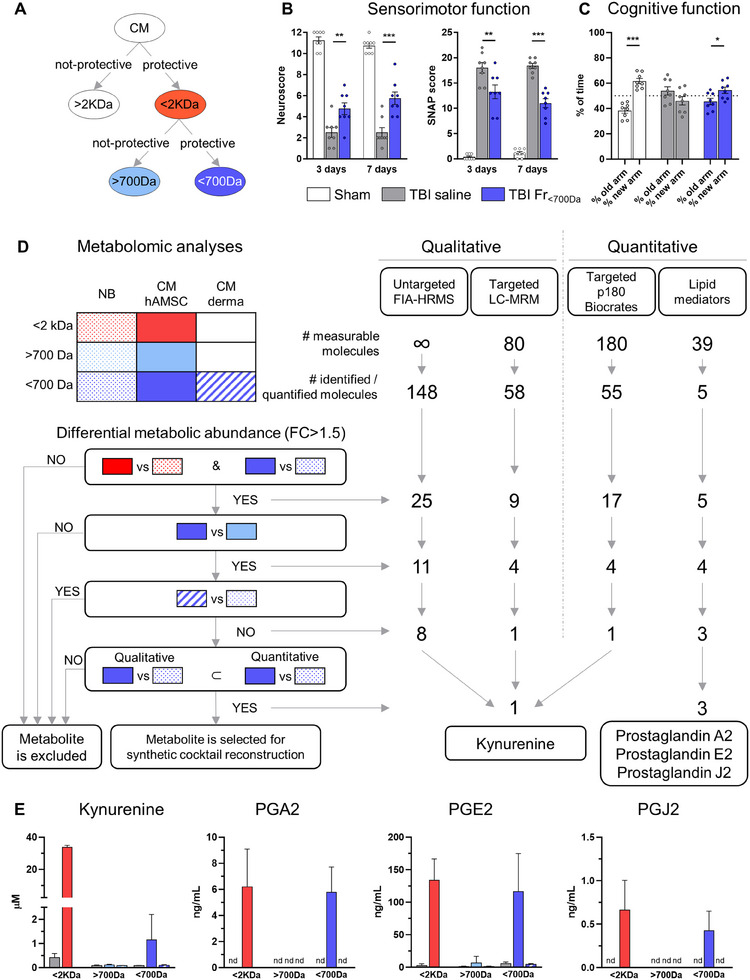
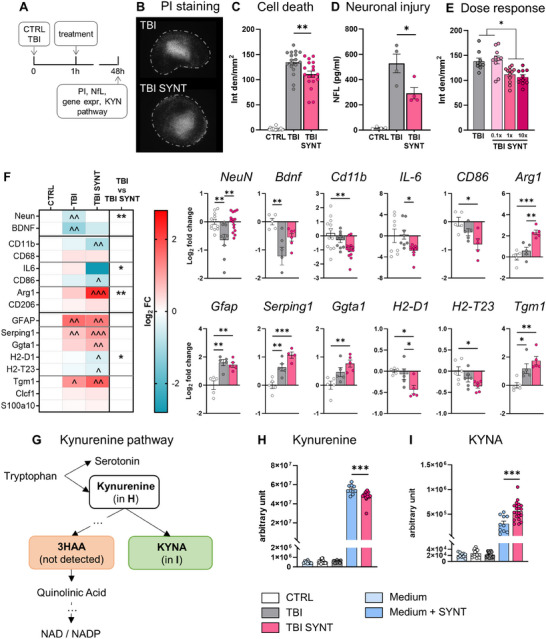
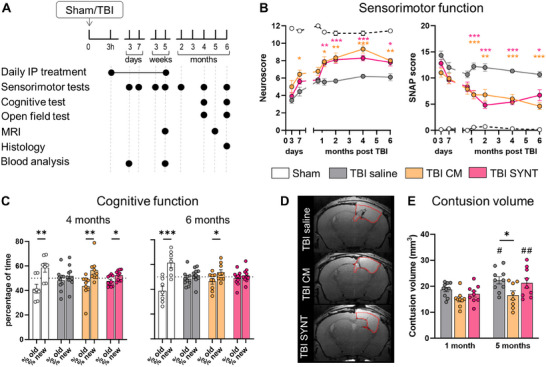
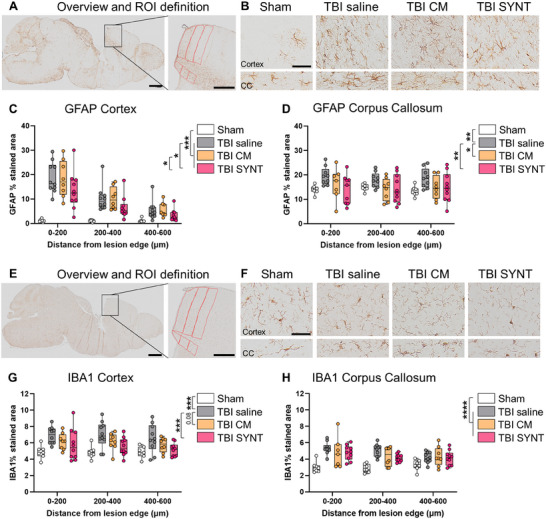
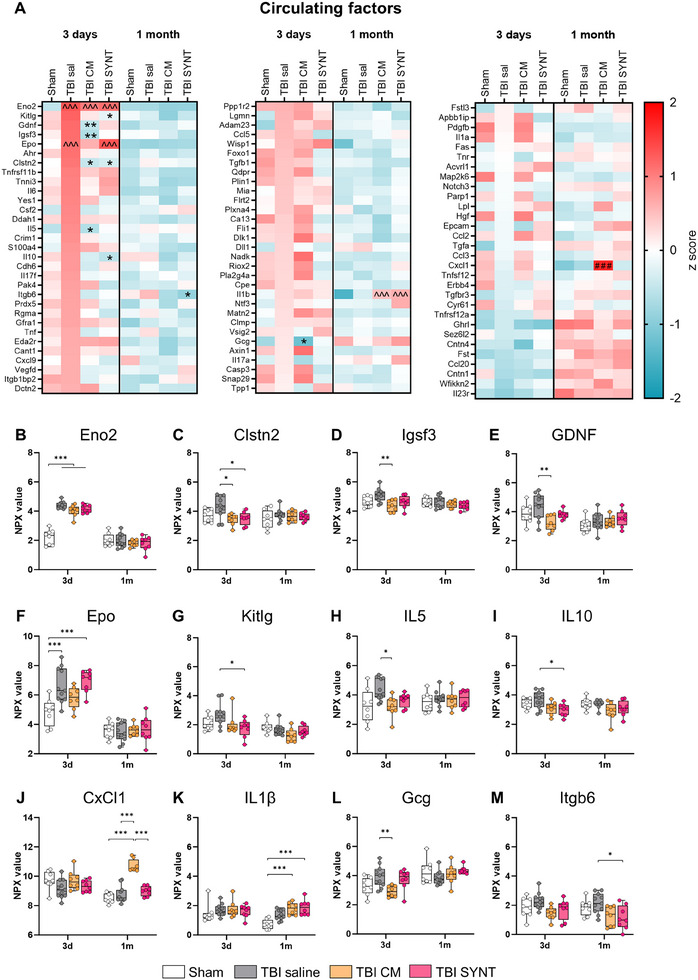
The severe and long-term consequences of traumatic brain injury (TBI) highlight the urgent need for effective neuroprotective therapies. Mesenchymal stromal cells (MSCs) show promise in TBI treatment through their secretome (conditioned media, CM). A low-molecular-weight (<700 Da) CM fraction with neuroprotective effects comparable to total CM after acute brain injury in vitro is previously identified. Here, it is aimed at identifying key bioactive factors, reconstituting them into a synthetic cocktail (SYNT), and evaluating its efficacy in TBI models. Metabolomic profiling identified three prostaglandins and kynurenine, which are used to create SYNT. The SYNT formulation reduced cell death, neuronal damage, and induced protective gene expression changes associated with neuronal protection and microglia modulation toward beneficial phenotype after TBI in vitro. In vivo, SYNT conferred similar long-term functional benefits as CM, improving sensorimotor function up to 6 months and memory preservation at 4 months compared to saline-treated animals, though only CM reduced contusion volume at 5 months. Both treatments modulated neuroinflammation, evidenced by reduced microglial activation and astrogliosis in the pericontusional tissue at 6 months. These findings demonstrate the neuroprotective effects of MSC-secretome treatment in TBI and highlight prostaglandins and kynurenine as key mediators of this response. The findings lay the groundwork for developing a standardized, cell-free therapeutic strategy for TBI based on MSC derivatives.

Keywords: immunomodulation; mesenchymal stromal cells; metabolomics; neuroprotection; secretome; traumatic brain injury.


Conflict of interest statement

The authors declare no conflict of interest.

Figures

Figure 1
Figure 1
CM efficacy in TBI mice. A) Schematic representation of the experimental design of Cohort 1 (white), aimed at defining the specificity of CM protective effects, and Cohort 2 (black), aimed at investigating CM efficacy up to 1‐month post‐injury. B) Sensorimotor assessment at 3‐ and 7‐days post TBI by Neuroscore and Simple Neuroassessment of Asymmetric imPairment (SNAP) of Cohort 1. C) Cognitive assessment at 6 days post TBI by Y maze test of Cohort 1. D) Sensorimotor assessment up to 1‐month post TBI by Neuroscore and SNAP tests of Cohort 2. E) Representative Nissl‐stained coronal sections and quantification of contusion volume and hippocampal volume 1‐month post‐injury (Cohort 2). F) Microphotographs showing NeuN staining in the ipsilateral (pericontusional) and contralateral cortical tissue of TBI saline and TBI CM mice, 1‐month post‐injury (Cohort 2), and relative quantification. G) Microphotographs showing CD31 staining in the ipsilateral (pericontusional) and contralateral cortical tissue of TBI saline and TBI CM mice, 1‐month post‐injury (Cohort 2), and relative quantification. Data are presented as mean ± SEM; n = 7,8 mice/group. B, D) Two‐way ANOVA for repeated measurement, followed by Tukey post‐test. C, E, F, G) t‐test. *p < 0.05, **p < 0.01, ***p < 0.001. Bar = 50 µm.
Figure 2
Figure 2
Efficacy of CM fraction <700 Da in TBI mice and omics analyses. A) Schematic representation of the CM fractions previously found to be protective or non‐protective (>700 Da or CM derma) in an in vitro model of acute brain injury. B) Sensorimotor assessment at 3‐ and 7‐days post TBI by Neuroscore and Simple Neuroassessment of Asymmetric imPairment (SNAP). C) Cognitive assessment at 6 days post TBI by Y maze test. Data are presented as mean ± SEM; n = 8. B) Two‐way ANOVA for repeated measurement, followed by Tukey post‐test. C) t‐test. *p < 0.05, **p < 0.01, ***p < 0.001. D) Schematic of the color codes used for fractions <2 KDa, >700 Da, and <700 Da obtained from NB, CM‐hAMSC, and CM‐derma. Fractions were analyzed by 4 metabolomic analyses: 2 qualitative (FIA‐HRMS and LC‐MRM) and 2 quantitative (p180 Biocrates kit, Lipid mediators). The decision tree illustrates the number of measurable molecules for each technique, the number of identified molecules, and the gerarchic process used to select metabolites for synthetic cocktail reconstruction. FC = fold change of abundance. E) Graphs represent the concentration of the selected metabolites.
Figure 3
Figure 3
Efficacy of synthetic cocktail after TBI in vitro. A) Schematic representation of the experimental design used for the assessment of synthetic cocktail (SYNT) efficacy after TBI in vitro. B) Representative images showing propidium iodide (PI) incorporation 48 h after injury in slices subjected to TBI or TBI + synthetic cocktail. C) Quantification of PI incorporation 48 h after injury. D) Quantification of NfL released in the culture medium at 48 h post‐injury, as an index of neuronal injury. E) Dose response effects using SYNT at concentration 0.1x, 1x, 10x. F) Gene expression analysis of brain slices 48 h post‐injury represented as heat map (left) or as graphs (only for genes with statistical significance, right). Expression of the neuronal marker NeuN, the trophic factor brain‐derived neurotrophic factor (BDNF), the microglial (CD11b, CD68) with pro‐inflammatory M1‐like (IL‐6, CD86) and M2‐like (Arg1, CD206) related markers and the astrocytic (GFAP) with A1‐like (Serping1, Ggta1, H2‐D1, H2‐T23) and A2‐like (Tgm1, Clcf1, S100a10) related markers. G) Simplified illustration of the Kynurenine catabolism with neuroprotective and neurotroxic branches metabolites. H–I) Kynurenine H) and Kynurenic acid (KYNA) I) amounts in unconditioned culture media (Medium), in non‐injured slices (CTR) conditioned media, in TBI slices conditioned media, in medium + SYNT, and in treated TBI slices conditioned media (TBI SYNT). Data are presented as mean ± SEM from at least 2 independent experiments, n = 6–8 each. One‐way ANOVA, followed by Tukey post‐test. *p < 0.05, **p < 0.01, ***p < 0.001.
Figure 4
Figure 4
Chronic effects of CM and SYNT treatments after TBI in vivo. A) Schematic representation of the experimental design of Cohort 4 aimed at defining the long‐term efficacy of CM and the synthetic cocktail in TBI mice. B) Longitudinal sensorimotor assessment up to 6 months post‐injury by Neuroscore and Simple Neuroassessment of Asymmetric imPairment (SNAP). C) Cognitive assessment at 4‐ and 6‐months post TBI by Y maze test. D) Representative images of MRI acquisition with definition of lesion areas. E) Quantification of contusion volume at 1‐ and 5‐months post‐injury. Data are presented as mean ± SEM; n = 8–10 mice/group. B, E) Two‐way ANOVA for repeated measurement, followed by Tukey post‐test. C) t‐test. *p < 0.05, **p < 0.01, ***p < 0.001; #p<0.05, ##p<0.01, 1‐month versus 5‐months post TBI among the same treatment group.
Figure 5
Figure 5
Glial activation 6 months post‐TBI. A) Overview and region of interest (ROI) definition of GFAP staining. B) Microphotographs showing GFAP staining in the pericontusional tissue of TBI saline, TBI CM, and TBI SYNT groups mice, 6‐month post‐injury. C,D) Quantification of GFAP staining in the cortex and in the corpus callosum. E) Overview and ROI definition of IBA1 staining. F) Microphotographs showing IBA1 staining in the pericontusional tissue of TBI saline, TBI CM, and TBI SYNT groups mice, 6‐month post‐injury. G,H) Quantification of GFAP staining in the cortex and in the corpus callosum. Data are presented as median + interquartile range (box) with whiskers showing min and max values n = 8–10. Data are analyzed by Two‐way ANOVA followed by Tukey post‐test (on main effect). *p < 0.05, **p < 0.01, ***p < 0.001. Bar on A–E = 1 mm, inserts = 500 µm, B–F = 50 µm.
Figure 6
Figure 6
Circulating factors at 3 days and 1 month post‐injury. A) Heatmap based on Z‐score values for the 92 measured proteins. B–K) Graphs show the amount (as NPX value) of the circulating proteins differentially expressed among groups. Data are presented as median + interquartile range (box) with whiskers showing min and max values n = 8–10. B–M) Linear random intercept regression, with p‐values adjusted by Benjamini & Hochberg correction for multiple comparisons. A) ^p<0.05, ^^^p<0.001 versus Sham; *p < 0.05, **p < 0.01 versus TBI saline; ### p<0.001 TBI CM versus all other groups.

Similar articles

References

    1. Maas A. I. R., Menon D. K., Manley G. T., Abrams M., Åkerlund C., Andelic N., Aries M., Bashford T., Bell M. J., Bodien Y. G., Brett B. L., Büki A., Chesnut R. M., Citerio G., Clark D., Clasby B., Cooper D. J., Czeiter E., Czosnyka M., Dams‐O'Connor K., De Keyser V., Diaz‐Arrastia R., Ercole A., van Essen T. A., Falvey É., Ferguson A. R., Figaji A., Fitzgerald M., Foreman B., Gantner D., et al., Lancet Neurol. 2022, 21, 1004.
    1. Somayaji M. R., Przekwas A. J., Gupta R. K., Curr. Neuropharmacol. 2018, 16, 484. - PMC - PubMed
    1. Brooks B., Ebedes D., Usmani A., Gonzales‐Portillo J. V., Gonzales‐Portillo D., Borlongan C. V., Cells 2022, 11, 1013. - PMC - PubMed
    1. Norte‐Muñoz M., García‐Bernal D., García‐Ayuso D., Vidal‐Sanz M., Agudo‐Barriuso M., Neural Regener. Res. 2024, 19, 542. - PMC - PubMed
    1. Pischiutta F., Caruso E., Cavaleiro H., Salgado A. J., Loane D. J., Zanier E. R., Exp. Neurol. 2022, 357, 114199. - PubMed

MeSH terms

Substances

LinkOut - more resources