. 2025 Jun;21(6):e70322.
doi: 10.1002/alz.70322.

Down syndrome with Alzheimer's disease brains have increased iron and associated lipid peroxidation consistent with ferroptosis

Affiliations

Down syndrome with Alzheimer's disease brains have increased iron and associated lipid peroxidation consistent with ferroptosis

Max A Thorwald et al. Alzheimers Dement. 2025 Jun.

Abstract

Introduction: Cerebral microbleeds (MBs) are associated with sporadic Alzheimer's disease (AD) and Down syndrome with AD (DSAD). Higher MB iron may cause iron-mediated lipid peroxidation. We hypothesize that amyloid deposition is linked to MB iron and that amyloid precursor protein (APP) triplication increases iron load and lipid peroxidation.

Methods: Prefrontal cortex and cerebellum of cognitively normal control (CTL), AD, and DSAD ApoE3,3 carriers were examined for proteins that mediated iron metabolism, antioxidant response, and amyloid processing in lipid rafts.

Results: Iron was twofold higher in DSAD than in CTL and AD. Iron storage proteins and lipid peroxidation were increased in the prefrontal cortex. The glutathione synthesis protein GCLM was decreased by 50% in both AD and DSAD. Activity of lipid raft GPx4, responsible for membrane repair, was decreased by at least 30% in AD and DSAD.

Discussion: DSAD shows greater lipid peroxidation than AD, consistent with greater MBs and iron load.

Highlights: DSAD has increased ferroptotic-related changes compared to sporadic AD. Lipid rafts that process APP have a loss of protective antioxidant enzymes. Partial and mosaic trisomy lowers the amyloid and iron burden.

Keywords: APP; GCLM; GPx4; GSH; HNE; amyloid; lipid raft; mosaic trisomy; partial trisomy.


Conflict of interest statement

The authors declare no conflicts of interest. Author disclosures are available in the Supporting Information.

Figures

FIGURE 1
FIGURE 1
APP gene dosage is associated with iron and lipid peroxidation in DSAD. Western blots for (A) APP, (B) total iron by ICP‐MS. (C) HNE by dot blot. Data are shown as (RFUs) for Western or dot blots. Statistics by analysis of covariance adjusted for sex with Bonferroni's post hoc test. *p < .05, **p < .01, ***p < .001, ****p < .0001. AD, Alzheimer's disease; APP, amyloid precursor protein; CTL, cognitively normal control; DSAD, Down syndrome with Alzheimer's disease; HNE, 4‐hydroxynonenal; RFUs, relative fluorescent units.
EXTENDED FIGURE 1
EXTENDED FIGURE 1
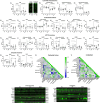
APP gene dosage is associated with iron and lipid peroxidation in DSAD brains. (A) APP, (B) total iron, (C) HNE, (D) α‐hemoglobin, and (E) tissue hemoglobin. (F) Correlation matrix for prefrontal cortex (Ctx) and cerebellum (Cbl). Data are shown as RFUs from Western or dot blots. Statistics by analysis of covariance adjusted for sex with Bonferroni's post hoc test. *p < 0.05, **p < 0.01, ***p < 0.001, ****p < 0.0001. Correlation matrix analyzed by Spearman correlation. 1p < 0.05, 2p < 0.01, 3p < 0.001, 4p < 0.0001. AD, Alzheimer's disease; APP, amyloid precursor protein; CTL, cognitively normal control; DSAD, Down syndrome with Alzheimer's disease; HNE, 4‐hydroxynonenal.
FIGURE 2
FIGURE 2
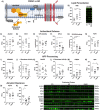
Iron signaling and storage proteins increase with AD. (A) Schema for iron signaling changes (red, increase; gray, no change; blue, decrease) with DSAD versus AD. Western blots are shown as relative fluorescent units for human prefrontal cortex in RIPA lysates for (B) TF, (C) TfR, (D) DMT1, (E) FPN, (F) HCP1, (G) HMOX1, (H) HMOX2, (I) FTL, and (J) FTH1, (K) IRP1, and (L) IRP2. Statistics by analysis of covariance adjusted for sex with Bonferroni's post hoc test. Correlation matrix by Spearman correlation. *p < .05, **p < .01, ***p < .001, ****p < .0001. AD, Alzheimer's Disease; CTL, cognitively normal control; DSAD, Down syndrome with AD; DMT1, divalent metal transporter 1; FPN, ferroportin; FTL, ferritin light chain; FTH1, ferritin heavy chain 1; HCP1, heme carrier protein 1; HMOX, hemeoxygenase; IRP, iron regulatory protein; RFUs, relative fluorescent units; TF, Transferrin; TfR, transferrin receptor.
EXTENDED FIGURE 2
EXTENDED FIGURE 2
Iron signaling and storage proteins increase with AD. Western blots are shown as relative fluorescent units for human prefrontal cortex and cerebellum in RIPA lysates for (A) TF, (B) TfR, (C) DMT1, (D) FPN, (E) HCP1, (F) HMOX1, (G) HMOX2, (H) FTL, (I) FTH1, (J) IRP1, and (K) IRP2. Correlation matrixes for iron signaling proteins for (L) prefrontal cortex and (M) cerebellum. Statistics by analysis of covariance adjusted for sex with Bonferroni's post hoc test. *p < 0.05, **p < .01, ***p < .001, ****p < .0001. Correlation matrix analyzed by Spearman correlation. 1p < 0.05, 2p < 0.01, 3p < 0.001, 4p < 0.0001. AD, Alzheimer's Disease; CTL, cognitively normal control; DSAD, Down syndrome with AD; DMT1, divalent metal transporter 1; FPN, ferroportin; FTH, ferritin heavy; FTL, ferritin light chain; FTH1, ferritin heavy chain 1; HCP1, heme carrier protein 1; HMOX, hemeoxygenase; IRP, iron regulatory protein; RFUs, relative fluorescent units; TF, Transferrin; TfR, transferrin receptor.
FIGURE 3
FIGURE 3
Antioxidant enzymes are selectively altered by DSAD. (A) Schematic representing antioxidant enzyme signaling changes (red increase, gray no change, blue decrease) with DSAD compared to AD. Western blots shown as relative fluorescent units or enzyme activities for human prefrontal cortex measured from RIPA lysates for (B) GPx1, (C) GPx activity, (D) GPx4, (E) Prdx6, (F) PCOOH activity, (G) FSP1, (H) NQO1, (I) GSTA4, (J) ALDH2, (K) SOD1, (L) BACH1, and (M) Nrf2. Statistics by analysis of covariance adjusted for sex with Bonferroni's pos thoc test. *p < .05, **p < .01, ***p < .001, ****p < .0001. AD, Alzheimer's disease; ALDH, aldehyde reductase; ALDH2, aldehyde dehydrogenase 2; BACH1, BTB domain and CNC homology 1; CTL, cognitively normal control; DS, Down Syndrome; DSAD, Down syndrome with AD; FSP1, ferroptosis suppressor protein 1; GPx, glutathione peroxidase; GPx4, glutathione peroxidase 4; GSTA4, glutathione s‐Transferase A4; NQO1, NADPH quinone oxidoreductase 1; Nrf2, nuclear factor erythroid 2‐related factor 2; PCOOH, phospholipid hydroperoxides; Prdx, peroxiredoxin; Prdx6, peroxiredoxin 6; RFUs, relative fluorescent units; SOD1, superoxide dismutase 1.
EXTENDED FIGURE 3
EXTENDED FIGURE 3
Antioxidant enzymes are altered by DSAD. Western blots shown as relative fluorescent units or enzyme activities for human prefrontal cortex and cerebellum measured from RIPA lysates for (A) GPx1, (B) GPx activity, (C) GPx4, (D) Prdx6, (E) PCOOH activity, (F) FSP1, (G) NQO1, (H) GSTA4, (I) ALDH2, (J) SOD1, (K) BACH1, and (L) Nrf2. Correlation matrix of ferroptosis‐related antioxidant enzymes for (M) prefrontal cortex and (N) cerebellum. Statistics by analysis of covariance adjusted for sex with Bonferroni's post hoc test. Correlation matrix analyzed by Spearman correlation. *p < .05, **p < .01, ***p < .001, ****p < .0001. AD, Alzheimer's disease; ALDH, aldehyde reductase; ALDH2, aldehyde dehydrogenase 2; BACH1, BTB domain and CNC homology 1; CTL, cognitively normal control; DS, Down Syndrome; DSAD, Down syndrome with AD; FSP1, ferroptosis suppressor protein 1; GPx, glutathione peroxidase; GPx4, glutathione peroxidase 4; GSTA4, glutathione s‐Transferase A4; NQO1, NADPH quinone oxidoreductase 1; Nrf2, nuclear factor erythroid 2‐related factor 2; PCOOH, phospholipid hydroperoxides; Prdx, peroxiredoxin; Prdx6, peroxiredoxin 6; RFUs, relative fluorescent units; SOD1, superoxide dismutase 1.
FIGURE 4
FIGURE 4
Decreased glutathione‐producing enzyme GCLM with AD and DSAD. (A) Proteins involved in the import of cystine, synthesis, and reduction of GSH. Western blots are shown as relative fluorescent units for (B) xCT, (C) LAT1, (D) GCLC, (E) GCLM, (F) GSS, (G) GSR, (H) G6PD, and (I) PGD in prefrontal cortex. Statistics by analysis of covariance adjusted for sex with Bonferroni's posthoc test. *p < 0.05, ***p < 0.001. AD, Alzheimer's disease; CTL, cognitively normal control; DS, Down Syndrome; DSAD, Down syndrome with AD; G6PD, glucose‐6‐phosphate dehydrogenase; GCLC, glutathione cysteine ligase catalytic; GCLM, glutathione cysteine ligase modifier; GSS, glutathione synthetase; GSH, glutathione; LAT1, L‐type amino acid transporter 1; PGD, Phosphogluconate dehydrogenase; RFUs, relative fluorescent units; xCT, cystine/glutamate antiporter.
EXTENDED FIGURE 4
EXTENDED FIGURE 4
Loss of GCLM is consistent with AD and DSAD. (A) Proteins involved in the import of cystine, synthesis, and reduction of GSH. Western blots are shown as relative fluorescent units for (B) xCT, (C) LAT1, (D) GCLC, (E) GCLM, (F) GSS, (G) GSR, (H) G6PD, and (I) PGD in prefrontal cortex. (J) Representative images from Western blots. Statistics by analysis of covariance adjusted for sex with Bonferroni's post hoc test. *p < .05, **p < .01, ***p < .001. AD, Alzheimer's disease; CTL, cognitively normal control; DS, Down Syndrome; DSAD, Down syndrome with AD; G6PD, glucose‐6‐phosphate dehydrogenase; GCLC, glutathione cysteine ligase catalytic; GCLM, glutathione cysteine ligase modifier; GSS, glutathione synthetase; GSH, glutathione; LAT1, L‐type amino acid transporter 1; PGD, Phosphogluconate dehydrogenase; RFUs, relative fluorescent units; xCT, cystine/glutamate antiporter.
FIGURE 5
FIGURE 5
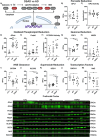
APP processing, clearance, and peptides in DSAD and AD. (A) Differences in amyloid processing in DSAD compared to AD. Western blots are shown as relative fluorescent units for human prefrontal cortex measured from RIPA lysates for (B) ADAM10, (C) BACE1, (D) PSEN1, (E) ApoE, and (F) LRP1. Dot blots for soluble (G) Aβ40, (H) Aβ42, insoluble (I) Aβ40, (J) Aβ42, and (K) fibrillar amyloid. Statistics by ANCOVA adjusted for sex with Bonferroni's posthoc test. *p < 0.05, **p < 0.01, ***p < 0.001. ADAM10, A Disintegrin and metalloproteinase domain‐containing protein 10; AD, Alzheimer's Disease; ApoE, apolipoprotein E; APP, amyloid precursor protein; BACE1, beta‐site amyloid precursor protein cleaving enzyme 1; CTL, cognitively normal control; DSAD, Down Syndrome with AD; LRP1, low‐density receptor; PSEN1, presenilin 1; RFUs, relative fluorescent units.
EXTENDED FIGURE 5
EXTENDED FIGURE 5
Amyloid processing, clearance, and peptides in DSAD and AD. Western blots are shown as RFUs for human prefrontal cortex and cerebellum measured from RIPA lysates for (A) ADAM10, (B) BACE1, (C) PSEN1, (D) ApoE, and (E) LRP1. Dot blots for soluble (F) Aβ40, G) Aβ42, insoluble (H) Aβ40, (I) Aβ42, and (J) fibrillar amyloid. Correlation matrices for amyloid‐related proteins for (K) prefrontal cortex and (L) cerebellum. Statistics by analysis of covariance adjusted for sex with Bonferroni's post hoc test. Correlation matrix analyzed by Spearman correlation. *p < .05, **p < .01, ***p < .001. ADAM10, A Disintegrin and metalloproteinase domain‐containing protein 10; AD, Alzheimer's Disease; ApoE, apolipoprotein E; APP, amyloid precursor protein; BACE1, beta‐site amyloid precursor protein cleaving enzyme 1; CTL, cognitively normal control; DSAD, Down Syndrome with AD; LRP1, low‐density receptor; PSEN1, presenilin 1; RFUs, relative fluorescent units.
FIGURE 6
FIGURE 6
LR subcellular fraction in DSAD prefrontal cortex has increased oxidative damage and reduced antioxidant enzyme defense. (A) Schematic representation of LR changes in DSAD compared to AD. Western or dot blots shown as relative fluorescent units, or enzyme activities from LR lysates for (B) HNE, (C) ALDH2, (D) GPx1, (E) GPx activity, (F) GPx4, (G) PCOOH activity, (H) FSP1, (I) ADAM10, (J) α‐secretase activity, (K) BACE1, (L) β‐secretase activity, (M) PSEN1, (N) APP, (O) ApoE, and (P) LRP1. Statistics by analysis of covariance adjusted for sex with Bonferroni's post hoc test. *p < .05, **p < .01, ***p < .001. AD, Alzheimer's disease; ALDH2, aldehyde dehydrogenase 2; ApoE, apolipoprotein E; APP, amyloid precursor protein; CTL, cognitively normal control; DSAD, Down syndrome with AD; FSP1, ferroptosis suppressor protein 1; GPx, glutathione peroxidase; HNE, 4‐hydroxynonenal; LR, lipid raft; LRP1, low‐density lipoprotein receptor 1; PSEN1, presenilin 1; RFU, relative fluorescent unit; RFUs, relative fluorescent units.
EXTENDED FIGURE 6
EXTENDED FIGURE 6
LR subcellular fraction in DSAD prefrontal cortex has increased oxidative damage and reduced antioxidant enzyme defense. Western or dot blots are shown as RFUs or enzyme activities for human prefrontal cortex or cerebellum from LR lysates for (A) HNE, (B) yield, (C) cholesterol, (D) total protein, (E) ALDH2, (F) GPx1, (G) GPx activity, (H) GPx4, (I) PCOOH activity, (J) FSP1, (K) ADAM10, (L) α‐secretase activity, (M) BACE1, (N) β‐secretase activity, (O) PSEN1, (P) APP, (Q) ApoE, and (R) LRP1. Correlation matrix of ferroptosis‐related antioxidant enzymes for (S) prefrontal cortex and (T) cerebellum. Statistics by analysis of covariance adjusted for sex with Bonferroni's post hoc test. *p < .05, **p < .01, ***p < .001. Correlation matrix analyzed by Spearman correlation. 1p < 0.05, 2p < 0.01, 3p < 0.001, 4p < 0.0001. AD, Alzheimer's disease; ALDH2, aldehyde dehydrogenase 2; ApoE, apolipoprotein E; APP, amyloid precursor protein; CTL, cognitively normal control; DS, ALDH, aldehyde reductase; DSAD, Down Syndrome with AD; FSP1, ferroptosis suppressor protein 1; GPx, glutathione peroxidase; GPx4, glutathione peroxidase 4; HNE, 4‐hydroxynonenal; LR, lipid raft; LRP1, low‐density receptor; PSEN1, presenilin 1; RFU, relative fluorescent unit; RFUs, relative fluorescent units.
FIGURE 7
FIGURE 7
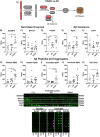
APP gene dosage and MB iron. Levels of (A) total iron, (B) tissue hemoglobin, (C) coplot of total iron and tissue hemoglobin, dot blot shown as relative fluorescent units for (D) Aβ fibrils and (E) age of death for DSAD, mosaic T21, and partial T21 cases. One additional age of death was added for pT21 without APP triplication. Statistics by analysis of covariance adjusted for sex with Bonferroni's post hoc test (E) or two‐tailed t‐test (A, B, D) or  coplot by Pearson correlation. *p < .05, **p < .01. APP, amyloid precursor protein; CTL, cognitively normal control; DSAD, Down syndrome with Alzheimer's disease; FTH1, ferritin heavy chain 1; GCLM, glutathione cysteine ligase modifier; RFUs, relative fluorescent units.
EXTENDED FIGURE 7
EXTENDED FIGURE 7
APP gene dosage and microbleed iron. Levels of (A) total iron, (B) tissue hemoglobin, (C) coplot of total iron and tissue hemoglobin. Western blots are shown as relative fluorescent units for (D) FTH1 and (E) GCLM. Statistics by analysis of covariance adjusted for sex with Bonferroni's post hoc test (A and B) or two‐tailed t‐test (D and E) or coplot by Pearson correlation. *p < .05, **p < .01. APP, amyloid precursor protein; CTL, cognitively normal control; DSAD, Down syndrome with Alzheimer's disease; FTH1, ferritin heavy chain 1; GCLM, glutathione cysteine ligase modifier; RFUs, relative fluorescent units.

Update of

Similar articles

  • Down syndrome with Alzheimer's disease brains have increased iron and associated lipid peroxidation consistent with ferroptosis.
    Thorwald MA, Godoy-Lugo JA, Kerstiens E, Garcia G, Kim M, Shemtov SJ, Silva J, Durra S, O'Day PA, Mack WJ, Hiniker A, Vermulst M, Benayoun BA, Higuchi-Sanabria R, Forman HJ, Head E, Finch CE. Thorwald MA, et al. bioRxiv [Preprint]. 2025 Feb 6:2025.02.05.636731. doi: 10.1101/2025.02.05.636731. bioRxiv. 2025. Update in: Alzheimers Dement. 2025 Jun;21(6):e70322. doi: 10.1002/alz.70322. PMID: 39975068 Free PMC article. Updated. Preprint.
  • Amyloid-β peptide signature associated with cerebral amyloid angiopathy in familial Alzheimer's disease with APPdup and Down syndrome.
    Kasri A, Camporesi E, Gkanatsiou E, Boluda S, Brinkmalm G, Stimmer L, Ge J, Hanrieder J, Villain N, Duyckaerts C, Vermeiren Y, Pape SE, Nicolas G, Laquerrière A, De Deyn PP, Wallon D, Blennow K, Strydom A, Zetterberg H, Potier MC. Kasri A, et al. Acta Neuropathol. 2024 Jul 18;148(1):8. doi: 10.1007/s00401-024-02756-4. Acta Neuropathol. 2024. PMID: 39026031 Free PMC article.
  • Apolipoprotein E abundance is elevated in the brains of individuals with Down syndrome-Alzheimer's disease.
    Farrell C, Buhidma Y, Mumford P, Heywood WE, Hällqvist J, Flores-Aguilar L, Andrews EJ, Rahimzadah N, Taso OS, Doran E, Swarup V, Head E, Lashley T, Mills K, Toomey CE, Wiseman FK. Farrell C, et al. Acta Neuropathol. 2025 May 19;149(1):49. doi: 10.1007/s00401-025-02889-0. Acta Neuropathol. 2025. PMID: 40387921 Free PMC article.
  • Resistance and resilience to Alzheimer's disease in Down syndrome.
    Boyle R, Koops EA, Ances B, Andrews EJ, Arenaza-Urquijo EM, Bejanin A, Brickman AM, Buckley RF, Clas GS, Costello E, Coughlan GT, Conley AC, Deng F, de Paula Faria D, Edwards N, Flores-Aguilar L, Fortea J, Ghazi Saidi L, Head E, Hom CL, Koenig K, Lao P, Lengyel I, Li YJ, Loi S, Loughrey D, McGlinchey E, Newhouse P, Pertierra L, Prokopiou PC, Qi Q, de Paula França Resende E, Russell J, Scanlon CE, Schneider C, Schultz SA, Seto M, Shaka S, Soldan A, Vaqué Alcázar L, Weng Y, Wilson JE, Zaman SH, Zsadányi SE, Hartley S. Boyle R, et al. Alzheimers Dement. 2025 Apr;21(4):e70151. doi: 10.1002/alz.70151. Alzheimers Dement. 2025. PMID: 40289889 Free PMC article. Review.
  • Genetically determined Alzheimer's disease research advances: The Down Syndrome & Autosomal Dominant Alzheimer's Disease 2024 Conference.
    Falgàs N, Maure-Blesa L, Ances B, Flores-Aguilar L, Hartley S, Hassenstab J, Iulita MF, Janicki M, Koenig K, Lao P, Levin J, McDade E, Meijer L, Rafii MS, Snyder HM, Sánchez-Valle R, Fortea J; DSAD‐ADAD conference group; Arriola Infante J, Balasa M, Barroeta I, Barthelemy R N, Bejanin A, Benejam B, Bosch B, Bradshaw A, Carmona-Iragui M, Cohen A, Comas Albertí A, Csincsik L, Cuello AC, Del Hoyo Soriano L, Dijkstra J, Edwards N, Giménez S, Gonzalez-Ortiz F, Gordon B, Gutiérrez Fernández S, Handen B, Jacob C, Johnson E, Johansson C, Lladó A, Lleó A, Morabito S, Morcillo-Nieto AO, Montoliu-Gaya L, Okafor M, Pérez-Millan A, Potier MC, Ringman J, Rodríguez-Baz Í, Rubenstein E, Ryan NS, Strydom A, Vaqué-Alcázar L, Vermunt L, Videla Toro L, Zaman S. Falgàs N, et al. Alzheimers Dement. 2025 Jul;21(7):e70309. doi: 10.1002/alz.70309. Alzheimers Dement. 2025. PMID: 40604347 Free PMC article. Review.

Cited by

References

    1. Maure‐Blesa L, Rodríguez‐Baz I, Carmona‐Iragui M, Fortea J. What can we learn about Alzheimer's Disease from people with Down Syndrome?. Curr Top Behav Neurosci. 2025;69:197‐226. doi: 10.1007/7854_2024_546 - DOI - PubMed
    1. Sasmita AO, Depp C, Nazarenko T, et al. Oligodendrocytes produce amyloid‐β and contribute to plaque formation alongside neurons in Alzheimer's disease model mice. Nat Neurosci. 2024;27:1668‐1674. doi: 10.1038/s41593-024-01730-3 - DOI - PMC - PubMed
    1. Rajani RM, Ellingford R, Hellmuth M, et al. Selective suppression of oligodendrocyte‐derived amyloid beta rescues neuronal dysfunction in Alzheimer's disease. PLOS Biology. 2024;22:e3002727. doi: 10.1371/journal.pbio.3002727 - DOI - PMC - PubMed
    1. Zhao J, O'Connor T, Vassar R. The contribution of activated astrocytes to Aβ production: implications for Alzheimer's disease pathogenesis. J. Neuroinflammation. 2011;8:150. doi: 10.1186/1742-2094-8-150 - DOI - PMC - PubMed
    1. Fukumoto H, Rosene DL, Moss MB, Raju S, Hyman BT, Irizarry MC. β‐Secretase Activity Increases with Aging in Human, Monkey, and Mouse Brain. Am J Pathol. 2004;164:719‐725. - PMC - PubMed

MeSH terms