. 2025 Dec;14(1):2517583.
doi: 10.1080/21623945.2025.2517583. Epub 2025 Jun 19.

A nomogram based on radiomic features from peri-prostatic adipose tissue for predicting bone metastasis in first-time diagnosed prostate cancer patients

Affiliations

A nomogram based on radiomic features from peri-prostatic adipose tissue for predicting bone metastasis in first-time diagnosed prostate cancer patients

Bohao Liu et al. Adipocyte. 2025 Dec.

Abstract

Purpose: To evaluate a radiomics-based nomogram using peri-prostatic adipose tissue (PPAT) features for predicting bone metastasis (BM) in newly diagnosed prostate cancer (PCa) patients.

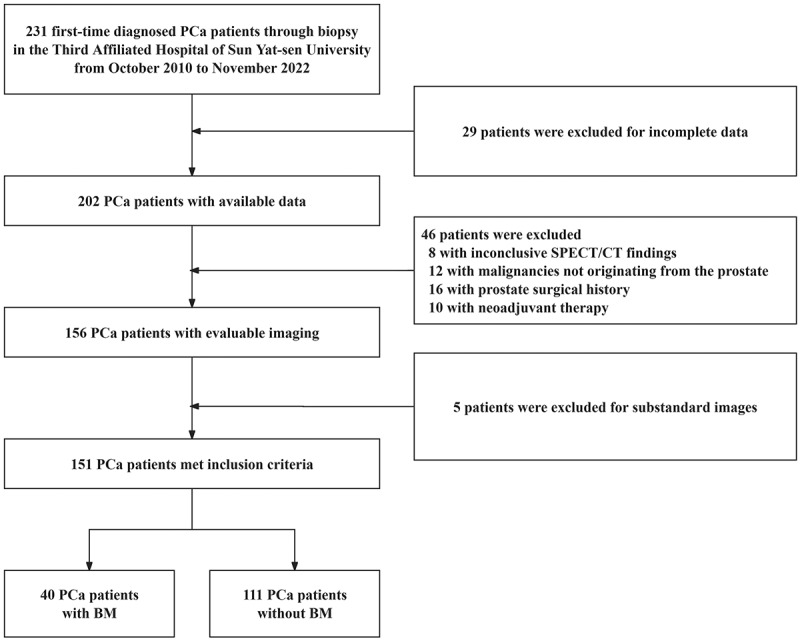
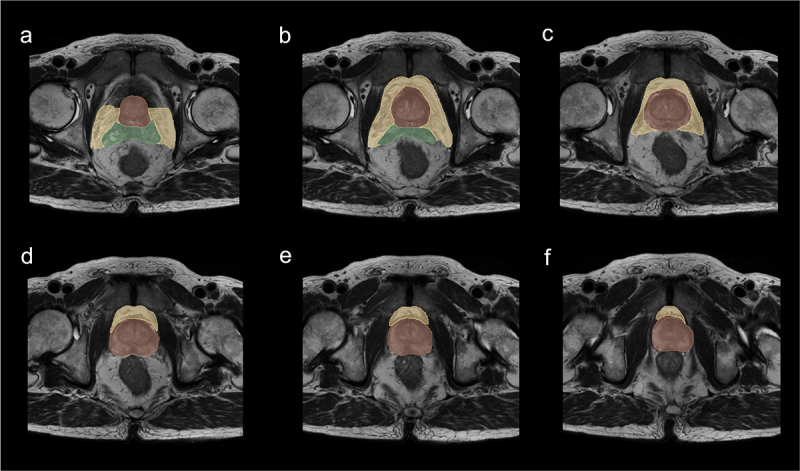
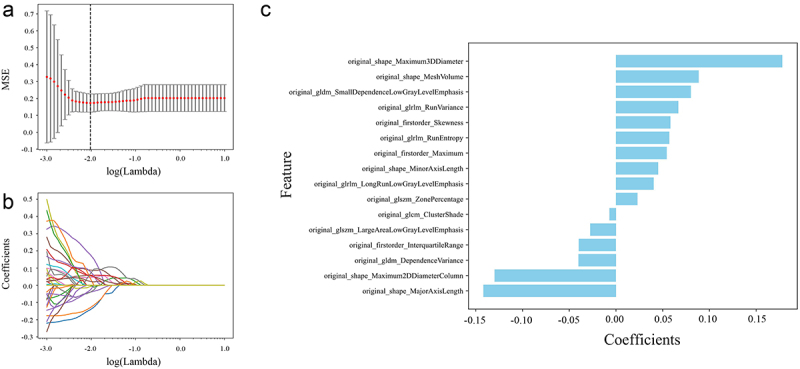
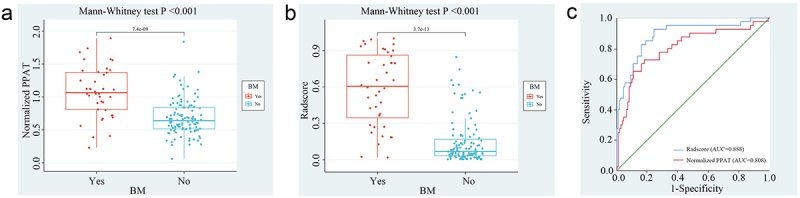
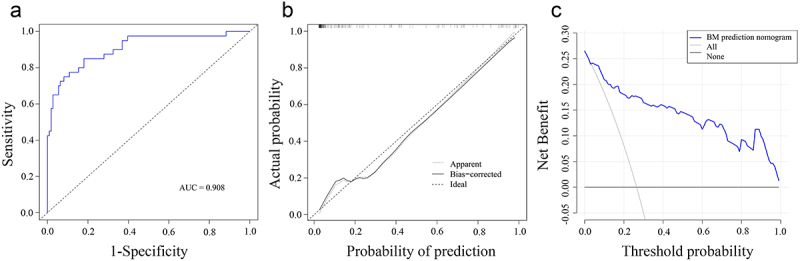
Methods: A retrospective study of 151 PCa patients (October 2010-November 2022) was conducted. Radiomic features were extracted from axial T2-weighted MRI of PPAT, and normalized PPAT was calculated as the ratio of PPAT volume to prostate volume. A radiomics score (Radscore) was developed using logistic regression with 16 features selected via LASSO regression. Independent predictors identified through univariate and multivariate logistic regression were used to construct a nomogram. Predictive performance was assessed using ROC curves, and internal validation involved 1000 bootstrapped iterations.

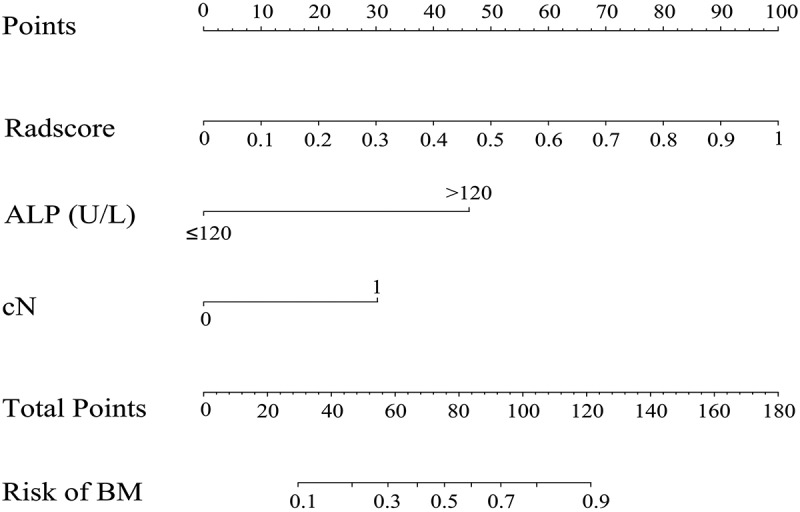
Results: The Radscore, based on 16 features, showed significant association with BM and outperformed normalized PPAT in predictive value. Independent predictors of BM included Radscore, alkaline phosphatase (ALP), and clinical N stage (cN). A nomogram integrating these factors demonstrated strong discrimination (C-index: 0.908; 95% CI: 0.851-0.966) and calibration, with consistent results in validation (C-index: 0.903; 95% CI: 0.897-0.916). Decision curve analysis confirmed its clinical utility.

Conclusions: Radscore, cN, and ALP were identified as independent BM predictors. The developed nomogram enables accurate risk stratification and personalized BM predictions for newly diagnosed PCa patients.

Keywords: MRI; Prostate cancer; bone metastasis; peri-prostatic adipose tissue; radiomics.


Conflict of interest statement

No potential conflict of interest was reported by the author(s).

Figures

Flowchart illustrating patient selection process, showing inclusion and exclusion criteria for prostate cancer patients with and without bone metastasis.
Figure 1.
Patient selection and exclusion. PCa: prostate cancer; BM: bone metastasis.
Six axial T2-weighted MRI images (a-f) showing segmentation of prostate (red), seminal vesicles (green), and peri-prostatic adipose tissue (yellow) from base to apex of prostate gland.
Figure 2.
Segmentation of the prostate, peri-prostatic adipose tissue, and seminal vesicles.
Three-panel figure showing LASSO regression analysis: a) MSE versus log(Lambda) plot with optimal lambda (0.0095) marked by vertical line; b) Coefficient profiles showing 16 radiomic features with non-zero coefficients; c) Bar graph displaying contribution of selected features to Radscore with regression coefficients.
Figure 3.
Features selection using the LASSO regression. (a) Selection of the tuning parameter lambda in the LASSO model was conducted using tenfold cross-validation based on the minimum criteria. The mean-squared error (MSE) obtained from the LASSO regression cross-validation procedure was plotted against the logarithm of lambda. The Y-axis indicates the MSE. The X-axis indicates the log(Lambda). Red dots represent the average MSE values corresponding to each model at a given lambda, and vertical bars through the red dots show the upper and lower values of the MSE. The dotted vertical black lines defined the optimal value of lambda (0.0095). (b) The coefficient profiles of radiomic features from the LASSO model are shown, highlighting the 16 features with non-zero coefficients. (c) Contribution of the selected features to the Radscore, along with their corresponding regression coefficients.
Three-panel figure: a-b) Box plots comparing normalized PPAT and Radscore between bone metastasis and non-bone metastasis groups, showing significantly higher values in BM group; c) ROC curves with AUC values for Radscore and normalized PPAT in predicting bone metastasis.
Figure 4.
Comparison of normalized PPAT and Radscore. (b) Box plots of normalized PPAT and Radscore. Normalized PPAT and Radscore in BM group were significantly higher than non-BM (p < 0.001). (c) ROC curves of Radscore and normalized PPAT for the prediction of BM. The AUC of ROC curves were showed.
Clinical nomogram predicting bone metastasis probability in newly diagnosed prostate cancer patients, with point scales for individual predictors, total points scale, and corresponding risk probability scale.
Figure 5.
Nomogram to predict BM in first diagnosed PCa patients. Nomogram based on predictors for BM. By drawing a vertical line upward to the point axis, each factor corresponds to a specific point value. The total points are summed along the total points axis, and the probability of BM is determined by drawing a straight line downward to the risk axis.
Three-panel validation figure: a) ROC curve showing AUC for nomogram prediction of bone metastasis; b) Calibration curve comparing predicted versus actual probability with ideal line (dotted) and nomogram performance (solid); c) Decision curve analysis showing net benefit of nomogram (blue) versus treat-all or treat-none approaches.
Figure 6.
ROC, calibration and decision curves of the nomogram. (a) ROC curve of the nomogram for predicting BM. The AUC of ROC curves were shown. (b) Calibration curves of the nomogram prediction. The X-axis represents the predicted probability, while the Y-axis represents the actual probability. The diagonal dotted line indicates the ideal model’s perfect prediction, and the solid line reflects the performance of the nomogram. (c) Decision curve analysis of the nomogram prediction. The Y-axis measures the net benefit. The blue line represents the nomogram, while the black and thin grey lines illustrate the scenarios in which all patients have BM and no patients have BM, respectively.

Similar articles

References

    1. Miller KD, Nogueira L, Devasia T, et al. Cancer treatment and survivorship statistics, 2022. CA Cancer J Clin. 2022;72(5):409–11. doi: 10.3322/caac.21731 - DOI - PubMed
    1. Baldessari C, Pipitone S, Molinaro E, et al. Bone metastases and health in prostate cancer: from pathophysiology to clinical implications. Cancers (Basel). 2023;15(5):1518. doi: 10.3390/cancers15051518 - DOI - PMC - PubMed
    1. Cornford P, van den Bergh RCN, Briers E, et al. EAU-EANM-ESTRO-ESUR-ISUP-SIOG guidelines on prostate cancer—2024 update. Part I: screening, diagnosis, and local treatment with curative intent. Eur Urol. 2024;86(2):148–163. doi: 10.1016/j.eururo.2024.03.027 - DOI - PubMed
    1. Shen G, Deng H, Hu S, et al. Comparison of choline-PET/CT, MRI, SPECT, and bone scintigraphy in the diagnosis of bone metastases in patients with prostate cancer: a meta-analysis. Skeletal Radiol. 2014;43(11):1503–1513. doi: 10.1007/s00256-014-1903-9 - DOI - PubMed
    1. Liu D, Kuai Y, Zhu R, et al. Prognosis of prostate cancer and bone metastasis pattern of patients: a SEER-based study and a local hospital based study from China. Sci Rep. 2020;10(1):9104. doi: 10.1038/s41598-020-64073-6 - DOI - PMC - PubMed