Range-Wide Genomic Analysis Reveals Regional and Meta-Population Dynamics of Decline and Recovery in the Grey Seal
- PMID: 40536212
- PMCID: PMC12237086
- DOI: 10.1111/mec.17824
Range-Wide Genomic Analysis Reveals Regional and Meta-Population Dynamics of Decline and Recovery in the Grey Seal
Abstract
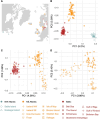
Wildlife populations globally have experienced widespread historical declines due to anthropogenic and environmental impacts, yet for some species, contemporary management and conservation programmes have enabled recent recovery. The impacts of decline and recovery on genomic diversity and, vice versa, the genetic factors that contribute to conservation success or failure are rich areas for inquiry, with implications for shaping how we manage species into the future. To comprehensively characterise these processes in natural systems requires range-wide sampling and international collaboration, particularly for species with wide dispersal capabilities, broad geographic distributions, and complex regional metapopulation dynamics. Here, we present the first range- and genome-wide population genomic analysis of grey seals based on 3812 nuclear SNPs genotyped in 188 samples from 17 localities. Our analyses support the existence of three main grey seal populations centred in the NW Atlantic, NE Atlantic and Baltic Sea, and point to the existence of previously unrecognised substructure within the NE Atlantic. We detected remarkably low levels of genetic diversity in the NW Atlantic population, and demographic analyses revealed a turbulent history of NE Atlantic and Baltic Sea grey seals, with bottlenecks in the Middle Ages and the 20th century due to hunting and habitat alterations. We found some localities deviated from isolation by distance patterns, likely reflecting wide-scale metapopulation dynamics associated with recolonisation and recovery in regions where they were historically extirpated. We identify at least six grey seal genetic populations and reveal marked genetic effects of past declines and recent recovery across the species' range.
Keywords: Halichoerus grypus; conservation genomics; hunting; management units; marine mammals; recovery; top‐predator.
© 2025 The Author(s). Molecular Ecology published by John Wiley & Sons Ltd.
Conflict of interest statement
The authors declare no conflicts of interest.
Figures


References
-
- Ahlgren, H. , Bro‐Jørgensen M. H., Glykou A., et al. 2022. “The Baltic Grey Seal: A 9000‐Year History of Presence and Absence.” Holocene 32, no. 6: 569–577.
-
- Alcala, N. , Goudet J., and Vuilleumier S.. 2014. “On the Transition of Genetic Differentiation From Isolation to Panmixia: What We Can Learn From GST and D.” Theoretical Population Biology 93: 75–84. - PubMed
-
- Allen, P. J. , Amos W., Pomeroy P. P., and Twiss S. D.. 1995. “Microsatellite Variation in Grey Seals (<styled-content style="fixed-case"> Halichoerus grypus </styled-content>) Shows Evidence of Genetic Differentiation Between Two British Breeding Colonies.” Molecular Ecology 4, no. 6: 653–662. - PubMed
-
- Attard, C. R. M. , Sandoval‐Castillo J., Lang A. R., et al. 2024. “Global Conservation Genomics of Blue Whales Calls Into Question Subspecies Taxonomy and Refines Knowledge of Population Structure.” Animal Conservation 27, no. 5: 626–638.
MeSH terms
Grants and funding
LinkOut - more resources
Full Text Sources
Miscellaneous

