. 2025 Sep;12(34):e16476.
doi: 10.1002/advs.202416476. Epub 2025 Jun 19.

Scaffolding Protein ENH Promotes Tumor Angiogenesis and Growth Through Macrophage Recruitment and Polarization

Affiliations

Scaffolding Protein ENH Promotes Tumor Angiogenesis and Growth Through Macrophage Recruitment and Polarization

Yueli Shi et al. Adv Sci (Weinh). 2025 Sep.

Abstract

Angiogenesis is vital for tumor growth and metastasis, with tumor-associated macrophages (TAMs) being key pro-angiogenic cells recruited by tumor-secreted chemokines. High levels of TAMs contribute to tumor progression and antiangiogenic therapy resistance. Therefore, intensive study of the regulatory mechanisms of TAMs recruitment during tumor development is important for the discovery of new antitumor and antiangiogenic therapeutic strategies. Here, we found that in lung adenocarcinoma (LUAD), ENH levels positively correlated with microvessel density and TAMs infiltration. Further exploration revealed that ENH promoted LUAD angiogenesis and growth by stimulating TAMs recruitment and M2 polarization. Mechanistically, ENH in LUAD induced YAP nuclear aggregation to promote CCL5 transcription, thereby increasing monocyte chemotaxis and ultimately increasing TAMs infiltration and M2 polarization. Besides, we found that ENH interacted with YAP through LIM domains, which significantly triggered the formation of YAP-KPNA2 complexes. Consequently, YAP is imported into the nucleus by KPNA2 and then promoted CCL5 transcription. Notably, ENH knockdown also significantly increased the chemosensitivity. Together, ENH functions in LUAD cells to mediate macrophage infiltration and M2 polarization, which in turn promotes tumor angiogenesis and growth, and targeting ENH offers a promising target for antiangiogenic therapy through immune modulation.

Keywords: ENH protein; YAP signaling; angiogenesis; lung adenocarcinoma; tumor‐associated macrophages.


Conflict of interest statement

The authors declare no conflict of interest.

Figures
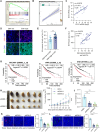
Figure 1
Figure 1
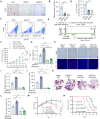
ENH is strongly associated with MVD levels in LUAD tumor tissue and promotes angiogenesis. A) GSEA revealed that ENH expression mainly affected the VEGF signaling pathway. B) The correlation between ENH and angiogenesis marker PECAM1 in LUAD was analyzed using the GEO datasets (GSE85841). C) Identification of the correlation between ENH and CD31 mRNAs in 30 LUAD tissues by qPCR. D) Representative images of IF staining for ENH and CD31 in human LUAD tissues were shown. E) The microvessel counts were quantified based on the IF results, and the results were presented in two groups according to low and high ENH expression (n = 20). F) Identification of the correlation between ENH and MVD based on the IF results (n = 40). G) Kaplan–Meier analysis of OS of LUAD patients was conducted based on endothelial‐specific marker expression levels (CD31, vWF, END). H) Tumor tissues from each group collected 23 days after injection of LLC cells (n = 6). I) Subcutaneous tumor growth of LLC cells stably transduced with control shRNA (shScr) or shRNA targeting ENH (shENH‐1, shENH‐2) was observed (n = 6). J) Tumor weight of LLC murine model in ENH knockdown or control group at day 23 after tumor injection (n = 6). K) Representative images of IF staining for CD31 in subcutaneous tumor tissues obtained from ENH knockdown and control groups at the end of modeling. Quantification of CD31+ vessel density was shown (n = 15). L) Representative images of IF staining for CD31 of subcutaneous tumor tissues of ENH knockdown and control groups were obtained when tumors were similar in size. Quantification of CD31+ vessel density was shown (n = 5).
Figure 2
Figure 2
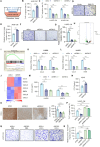
ENH‐induced tumor angiogenesis and growth are related to TAMs infiltration. A, B) IHC analysis of F4/80 positive cells in ENH knockdown or control LLC subcutaneous tumors sections was performed. The ratio of F4/80 positive cells was quantified and shown as a bar graph (n = 6). C, D) Representative flow cytometric plots of tumor‐infiltrating CD45+CD11b+F4/80+ macrophages in LLC subcutaneous tumors with or without ENH knockdown. The quantification of the proportion of infiltrating TAMs (CD45+CD11b+F4/80+/total cell, P10/R1) was shown as a bar graph (n = 4). E) Schematic for macrophage depletion in C57BL/6 mice implanted subcutaneously with LLC tumor cells. F) LLC‐Vector and LLC‐ENH‐OV tumor growth in mice treated with PBS or clodronate liposomes (n = 5). G) Weight of dissected tumors obtained from mice of indicated groups (n = 5). H) Representative images of IHC staining for F4/80 and IF staining for CD31 in LLC‐Vector and LLC‐ENH‐OV tumors sections treated with PBS or clodronate liposomes. I,J) Quantification of CD31+ vessels density and the ratio of F4/80 positive cells was shown. K) Representative images of HE staining of lung sections from orthotopic tumor‐bearing mice of indicated groups. Red arrows represent the tumors. L) The quantification of tumor burden of lung sections from indicated groups. M) The changes in body weight of orthotopic tumor‐bearing mice during the period of the experiment. N) Survival curve of orthotopic tumor‐bearing mice in indicated groups.
Figure 3
Figure 3
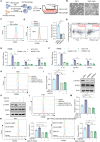
ENH recruits macrophages via CCL5. A) Scheme of the method for THP1 and human primary monocytes chemotaxis assay using CM of LUAD cells. B) The bar graph showed the number of migrated THP1 cells induced by CM isolated from ENH‐overexpressing A549 cells, represented as a relative percentage to the control (n = 4). C) The bar graph showed the number of migrated THP1 cells induced by CM isolated from ENH knockdown H1975 and H1650 cells, represented as a relative percentage to the control (n = 4). D, E) Representative images and a bar graph depicted the quantity of migrated human primary monocytes stimulated by CM isolated from ENH‐overexpressing A549 cells. The results were presented as a relative percentage compared to the control group (n = 4). F. G) Representative images and a bar graph depicted the quantity of migrated human primary monocytes stimulated by CM isolated from ENH knockdown H1975 cells. The results were presented as a relative percentage compared to the control group (n = 4). H) RNA sequencing of A549 cells with or without ENH knockdown. The volcano plot displayed the DEGs between the control and ENH knockdown groups. I) GSEA revealed that ENH expression mainly affected cytokine–cytokine receptor interaction pathway. J) Heatmap showing the expression of cytokines that are significantly altered in ENH knockdown A549 cells derived from RNA‐seq data. K, L) qPCR analysis was conducted to verify the downregulation of CCL5 mRNA levels in ENH knockdown H1975 and H1650 cells (n = 3). M) ELISA was conducted to verify the downregulation of CCL5 protein levels in ENH knockdown H1975 and H1650 cells (n = 5). N) ELISA was conducted to verify the upregulation of CCL5 protein level in ENH overexpression A549 cells (n = 5). O) Representative images of IHC staining for CCL5 in ENH knockdown or control LLC subcutaneous tumor sections. Statistical analysis of IHC results of CCL5 expression was shown as a bar graph (n = 5). P) CM collected from ENH knockdown cells added with or without rCCL5 protein was used as chemoattractants in THP1 chemotaxis assay. The bar graph showed the number of migrated THP1 cells, represented as a relative percentage to the control (n = 3). Q, R) CM collected from ENH knockdown cells added with or without rCCL5 protein was used as chemoattractants in human primary monocytes chemotaxis assay. Representative images and a bar graph depicted the quantity of migrated human primary monocytes. The results were presented as a relative percentage compared to the control group (n = 3).
Figure 4
Figure 4
CCL5 is essential for ENH‐induced TAMs recruitment, tumor growth, and angiogenesis. A)Schematic for CCL5 signaling blocking in C57BL/6 mice implanted subcutaneously with LLC tumor cells. B) LLC‐Vector and LLC‐ENH‐OV tumor growth in mice treated with or without maraviroc (n = 6). C) Weight of dissected tumors obtained from mice of indicated groups (n = 6). D) Representative images of IF staining for CD31 and IHC staining for F4/80 in LLC‐Vector and LLC‐ENH‐OV tumors sections treated with or without maraviroc. E,F) The ratio of F4/80 positive cells and CD31+ vessel density was quantified and shown as a bar graph (n = 6).
Figure 5
Figure 5
ENH activates macrophage STAT3 signaling through CCL5 to promote M2 polarization. A) Schematic model of the co‐culture system of THP1 and human primary monocytes‐drived macrophages with LUAD cells. B) Representative images of THP‐1 cells before and after PMA treatment. C) Flow cytometric analysis of CD68 expression in PMA‐treated or untreated THP‐1 cells. D) Flow cytometric analysis of CD206 expression in THP1‐drived macrophages co‐cultured with ENH knockdown LUAD cells. The mean fluorescence intensities (MFI) value of each group was represented in the histogram (n = 3). E,F) The mRNA levels of M2 markers in THP1‐drived macrophages co‐cultured with ENH knockdown LUAD cells were measured by qPCR (n = 3). G) The correlation of ENH with M2 macrophage infiltration in LUAD was analyzed using the TIMER 2.0 database. H, I) Flow cytometric analysis of CD206 expression in THP1‐drived macrophages co‐cultured with ENH overexpression and CCL5 knockdown LUAD cells. The MFI value of each group was represented in histogram (n = 3). J) Western blot analysis of STAT3/p‐STAT3 levels in THP1‐drived macrophages co‐cultured with ENH knockdown LUAD cells. K) Western blot analysis of STAT3/p‐STAT3 levels in THP1‐drived macrophages co‐cultured with ENH overexpression and CCL5 knockdown LUAD cells. L,M) Flow cytometric analysis of CD206 expression in THP1‐drived macrophages co‐cultured with ENH overexpression LUAD cells treated with or without STAT3 inhibitor (STAT3‐IN). The MFI value of each group was represented in the histogram (n = 3). N,O) Flow cytometric analysis of CD206 expression in THP1‐ and human primary monocytes‐derived macrophages co‐cultured with ENH overexpression LUAD cells treated with or without maraviroc (MRC). The MFI value of each group was represented in histogram (n = 3).
Figure 6
Figure 6
ENH interacts with YAP to promote its nuclear translocation. A) Representative images of IF staining for YAP in ENH knockdown H1975 and H1650 cells. B) Western blot analysis of YAP cellular localization changes in ENH knockdown H1975 and H1650 cells. C) YAP transcriptional activity in H1650 and H1975 cells expressing the 8× GTIIC luciferase reporter. Cells were silenced with ENH shRNA (n = 3). D) CO‐IP analysis of the interaction between ENH and YAP in HEK293T cells. E) Mapping ENH fragments that interacted with YAP. HEK293T cells were co‐transfected with FLAG–YAP and ENH truncated fragment (HA‐ENH, 1–596 amino acids; LIMs, 418–596 amino acids; △PDZ, 85–596 amino acids; PDZ, 1–85 amino acids) for immunoprecipitation assays. F) CO‐IP analysis of the interaction between YAP and ENH LIM domain deletion mutant (△LIMs) in HEK293T cells. G) Western blot analysis of YAP cellular localization changes in A549 cells overexpressing ENH full‐length or LIM‐domain deletion mutant. H) YAP transcriptional activity was detected in A549 cells overexpressing ENH full‐length or LIM‐domain deletion mutant (n = 3). I) qPCR analysis of CCL5 mRNA levels in A549 cells overexpressing ENH full‐length or LIM‐domain deletion mutant (n = 3). J) CM collected from A549 cells overexpressing ENH full‐length or LIM‐domain deletion mutant was used as chemoattractant in THP1 chemotaxis assay. The bar graph showed the number of migrated THP1 cells, represented as a relative percentage to the control (n = 3). K, L) Representative images and a bar graph depicted the quantity of migrated human primary monocytes stimulated by CM isolated from ENH or LIM‐domain deletion mutant overexpression A549 cells. The results were presented as a relative percentage compared to the control group (n = 3).
Figure 7
Figure 7
ENH interacts with YAP to induce its binding to KPNA2, followed by nuclear translocation. A) Representative images of IF staining for YAP in KPNA2 knockdown H1650 cells. B) CO‐IP analysis of the interaction between YAP and KPNA2 in H1650 cells with ENH knockdown or overexpression. C) CO‐IP analysis of the interaction between YAP and KPNA2 in H1650 cells overexpressing ENH full‐length or LIM‐domain deletion mutant. D) Western blot analysis of YAP cellular localization changes in ENH overexpression A549 cells with or without KPNA2 knockdown. E) Efficiency of ENH overexpression and KPNA2 knockdown in A549 cells was detected by western blot analysis. F) YAP transcriptional activity was detected in ENH overexpression A549 cells with or without KPNA2 knockdown (n = 3). G) ELISA analysis of CCL5 protein levels in ENH overexpression A549 cells with or without KPNA2 knockdown (n = 4). H) The schematic diagram shows the general process and mechanism of this study. ENH in tumor cells induces the binding of YAP to KPNA2, triggering YAP nucleus entry to up‐regulate CCL5 transcription, thus promoting tumor angiogenesis and growth by driving TAMs infiltration and M2 polarization.

References

    1. Miller K. D., Nogueira L., Devasia T., Mariotto A. B., Yabroff K. R., Jemal A., Kramer J., Siegel R. L., CA. Cancer. J. Clin. 2022, 72, 409. - PubMed
    1. Lee J. M., Mcnamee C. J., Toloza E., Negrao M. V., Lin J., Shum E., Cummings A. L., Kris M. G., Sepesi B., Bara I., Kurtsikidze N., Schulze K., Ngiam C., Chaft J. E., J. Thorac. Oncol. 2023, 18, 1458. - PMC - PubMed
    1. Zeng H., Chen W., Zheng R., Zhang S., Ji J. S., Zou X., Xia C., Sun K., Yang Z., Li H., Wang N., Han R., Liu S., Li H., Mu H., He Y., Xu Y., Fu Z., Zhou Y., Jiang J., Yang Y., Chen J., Wei K., Fan D., Wang J., Fu F., Zhao D., Song G., Chen J., Jiang C., et al., Lancet Glob. Health 2018, 6, 555.
    1. Weis S. M., Cheresh D. A., Nat. Med. 2011, 17, 1359. - PubMed
    1. Xiao M., Shi Y., Jiang S., Cao M., Chen W., Xu Y., Xu Z., Wang K., Front. Oncol. 2022, 12, 1039378. - PMC - PubMed

LinkOut - more resources