. 2025 Sep;12(34):e01990.
doi: 10.1002/advs.202501990. Epub 2025 Jun 19.

Histone Demethylase UTX Suppresses Tumor Cell Proliferation by Regulating Stress Granules

Affiliations

Histone Demethylase UTX Suppresses Tumor Cell Proliferation by Regulating Stress Granules

Xikai Liu et al. Adv Sci (Weinh). 2025 Sep.

Abstract

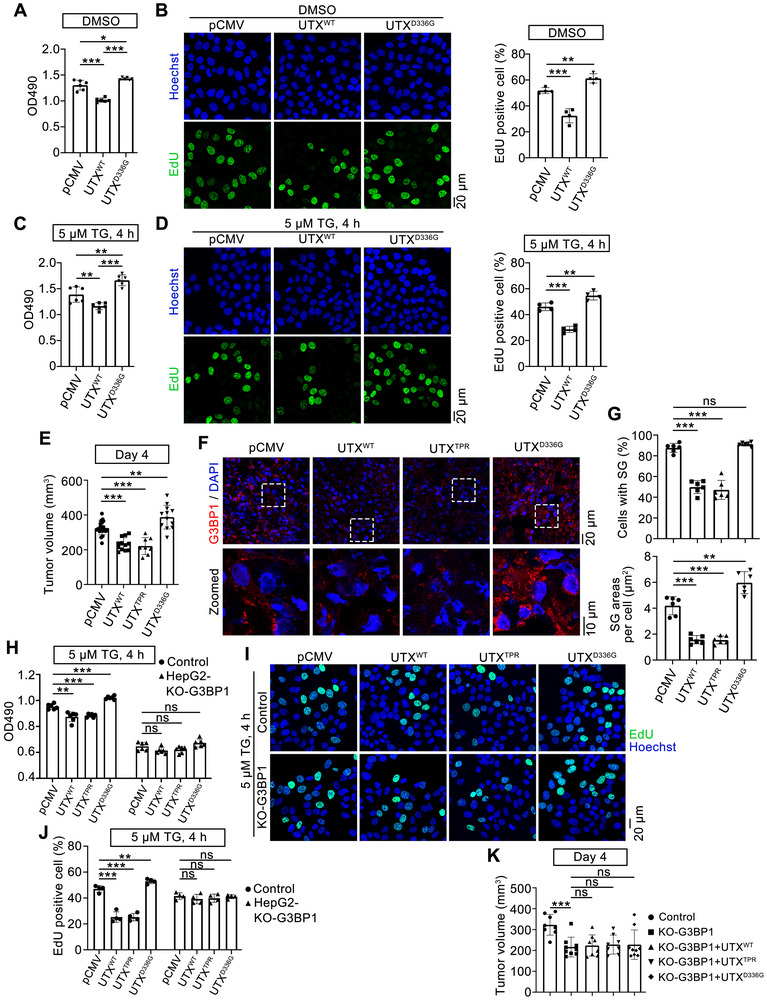
UTX (also known as KDM6A) is a histone H3K27 demethylase that acts as an important tumor regulator. UTX has been reported to participate in genome-wide histone modifications and gene expression in tumorigenesis and its mutations are identified in human cancers. Here, UTX is demonstrated to localize both in the cytoplasm and nucleus, notably, cytoplasmic UTX forms puncta and co-localizes in stress granules (SGs) upon different stresses in vitro. Mechanistically, the TPR domain of UTX plays a critical role in regulating SG disassembly by interacting with G3BP1, the central hub of SG, to disrupt the scaffold network of SG under endoplasmic reticulum stress. Importantly, a clinical UTX mutation, D336G in TPR domain, increases cytoplasmic location of UTX, and stabilizes SG. While UTXD336G promotes, WT UTX or UTXTPR inhibits, cell growth and tumorigenesis by regulating SGs both in vitro and in nude mice, and such regulation is G3BP1 dependent. Together, the results suggest a novel cytoplasmic function of UTX as a negative regulator of SG homeostasis, which is involved in stress and disease states such as tumorigenesis.

Keywords: TPR domain; UTX; endoplasmic reticulum stress; stress granule; tumorigenesis.


Conflict of interest statement

The authors declare no conflict of interest.

Figures

Figure 1
Figure 1
Cytoplasmic UTX forms puncta and localizes in stress granules of thapsigargin‐treated cells. A) Representative images of UTX (red) and G3BP1 (green) in UTX overexpressed Huh7, HepG2, HEK293T, or U2OS cells treated with vehicle (DMSO) or thapsigargin (TG). Huh7 cells, 1 µm TG, 1 h; HepG2 cells, 5 µm TG, 4 h; HEK293T cells, 2.5 µm TG, 1 h; U2OS cells, 5 µm TG, 1 h; Scale bar, 20 µm. B) Representative images of endogenous UTX (green; antibody from Abcam) and G3BP1 (red) (top panel), with plot analysis for the green and red pixel intensities along the indicated arrows in the zoomed pictures (bottom panel). Huh7 cells, 1 µm TG, 1 h. Scale bar, 20 µm. Magnification of the demarcated region was shown as the inset from the merged images, with the inset scale bar representing 5 µm. C) Representative images of UTX (red; antibody from Abcam) and G3BP1 (green) (left panel) with quantification result of the percentage of cytoplasmic UTX puncta co‐localized with G3BP1+ stress granules (right panel) in Huh7 cells treated with 1 µm TG for indicated time. Scale bar, 20 µm. Shown also are magnifications of the indicated inset regions, with the inset scale bar representing 5 µm. Data are shown as the mean ± SD; n = 15 image fields per group from three different samples; ***p < 0.001 (analyzed by one‐way ANOVA). D) Z‐stack projection of the representative image of co‐localized endogenous UTX (red) and G3BP1 (green) in Huh7 cells under 1 µm TG treatment for 1 h (left panel; scale bar, 5 µm); magnified orthogonal sectioning view of regions in the insert box (right panel; scale bar, 2 µm). DAPI, blue, stained nuclei. E) Representative images of UTX (red) and G3BP1 (green) in stable knockout UTX HepG2 cells transfected with empty vector (pCMV) or UTX WT plasmid (UTXWT) treated with 5 µm TG for 4 h. Scale bar, 20 µm. All results are representative for at least three independent experiments, with similar results obtained.
Figure 2
Figure 2
Enhanced association of cytoplasmic UTX with stress granule components upon stresses. A) A diagram for the subcellular fractionation process is shown in the top panel. Immunoblot analysis of indicated proteins in the whole cell lysates (input), nucleus‐free soluble fraction (soluble) and insoluble ribonucleoprotein granule fraction (RG) of Huh7 cells (bottom panel); CT, control; TG, 1 µm for 1 h; SA (sodium arsenite), 500 µm for 1 h; HS (heat shock), 43 °C for 1 h. B) Cytoplasmic fraction of Huh7 cells was subjected to immunoprecipitation with UTX antibody. Immunoblot analysis of the indicated proteins with α‐tubulin or IgG as the loading control. C) Diagram for the design of dimerization‐dependent fluorescent protein (ddFP) system between UTX and G3BP1 (left panel) with representative images of live HepG2 cells transiently transfected with GA‐G3BP1, GB‐UTX, and RFP‐TIA1, with or without TG (5 µm, 4 h)‐ or SA (500 µm, 1 h)‐treatment. Scale bar, 10 µm. Shown also are magnifications of the indicated inset regions, with the inset scale bar representing 5 µm. Results are representative for at least three independent experiments, with similar results obtained.
Figure 3
Figure 3
UTX accelerates thapsigargin‐induced stress granule disassembly. A) Representative images of UTX (red) and G3BP1 (green) (left) with quantification of the percentage of cells with SG (right) in Huh7 cells transfected with pSuper (control) or shUTX plasmid under 1 µm TG treatment for indicated time. Scale bar, 20 µm. B) Quantitative results of the percentage of cells with SG (left, n = 4 independent samples per group), number of SG per cell (middle, n = 20 cells per group collected from four independent samples), and SG size (right, 16 images per group collected from four independent samples) in Huh7 cells transfected with pSuper or shUTX plasmid under 1 µm TG for 4 h. C) Representative images of UTX (red) and G3BP1 (green) (left) with quantification of the percentage of cells with SG (right) in HepG2 cells transfected with empty vector (pCMV) or UTX wildtype (UTXWT) plasmid under 5 µm TG treatment for indicated time. Scale bar, 20 µm. D) Quantitative results of the percentage of cells with SG (left, n = 3 independent samples per group), number of SG per cell (middle, n = 20 cells per group collected from three independent samples), and SG size (right, 12 images per group collected from three independent samples) in HepG2 cells transfected with empty vector (pCMV) or UTX wildtype (UTXWT) plasmid under 5 µm TG for 4 h. All results are representative for at least three independent experiments, with similar results obtained. Data are shown as the mean ± SD, and analyzed by two‐tailed Student's t‐test. *p < 0.05, **p < 0.01, ***p < 0.001; ns, not significant.
Figure 4
Figure 4
UTX promotes thapsigargin‐induced stress granule disassembly through its TPR domain. A) The plasmid constructs of wildtype, enzymatic mutation, and different functional domain deletion of UTX (left panel) used in the present study, and verified by Western blots (right panel). B,C) Representative images of UTX (red) and G3BP1 (green) (B) with quantitative results of the percentage of cells with SGs (C) in HepG2 cells transfected with indicated plasmid under 5 µm TG treatment for 4 h. Scale bar, 20 µm. n = 4–5 image fields per group. D) Quantification of the percentage of cells with SG in HepG2 cells transfected with empty vector (pCMV) or wildtype UTX (UTXWT) or TPR‐domain deleted UTX (UTX△TPR) plasmid under 5 µm TG treatment for indicated time. * comparison with pCMV and UTXWT; # comparison with UTXWT and UTX△TPR. n = 3 per group. E) MTT assays in HepG2 cells transfected with empty vector (pCMV), UTXWT, UTXTPR, or UTX△TPR under 5 µm TG treatment for 4 h. n = 6 per group. F,G) Representative images of UTX (red) and G3BP1 (green) (F) with quantitative results (G) of the percentage of cells with SGs in UTX knockout HepG2 cells transfected with empty vector (pCMV), UTXWT or UTXTPR, and treated with vehicle (DMSO) or 5 µm TG for 4 h. Scale bar, 20 µm. n = 4 per group. All results are representative for at least three independent experiments, with similar results obtained. Data are shown as the mean ± SD, and analyzed by one‐way ANOVA. *p < 0.05, **p < 0.01, ***p < 0.001; ns, not significant.
Figure 5
Figure 5
UTX interacts with the NTF2L domain of G3BP1. A) Schematic representation of different G3BP1 domains (up panel) and potential interaction with UTXTPR predicted by AlphaFold (bottom panel). B) Interaction between the TPR domain of UTX and NTF2L domain of G3BP1 predicted by AlphaFold and the interaction interface residues are marked on the right. C) Co‐immunoprecipitation assays for G3BP1 and UTX in HEK293T cells transfected with EGFP‐tagged G3BP1 and different domain truncated UTX. * indicates corresponding bands of WT or truncated domains of UTX; # indicates IgG heavy chain. n = 4 per group. D) Co‐immunoprecipitation assays for UTX and G3BP1 in HEK293T cells transfected with Myc‐tagged UTX and different truncated domains of G3BP1. n = 3 per group. E) MST analysis of the interaction between the TPR and NTF2L domains. Recombinant TPR (50 nm) was incubated with increasing concentrations of NTF2L proteins. F) Schematic representation of different TPR domains. G) Co‐immunoprecipitation assays for G3BP1 and TPR domains in HEK293T cells transfected with EGFP‐tagged G3BP1 and different domain‐deleted of TPR domain. n = 3 per group. All results are representative for at least three independent experiments, with similar results obtained. Data are shown as the mean ± SD, and analyzed by one‐way ANOVA. *p < 0.05, **p < 0.01, ***p < 0.001; ns, not significant.
Figure 6
Figure 6
UTX disassembles stress granules by blocking the G3BP1 interaction network. A) STRING network from GeneCards (https://www.genecards.org/) provides G3BP1 interaction protein network (left panel) with the five top‐scored proteins shown in the right panel. B) Co‐immunoprecipitation assays for USP10 (left) or CAPRIN (right) with G3BP1 or UTX in Huh7 cells without or with 1 µm TG for 1 h. C) Co‐immunoprecipitation assays for G3BP1 with USP10, CAPRIN, or UTX in HEK293T cells transfected with increasing amounts of UTXWT plasmid (left panel) and quantification results (right panel). n = 3 per group. Results are shown as mean ± SD., and analyzed by one‐way ANOVA. *p < 0.05, **p < 0.01, ***p < 0.001. D) Immunoblot analysis of the indicated proteins from whole cell lysates (input), soluble fraction without nucleus (soluble) and the insoluble ribonucleoprotein granule (RG) fraction in Huh7 cells treated with 1 µm TG for indicated time. All results are representative for at least three independent experiments, with similar results obtained.
Figure 7
Figure 7
Clinical UTX mutation stabilizes SG under thapsigargin treatment. A–D) Representative images of UTX (red) and G3BP1 (green) (A) with quantitative results of the percentage of cells with SGs (B, n = 4 per group), number of SG per cell (C, n = 20 cells per group collected from four independent samples), and size of SG (D, 12 images per group collected from four independent samples) in HepG2 cells transfected with empty vector (pCMV), UTXWT or UTXD336G, under vehicle (DMSO) or 5 µm TG treatment for 4 h. Scale bar, 20 µm. E,F) Representative images of UTX (red) and G3BP1 (green) (E) with quantitative results of the percentage of cells with SG (F) in UTX stable knockout HepG2 cells transfected with empty vector (pCMV) or UTXD336G under vehicle (DMSO) or 5 µm TG treatment for 4 h. Scale bar, 20 µm. All results are representative for at least three independent experiments, with similar results obtained. Data are shown as the mean ± SD, and analyzed by one‐way ANOVA. *p < 0.05, ***p < 0.001.
Figure 8
Figure 8
Clinical UTX mutation promotes tumorigenesis by stabilizing SG. A,C) MTT assays in HepG2 cells transfected with empty vector (pCMV), UTXWT, or UTXD336G under vehicle (DMSO; A) or 5 µm TG treatment for 4 h (C). n = 6 per group. B,D) Representative images (left) with quantitative results (right) of EdU assay in HepG2 cells transfected with empty vector (pCMV), UTXWT, or UTXD336G under vehicle (DMSO; B) or 5 µm TG treatment for 4 h (D). EdU positive cells (green); Hoechst stained nuclei (blue). Scale bar, 20 µm. n = 4 per group. E) Volume of xenograft tumors at day 4 from indicated groups. pCMV, n = 20; UTXWT, n = 12; UTXTPR, n = 8; UTXD336G, n = 12. F,G) Representative images of G3BP1 staining (red, F) with quantitative results of the percentage of cells with SGs (G, up) and SG areas per cell (G, bottom) in xenograft tumors. G3BP1+, red; DAPI, blue, stained nuclei. n = 6 mice per group. Scale bar, 20 µm. Shown also are magnifications of indicated inset regions, with the inset scale bar representing 10 µm. H) MTT assays in G3BP1 knockout HepG2 cells transfected with empty vector (pCMV), UTXWT, UTXTPR, and UTXD336G under 5 µm TG treatment for 4 h. n = 6 per group. I,J) Representative images (I) with quantitative results (J) of EdU assay in the control or G3BP1 knockout HepG2 cells transfected with empty vector (pCMV), UTXWT, UTXTPR, and UTXD336G under 5 µm TG treatment for 4 h. Scale bar, 20 µm. n = 4 per group. K) Volume of xenograft tumors at day 4 from indicated groups injected with control or G3BP1 knockout HepG2 cells which are transfected with empty vector (pCMV), UTXWT, UTXTPR, and UTXD336G. Control, n = 8; KO‐G3BP1, n = 9; KO‐G3BP1 + UTXWT, n = 8; KO‐G3BP1 + UTXTPR, n = 8; KO‐G3BP1 + UTXD336G, n = 9. All cell culture results are representative for at least three independent experiments, with similar results obtained. Data are shown as the mean ± SD, and analyzed by one‐way ANOVA. *p < 0.05, **p < 0.01, ***p < 0.001; ns, not significant.
Figure 9
Figure 9
The association between UTX cytoplasmic localization and G3BP1 puncta in tumor tissues. A–C) Representative images of UTX and G3BP1 staining (A), with H‐score of G3BP1 (B) and percentage of cells with nuclear localization of UTX (C) in human HCC and para‐HCC sections. Scale bar, 50 µm. n = 6 per group. Data are shown as the mean ± SD, and analyzed by two‐tailed Student's t‐test. *p < 0.05. D) Representative images of UTX and G3BP1 staining in human lung cancer sections. UTX+, red; G3BP1+, green; DAPI stained nuclei, blue. Scale bar, 20 µm. E) A proposed model for how UTX and its clinical mutation are involved in tumorigenesis by affecting SG homeostasis.

References

    1. Youn J. Y., Dyakov B. J. A., Zhang J., Knight J. D. R., Vernon R. M., Forman‐Kay J. D., Gingras A. C., Mol. Cell 2019, 76, 286. - PubMed
    1. Tauber D., Tauber G., Parker R., Trends Biochem. Sci. 2020, 45, 764. - PMC - PubMed
    1. Yang P., Mathieu C., Kolaitis R. M., Zhang P., Messing J., Yurtsever U., Yang Z., Wu J., Li Y., Pan Q., Yu J., Martin E. W., Mittag T., Kim H. J., Taylor J. P., Cell 2020, 181, 325. - PMC - PubMed
    1. Kedersha N., Ivanov P., Anderson P., Trends Biochem. Sci. 2013, 38, 494. - PMC - PubMed
    1. Fujikawa D., Nakamura T., Yoshioka D., Li Z., Moriizumi H., Taguchi M., Tokai‐Nishizumi N., Kozuka‐Hata H., Oyama M., Takekawa M., Curr. Biol. 2023, 33, 1967. - PubMed

MeSH terms

LinkOut - more resources