. 2025 Jul;12(28):e2417660.
doi: 10.1002/advs.202417660. Epub 2025 Jun 19.

Spatiotemporal Regulation of STING Activity by Linear Ubiquitination Governs Antiviral Immunity

Affiliations

Spatiotemporal Regulation of STING Activity by Linear Ubiquitination Governs Antiviral Immunity

Yong Zhang et al. Adv Sci (Weinh). 2025 Jul.

Abstract

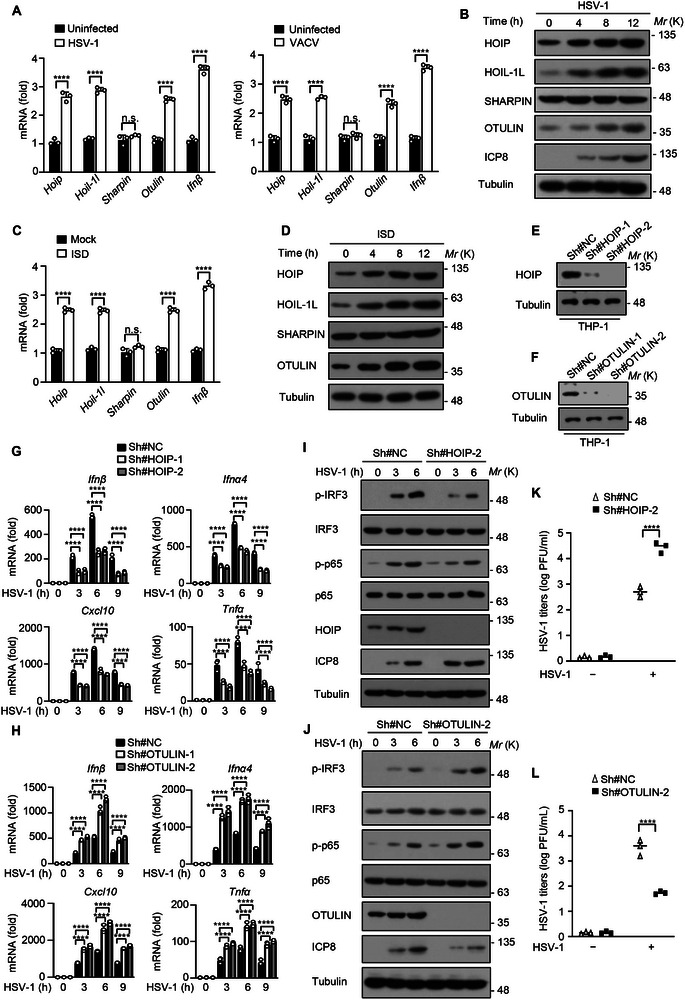
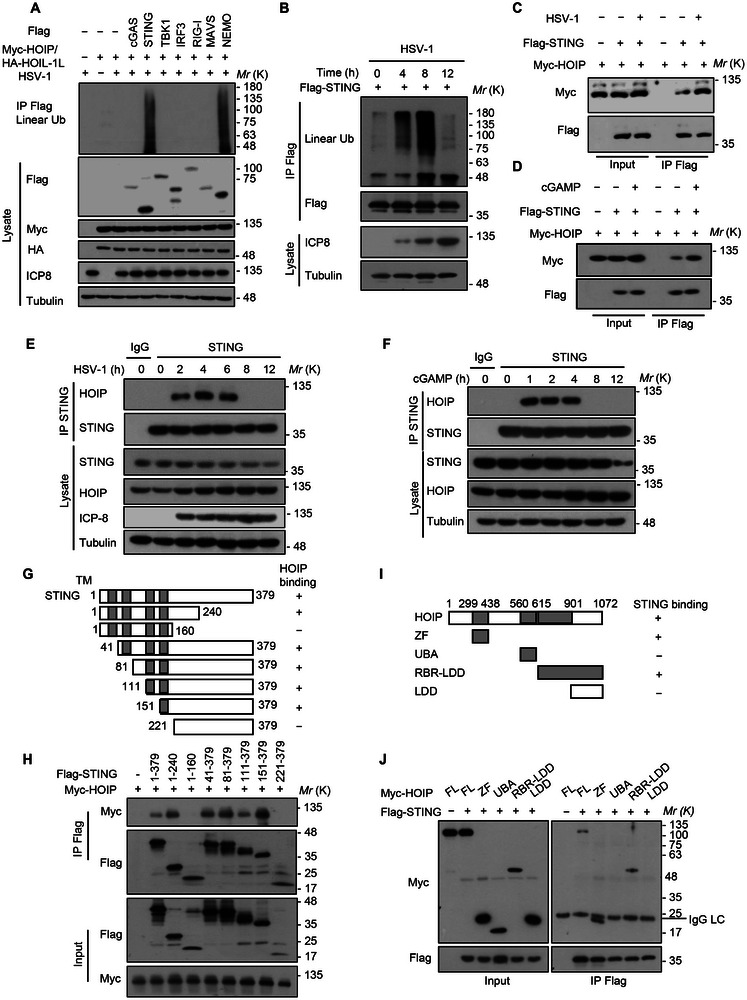
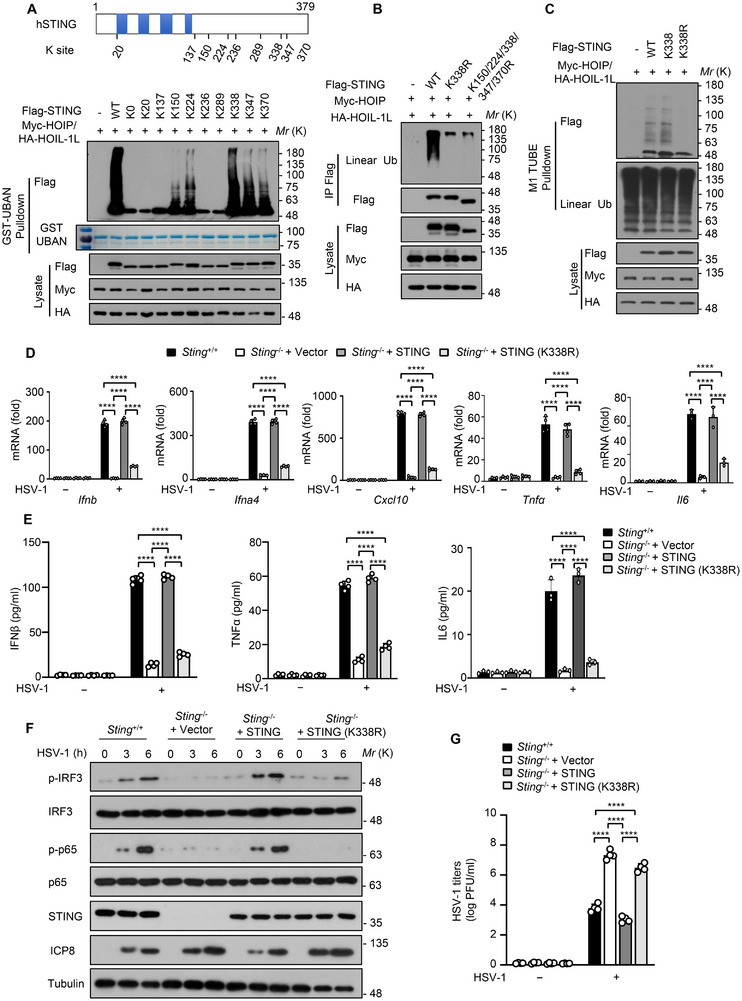
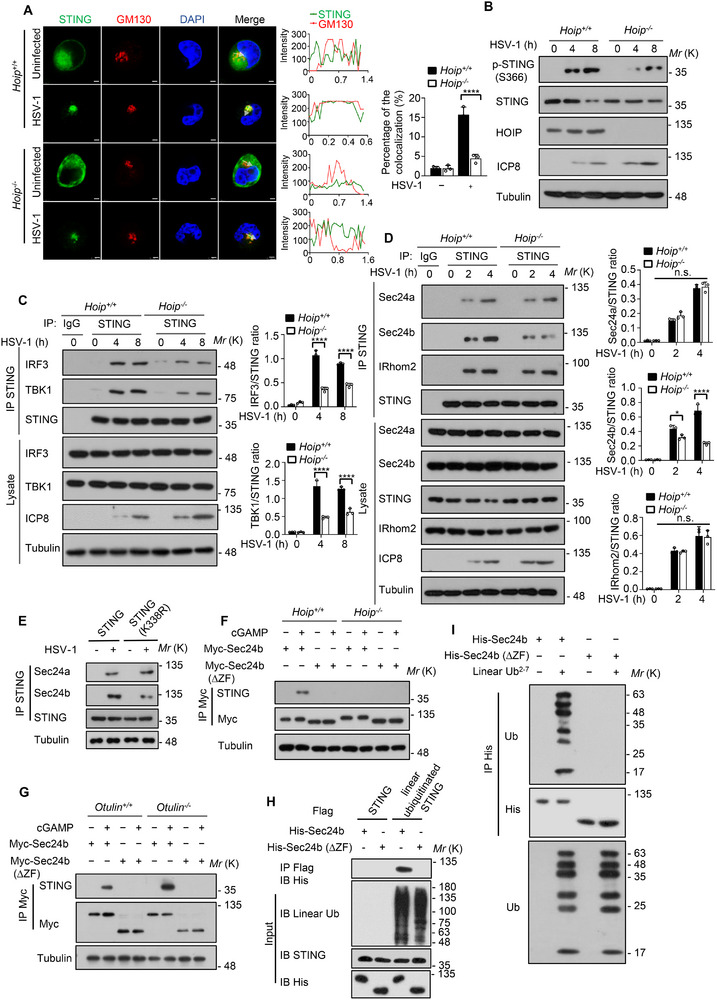
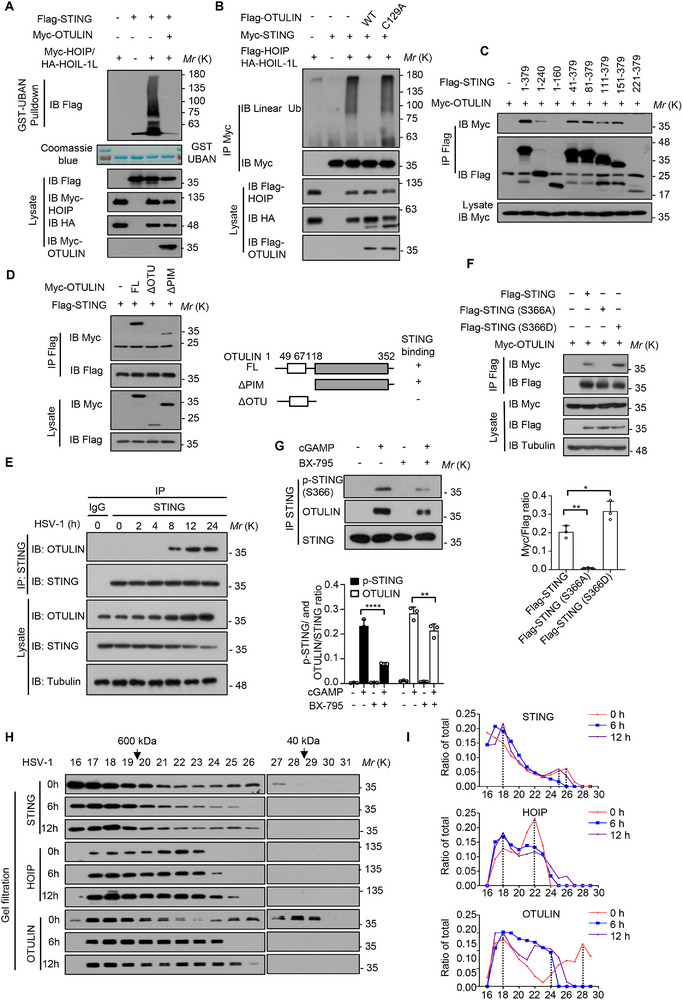
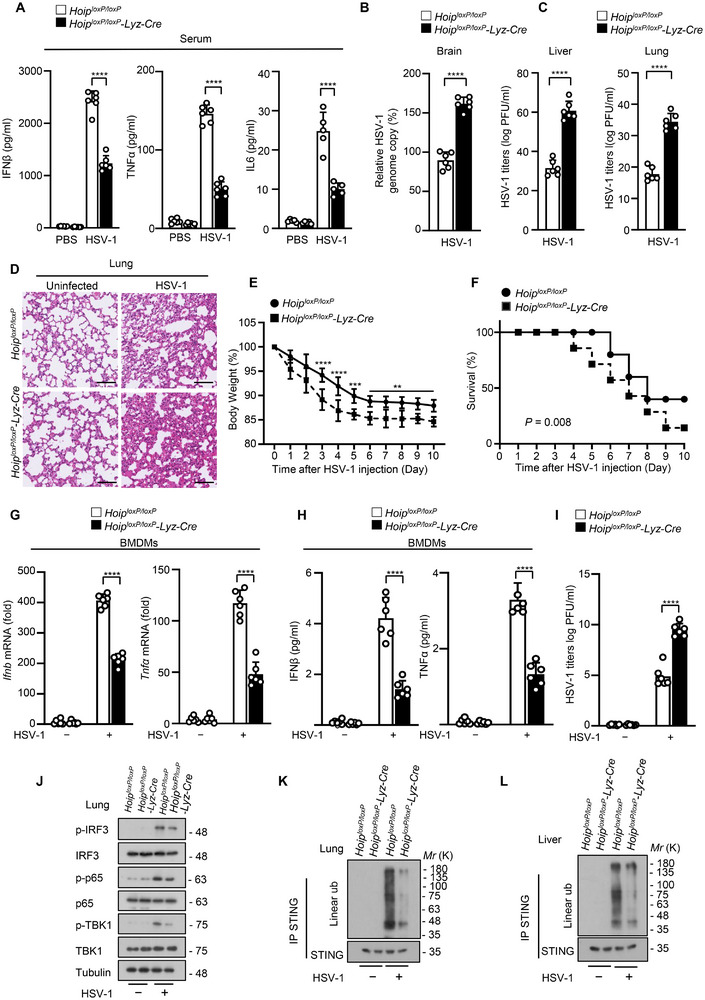
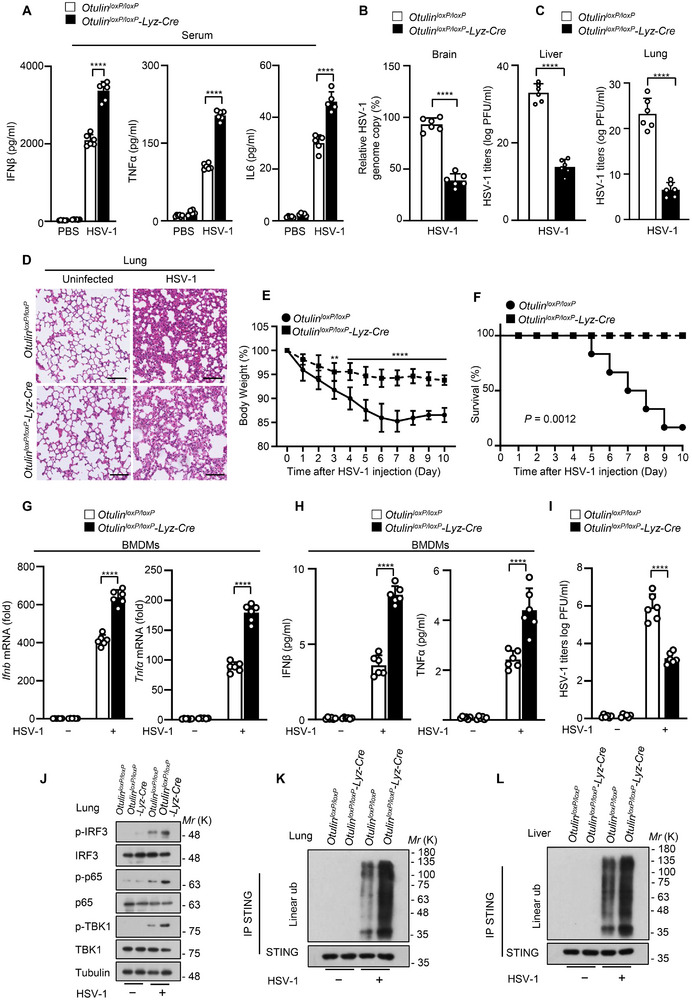
The cyclic GMP-AMP synthase (cGAS)-stimulator of interferon gene protein (STING) signaling plays a critical role in innate immunity and must be tightly regulated to maintain immune homeostasis, but the mechanism underlying the spatiotemporal regulation of this pathway remains largely elusive. Here, it is shown that during DNA viral infection, the linear ubiquitin chain assembly complex (LUBAC) and ovarian tumor deubiquitinase with linear linkage specificity (OTULIN) reversibly catalyze the linear ubiquitination of STING. At the early stage of the infection, LUBAC promotes STING linear ubiquitination to drive its trafficking from the endoplasmic reticulum (ER) to the Golgi apparatus through binding to the Sec24b subunit of the coat protein complex II (COPII) complex. Later on, OTULIN is recruited to TANK1 binding kinase 1 (TBK1)-phosphorylated STING and removes its linear ubiquitin chains, thus preventing excessive antiviral immune responses. Together, the study uncovers a linear ubiquitination-governed spatiotemporal regulatory mechanism that fine-tunes STING-driven antiviral immunity.

Keywords: HOIP; OTULIN; STING; antiviral immunity; linear ubiquitination.


Conflict of interest statement

The authors declare no conflict of interest.

Figures

Figure 1
Figure 1
HOIP and OTULIN bidirectionally regulate antiviral immune responses against DNA viruses. A) qRT‐PCR analysis of Hoip, Hoil‐1l, Sharpin, Otulin, or Ifnβ mRNA in THP‐1 cells infected with HSV‐1 or VACV for 6 h. B) Immunoblot analysis of HOIP, HOIL‐1L, SHARPIN, OTULIN, ICP8, or Tubulin proteins in THP‐1 cells infected with HSV‐1 for the indicated time points. C) qRT‐PCR analysis of Hoip, Hoil‐1l, Sharpin, Otulin, or Ifnβ mRNA in THP‐1 cells treated with 2 µg/mL ISD for 4 h. D) Immunoblot analysis of the HOIP, HOIL‐1L, SHARPIN, OTULIN, or Tubulin proteins in THP‐1 cells stimulated with 2 µg/mL ISD for the indicated time points. E and F) Immunoblot analysis of THP‐1 cells infected with lentivirus expressing scrambled shRNA or shRNA targeting HOIP (E) or OTULIN (F). G and H) qRT‐PCR analysis of Ifnβ, Ifnα4, Cxcl10, or Tnfα mRNA in WT, HOIP knockdown (G) or OTULIN knockdown (H) THP‐1 cells infected with HSV‐1 for the indicated time points. I,J) Immunoblot analysis of p‐IRF3, IRF3, p‐p65, p65, ICP8, Tubulin, HOIP, or OTULIN proteins in WT, HOIP knockdown (I) or OTULIN knockdown (J) THP‐1 cells infected with HSV‐1 for the indicated time points. K and L) Plaque assay of HSV‐1 titers in WT, HOIP knockdown (K) or OTULIN knockdown (L) THP‐1 cells infected with HSV‐1 for 6 h. Data are presented as the mean ± SD. Statistical significance was determined by two‐way ANOVA with Sidak's multiple comparisons test (A, C, K, and L) and with Tukey's multiple comparisons test (G and H). ****P < 0.0001; n.s., not significant. Data are representative of three independent experiments.
Figure 2
Figure 2
STING is a physiological substrate of linear ubiquitination during DNA virus infection. A) Immunoblot analysis of the linear polyubiquitination of cGAS, STING, TBK1, IRF3, RIG‐I, MAVS, or NEMO in HEK293T cells transfected with indicated plasmids using Lipo2000, followed by infected with HSV‐1 for 6 h. B) Immunoblot analysis of the linear polyubiquitination of STING in HEK293T cells infected with HSV‐1 for the indicated times. C,D) Immunoprecipitation analysis of the interaction between STING and HOIP in HEK293T cells cotransfected with Flag‐STING and Myc‐HOIP using Lipo2000, followed by infected with HSV‐1 for 6 h (C) or 2 µg/mL cGAMP for 4 h (D). E and F) Immunoprecipitation analysis of the interaction between STING and HOIP in THP‐1 cells infected with HSV‐1 for the indicated time points (E), or stimulated with 2 µg/mL cGAMP for the indicated time points (F). G and H) A schematic diagram of STING truncations (G) and immunoprecipitation analysis of the interaction between STING domains and HOIP in HEK293T cells cotransfected with Flag‐STING truncations and Myc‐HOIP using Lipo2000 (H). I and J) A schematic diagram of HOIP truncations (I) and immunoprecipitation analysis of the interaction between HOIP truncations and STING in HEK293T cells cotransfected with Myc‐HOIP truncations and Flag‐STING using Lipo2000 (J). ZF, zinc finger; UBA, ubiquitin‐associated domain; RBR, RING‐in‐between‐RING; LDD, linear ubiquitin chain‐determining domain. Data are representative of three independent experiments.
Figure 3
Figure 3
Linear ubiquitination of STING at lysine 338 is essential for antiviral immune responses. A) Immunoblot analysis of the linear polyubiquitination of STING in HEK293T cells transfected with Flag‐STING or its K‐only mutants using Lipo2000. GST‐tagged UBAN used to isolate linear Ub chains were subjected to SDS‐polyacrylamide gel for coomassie brilliant blue staining. B) Immunoblot analysis of the linear polyubiquitination of STING in HEK293T cells cotransfected with Flag‐STING, Flag‐STING (K338R) or Flag‐STING (K150/224/338/347/370R) mutant using Lipo2000. C) Immunoblot analysis of the linear polyubiquitination of STING in HEK293T cells cotransfected with Flag‐STING, Flag‐STING (K338) or Flag‐STING (K338R) using Lipo2000. D) qRT‐PCR analysis of Ifnb, Ifna4, Cxcl10, Tnfα, Il6 mRNA in Sting −/‐ iBMDM cells stably expressing WT STING or STING (K338R) infected with HSV‐1 for 6 h. E) ELISA analysis of IFNβ, TNFα and IL6 in Sting −/‐ iBMDM cells stably expressing WT STING or STING (K338R) mutant infected with HSV‐1 for 6 h. F) Immunoblot analysis of the p‐IRF3, IRF3, p‐p65, p65, ICP8, STING or Tubulin proteins in Sting −/− iBMDM cells stably expressing WT STING or STING (K338R) infected with HSV‐1 for indicated time points. G) Plaque assay of HSV‐1 titers in Sting −/− iBMDM cells stably expressing WT STING or STING (K338R) infected with HSV‐1 for 6 h. Data are presented as the mean ± SD. Statistical significance was determined by two‐way ANOVA with Tukey's multiple comparisons test (D, E, and G). ****P < 0.0001. Data are representative of three independent experiments.
Figure 4
Figure 4
Linear ubiquitination of STING promotes its trafficking from the ER to the Golgi apparatus depending on Sec24b. A) Immunofluorescence analysis of the colocalization of endogenous STING and GM130 in Hoip +/+ and Hoip −/‐ cells infected with HSV‐1 for 4 h. Scale bars, 10 µm. Relative fluorescence intensities of STING and GM130 were measured using Image J along the arrows in the middle. The quantitated colocalization was determined by fluorescence intensities. The percentage of colocalization of STING with Golgi marker GM130 is shown on the right. About 100 cells were counted and analyzed for each biological replicate. B) Immunoblot analysis of the phosphorylated STING, total STING, HOIP, ICP8 and Tubulin in Hoip +/+ and Hoip −/‐ iBMDM cells infected with HSV‐1 for the indicated time points. C) Immunoblot analysis of the interaction between endogenous STING and TBK1 or IRF3 in Hoip +/+ and Hoip −/‐ iBMDM cells infected with HSV‐1 for the indicated time points. The densitometry quantitative analysis of IRF3 or TBK1 relative to STING are shown on the right. D) Immunoblot analysis of the interaction between endogenous STING and Sec24a, Sec24b, or IRhom2 in Hoip +/+ and Hoip −/‐ iBMDM cells infected with HSV‐1 for the indicated time points. The densitometry quantitative analysis of Sec24a, Sec24b or IRhom2 relative to STING are shown on the right. E) Immunoblot analysis of the interaction between STING, and Sec24a or Sec24b in HEK293T cells transfected with Flag‐STING or Flag‐STING (K338R) using Lipo2000. F) Immunoblot analysis of the interactions between transfected Myc‐Sec24b or Myc‐Sec24b (∆ZF) and endogenous STING in Hoip +/+ and Hoip −/‐ iBMDM cells treated with 2 µg/mL cGAMP for 2 h. G) Immunoblot analysis of the interactions between transfected Myc‐Sec24b or Myc‐Sec24b (∆ZF) and endogenous STING in Otulin +/+ and Otulin −/‐ iBMDM cells treated with 2 µg/mL cGAMP for 2 h. H) Immunoblot analysis of the interactions of linear ubiquitinated STING between Sec24b and Sec24b (∆ZF). Linear ubiquitinated STING was isolated from HEK 293T transfected with Flag‐tagged STING, Myc‐tagged HOIP, HA‐tagged HOIL‐1L, and subsequently incubated with BL21‐purified His‐Sec24b or His‐Sec24b (∆ZF) proteins overnight at 4 °C, followed by immunoblot analysis of the interactions. STING purified in HOIP knock‐down cells was a negative control without linear ubiquitination. I) His‐Sec24b, His‐Sec24b (∆ZF) and linear ubiquitin chain was incubated at 37 °C for 1 h, followed by immunoblot analysis of the interactions. Data are presented as the mean ± SD. Statistical significance was determined by two‐way ANOVA with Sidak's multiple comparisons test (A, C, D). *P < 0.05, ****P < 0.0001. Data are representative of three independent experiments.
Figure 5
Figure 5
OTULIN is recruited by phosphorylated STING to remove the linear ubiquitin chains from STING. A) Immunoblot analysis of STING linear ubiquitination with or without OTULIN overexpression. GST‐tagged UBAN proteins used to isolate linear Ub chains were subjected to SDS‐polyacrylamide gel for coomassie brilliant blue staining. B) Immunoblot analysis of the deubiquitinating assay of STING by OTULIN or OTULIN (C129A). C) Immunoprecipitation analysis of the interaction between STING domains and OTULIN in HEK293T cells cotransfected with Flag‐STING truncations and Myc‐OTULIN using Lipo2000. D) Immunoprecipitation analysis of the interaction between OTULIN mutants and STING in HEK293T cells cotransfected with Myc‐OTULIN mutants and Flag‐STING using Lipo2000. A schematic diagram of OTULIN mutants on the right. PIM, PNGase/UBA or UBX‐containing proteins (PUB)‐interacting motif; OTU, ovarian tumor. E) Immunoprecipitation analysis of the interaction between endogenous STING and OTULIN in THP‐1 cells infected with HSV‐1 for the indicated time points. F) Immunoblot analysis of the interaction of OTULIN with WT STING, STING (S366A), and STING (S366D). The densitometry quantitative analysis of OTULIN relative to STING or its mutants is shown at the bottom. G) Immunoblot analysis of the phosphorylation of STING and interaction of STING with OTULIN in THP‐1 cells stimulated with 2 µg/mL cGAMP for 8 h in the absence or presence of TBK1 inhibitor 1 µM BX‐795 for 1 h. The densitometry quantitative analysis of p‐STING or OTULIN relative to STING is shown at the bottom. H) Gel filtration profiles of HOIP, OTULIN or STING in HEK293T cells infected by HSV‐1 for the indicated times. Fractions from lysates separated by Superdex 200 HR were subjected to SDS‐PAGE, followed by immunoblotting with indicated antibodies and analysis in (I). I) The ratio distribution of HOIP, OTULIN, or STING (relative to total protein per group) in HEK293T cells infected with HSV‐1 for the indicated times. Data are representative of three independent experiments. Data are presented as the mean ± SD. Statistical significance was determined by Ordinary one‐way comparisons test (F) and two‐way ANOVA with Sidak's multiple comparisons test (G). *P < 0.05, **P < 0.01, ****P < 0.0001. Data are representative of three independent experiments.
Figure 6
Figure 6
HOIP promotes antiviral innate immune responses against HSV‐1 in vivo. A) ELISA analysis for IFNβ, TNFα, and IL6 secretion in sera from HoiploxP/loxP and HoiploxP/loxP‐Lyz‐Cre mice intravenously infected with HSV‐1 for 24 h. B) Viral titers in homogenates of brains from HoiploxP/loxP and HoiploxP/loxP Lyz‐Cre mice (n = 6) after intravenous injection of HSV‐1 (1 × 10⁶ PFU per mouse). C) Plaque assays analysis of HSV‐1 titers in the livers or lungs from HoiploxP/loxP and HoiploxP/loxP‐Lyz‐Cre mice intravenously infected with HSV‐1 for 3 days. D) Hematoxylin‐eosin staining of lungs of HoiploxP/loxP and HoiploxP/loxP Lyz‐Cre (n = 6) after intravenous injection of HSV‐1 (1 × 10⁶ PFU per mouse). Scale bars, 50 µm. (E) Body weight of HoiploxP/loxP and HoiploxP/loxP Lyz‐Cre mice (n = 6) after intravenous injection of HSV‐1 (1 × 10⁶ PFU per mouse). F) Survival (Kaplan‐Meier curves) of HoiploxP/loxP and HoiploxP/loxP Lyz‐Cre mice (n = 6) after intravenous injection of HSV‐1 (1 × 10⁶ PFU per mouse). G) qRT‐PCR analysis of Ifnb and Tnfα mRNA in HoiploxP/loxP and HoiploxP/loxP Lyz‐Cre BMDMs infected with HSV‐1 for 8 h. H) ELISA analysis for IFNβ or TNFα secretion in HoiploxP/loxP and HoiploxP/loxP Lyz‐Cre BMDMs infected with HSV‐1 for 12 h. I) Plaque assay of HSV‐1 titers in HoiploxP/loxP and HoiploxP/loxP Lyz‐Cre BMDMs infected with HSV‐1 for 12 h. (J) Immunoblot analysis of p‐TBK1, p‐IRF3, and p‐p65 in the lungs from HoiploxP/loxP and HoiploxP/loxP‐Lyz‐Cre mice intravenously infected with HSV‐1 for 3 days. K and L) Immunoblot analysis of linear ubiquitination of STING in the lungs (K) or livers (L) from HoiploxP/loxP and HoiploxP/loxP‐Lyz‐Cre mice intravenously infected with HSV‐1 for 3 days. Data are presented as the mean ± SD. Statistical significance was determined by two‐way ANOVA with Sidak's multiple comparisons test (A, E, G, H and I), unpaired two‐tailed Student's t‐tests (B, C) and Log‐rank (Mantel‐Cox) test (F). **P < 0.01, ****P < 0.0001. Data are representative of three independent experiments.
Figure 7
Figure 7
OTULIN inhibits antiviral innate immune responses against HSV‐1 in vivo. A) ELISA analysis for IFNβ or TNFα secretion in sera from OtulinloxP/loxP and Otulin loxP/loxP Lyz‐Cre mice (n = 6) infected with HSV‐1 for 24 h. B) Viral titers in homogenates of brains from OtulinloxP/loxP and Otulin loxP/loxP Lyz‐Cre mice (n = 6) after intravenous injection of HSV‐1 (1 × 10⁶ PFU per mouse). C) Plaque assays analysis of HSV‐1 titers in the liver or lung from OtulinloxP/loxP and Otulin loxP/loxP‐Lyz‐Cre mice intravenously infected with HSV‐1 for 3 days. D) Hematoxylin‐eosin staining of lungs of OtulinloxP/loxP and Otulin loxP/loxP Lyz‐Cre (n = 6) after intravenous injection of HSV‐1 (1 × 10⁶ PFU per mouse). Scale bars, 50 µm. E) Body weight of OtulinloxP/loxP and Otulin loxP/loxP Lyz‐Cre mice (n = 6) after intravenous injection of HSV‐1 (1 × 10⁶ PFU per mouse). F) Survival (Kaplan‐Meier curves) of OtulinloxP/loxP and OtulinloxP/loxP Lyz‐Cre mice (n = 6) after intravenous injection of HSV‐1 (1 × 10⁶ PFU per mouse). G) qRT‐PCR analysis of Ifnb and Tnfα mRNA in OtulinloxP/loxP and OtulinloxP/loxP Lyz‐Cre BMDMs infected with HSV‐1 for 8 h. H) ELISA analysis for IFNβ or TNFα secretion in OtulinloxP/loxP and OtulinloxP/loxP Lyz‐Cre BMDMs infected with HSV‐1 for 12 h. I) Plaque assay of HSV‐1 titers in OtulinloxP/loxP and OtulinloxP/loxP Lyz‐Cre BMDMs infected with HSV‐1 for 12 h. J) Immunoblot analysis of p‐TBK1, p‐IRF3, and p‐p65 in the lungs from OtulinloxP/loxP and OtulinloxP/loxP‐Lyz‐Cre mice intravenously infected with HSV‐1 for 3 days. K and L) Immunoblot analysis of linear ubiquitination of STING in the lungs (K) or livers (L) from OtulinloxP/loxP and OtulinloxP/loxP‐Lyz‐Cre mice intravenously infected with HSV‐1 for 3 days. Data are presented as the mean ± SD. Statistical significance was determined by two‐way ANOVA with Sidak's multiple comparisons test (A, E, G, H, and I), unpaired two‐tailed Student's t‐tests (B, C), and Log‐rank (Mantel‐Cox) test (F). **P < 0.01, ****P < 0.0001. Data are representative of three independent experiments.

Similar articles

References

    1. Liu G., Gack M. U., Immunity 2020, 53, 26. - PMC - PubMed
    1. Cadwell K., Nat. Rev. Immunol. 2016, 16, 661. - PMC - PubMed
    1. Harapas C. R., Idiiatullina E., Al‐Azab M., Hrovat‐Schaale K., Reygaerts T., Steiner A., Laohamonthonkul P., Davidson S., Yu C. H., Booty L., Masters S. L., Nat. Rev. Immunol. 2022, 22, 535. - PubMed
    1. Hopfner K. P., Hornung V., Nat. Rev. Mol. Cell Biol. 2020, 21, 501. - PubMed
    1. Ogawa E., Mukai K., Saito K., Arai H., Taguchi T., Biochem. Biophys. Res. Commun. 2018, 503, 138. - PubMed

LinkOut - more resources