

Sweeps in Space: Leveraging Geographic Data to Identify Beneficial Alleles in Anopheles gambiae
- PMID: 40536410
- PMCID: PMC12204609
- DOI: 10.1093/molbev/msaf141
Sweeps in Space: Leveraging Geographic Data to Identify Beneficial Alleles in Anopheles gambiae
Abstract
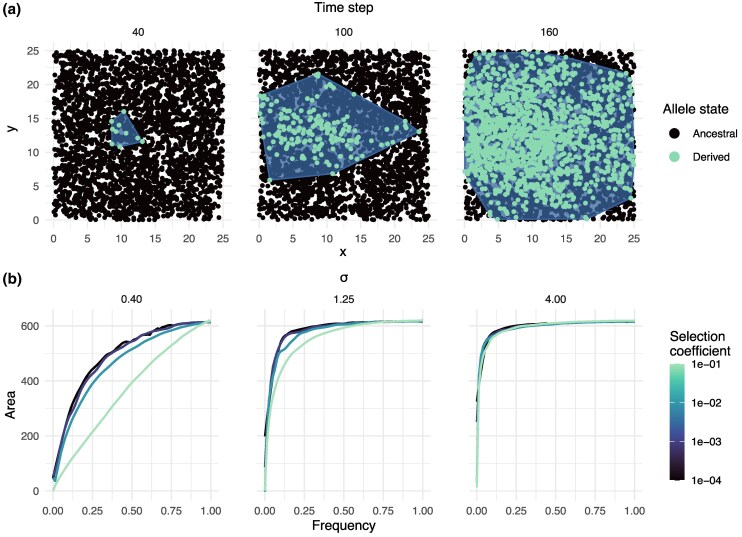
As organisms adapt to environmental changes, natural selection modifies the frequency of nonneutral alleles. For beneficial mutations, the outcome of this process may be a selective sweep, in which an allele rapidly increases in frequency and perhaps reaches fixation within a population. Selective sweeps have well-studied effects on patterns of local genetic variation in panmictic populations, but much less is known about the dynamics of sweeps in continuous space. In particular, because limited movement across a landscape leads to unique patterns of population structure, spatial dynamics may influence the trajectory of selected mutations. Here, we use forward-in-time, individual-based simulations in continuous space to study the impact of space on beneficial mutations as they sweep through a population. In particular, we show that selection changes the joint distribution of allele frequency and geographic range occupied by a focal allele and demonstrate that this signal can be used to identify selective sweeps. We then leverage this signal to identify in-progress selective sweeps within the malaria vector Anopheles gambiae, a species under strong selection pressure from vector control measures. By considering space, we identify multiple previously undescribed variants with potential phenotypic consequences, including mutations impacting known IR-associated genes and altering protein structure and properties. Our results demonstrate a novel signal for detecting selection in spatial population genetic data that may have implications for genomic surveillance and understanding geographic patterns of genetic variation.
Keywords: Anopheles; genomics; insecticide resistance; selection; spatial genetics; vector.
© The Author(s) 2025. Published by Oxford University Press on behalf of Society for Molecular Biology and Evolution.
Conflict of interest statement
Conflict of Interest: None declared.
Figures


Update of
-
Sweeps in space: leveraging geographic data to identify beneficial alleles in Anopheles gambiae.bioRxiv [Preprint]. 2025 Apr 23:2025.02.07.637123. doi: 10.1101/2025.02.07.637123. bioRxiv. 2025. Update in: Mol Biol Evol. 2025 Jun 4;42(6):msaf141. doi: 10.1093/molbev/msaf141. PMID: 39975147 Free PMC article. Updated. Preprint.
Similar articles
-
Sweeps in space: leveraging geographic data to identify beneficial alleles in Anopheles gambiae.bioRxiv [Preprint]. 2025 Apr 23:2025.02.07.637123. doi: 10.1101/2025.02.07.637123. bioRxiv. 2025. Update in: Mol Biol Evol. 2025 Jun 4;42(6):msaf141. doi: 10.1093/molbev/msaf141. PMID: 39975147 Free PMC article. Updated. Preprint.
-
Indoor residual spraying for preventing malaria in communities using insecticide-treated nets.Cochrane Database Syst Rev. 2022 Jan 17;1(1):CD012688. doi: 10.1002/14651858.CD012688.pub3. Cochrane Database Syst Rev. 2022. PMID: 35038163 Free PMC article.
-
Signs and symptoms to determine if a patient presenting in primary care or hospital outpatient settings has COVID-19.Cochrane Database Syst Rev. 2022 May 20;5(5):CD013665. doi: 10.1002/14651858.CD013665.pub3. Cochrane Database Syst Rev. 2022. PMID: 35593186 Free PMC article.
-
Behavioral interventions to reduce risk for sexual transmission of HIV among men who have sex with men.Cochrane Database Syst Rev. 2008 Jul 16;(3):CD001230. doi: 10.1002/14651858.CD001230.pub2. Cochrane Database Syst Rev. 2008. PMID: 18646068
-
Genomic surveillance reveals geographical heterogeneity and differences in known and novel insecticide resistance mechanisms in Anopheles arabiensis across Kenya.BMC Genomics. 2025 Jul 1;26(1):599. doi: 10.1186/s12864-025-11788-3. BMC Genomics. 2025. PMID: 40597647 Free PMC article.
References
-
- Ag1000G Selection Atlas . Ag1000g selection atlas; 2017. [accessed 2025 Jan 15]. https://malariagen.github.io/agam-selection-atlas/0.1-alpha3/.
MeSH terms
Grants and funding
LinkOut - more resources
Full Text Sources
Research Materials
