. 2025 Oct 6;15(10):2096-2116.
doi: 10.1158/2159-8290.CD-24-1772.

KAT6A and KAT7 Histone Acetyltransferase Complexes Are Molecular Dependencies and Therapeutic Targets in NUP98-Rearranged Acute Myeloid Leukemia

Affiliations

KAT6A and KAT7 Histone Acetyltransferase Complexes Are Molecular Dependencies and Therapeutic Targets in NUP98-Rearranged Acute Myeloid Leukemia

Nicole L Michmerhuizen et al. Cancer Discov. .

Abstract

NUP98 fusion oncoproteins (FO) are a hallmark of childhood acute myeloid leukemia. NUP98 FOs drive leukemogenesis through phase-separated condensate formation and maintenance of an active chromatin landscape at stem cell-associated genes in cooperation with epigenetic regulators. In this study, we show that MYST family histone acetyltransferase (HAT) complex proteins, including KAT6A/MOZ, KAT7/HBO1, and the common KAT6A/7 complex subunit BRPF1, associate with NUP98 FOs on chromatin and within condensates. MYST HATs are molecular dependencies in NUP98-rearranged (NUP98-r) leukemia, and genetic inactivation or pharmacologic inhibition of KAT6A and KAT7 impairs NUP98-r cell fitness. KAT6A/7 inhibition decreased global H3K23ac levels, displaced NUP98::HOXA9 from chromatin at the Meis1 locus, and led to myeloid cell differentiation. Additionally, KAT6A/7 inhibition decreased leukemic burden in multiple NUP98-r leukemia xenograft mouse models, synergized with menin inhibitor treatment, and was efficacious in menin inhibitor-resistant cells. In summary, we show that MYST family HATs are therapeutically actionable dependencies in NUP98-r acute myeloid leukemia.

Significance: KAT6A and KAT7 associate with NUP98 FOs to drive leukemogenesis. Inhibition of their HAT activity is an effective therapeutic strategy in NUP98-r leukemias, including those resistant to menin inhibition. Moreover, combined KAT6A/7 and menin inhibition is synergistic, supporting clinical translation to improve outcomes for NUP98 FO-driven leukemias.


Conflict of interest statement

N.L. Michmerhuizen reports grants from the NCI during the conduct of the study. E.B. Heikamp reports grants from the NCI, the American Society of Hematology, the Charles H. Hood Foundation, the Children’s Cancer Research Fund, the Hyundai Hope on Wheels Foundation, and the Rose Family Fellowship during the conduct of the study. I. Iacobucci reports other support from Arima Genomics, Mission Bio, and Takara outside the submitted work. M. Umeda reports personal fees from AstraZeneca outside the submitted work. V. Subramanyam reports grants from the Dana-Farber Cancer Institute during the conduct of the study. D.V. Wenge reports grants from the Deutsche Forschungsgemeinschaft during the conduct of the study. S.B. Pounds reports grants from the US NIH during the conduct of the study. A. Kentsis reports that he is a consultant for Novartis, Rgenta, Blueprint, Syndax, and Sellas. H. Chi reports grants from the NIH during the conduct of the study as well as other support from Kumquat Biosciences and TCura Bioscience outside the submitted work and that he has a patent for patents/patent applications in the field of immunotherapy pending. J.M. Klco reports grants from the NCI during the conduct of the study. S.A. Armstrong reports personal fees from C4 Therapeutics, Neomorph, Stelexis Therapeutics, Hyku Biosciences, AstraZeneca, and Accent Therapeutics outside the submitted work and that he has a patent for menin inhibition (WO/2017/132398A1) issued and licensed. C.G. Mullighan reports personal fees from Illumina during the conduct of the study as well as grants from Pfizer and AbbVie outside the submitted work. No disclosures were reported by the other authors.

Figures
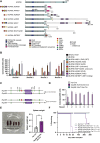
Figure 1.
Figure 1.
NUP98 FOs with diverse C-terminal partners transform mouse hematopoietic progenitors. A, Schematic of wild-type NUP98 and NUP98 FOs examined in this study. B, Lin HSPCs from wild-type C57Bl/6 mice were transduced with an empty vector, NUP98, or NUP98 FO, and CFU assays were performed. C, Schematic of conditional knock-in mouse models with Nup98::Kdm5a or Nup98::Nsd1 fusion. D, Lin HSPCs were isolated from Nup98::Kdm5a;Vav-Cre, Nup98::Nsd1;Vav-Cre, or wild-type Vav-Cre littermates, and CFU assays were performed. E, Image and quantification of spleens from 3-month-old Nup98::Kdm5a;Vav-Cre mice or wild-type Vav-Cre littermates. **, P < 0.01, paired t test. F, Survival curve for mice transplanted with lin HSPCs isolated from Nup98::Kdm5a;Vav-Cre, Nup98::Nsd1;Vav-Cre, or wild-type Vav-Cre littermates. Spleen cells from leukemic mice were transplanted into secondary and tertiary recipients. CML, chronicmyeloid leukemia; CMML, chronic myelomonocytic leukemia; FG, phenylalanine–glycine; GLFG, glycine–leucine–phenylalanine–glycine; GLEBS, Gle2-binding sequence; JMML, juvenile myelomonocytic leukemia; MDS, myelodysplastic syndrome; MPAL, mixed phenotype acute leukemia.
Figure 2.
Figure 2.
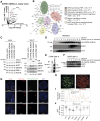
NUP98 FOs interact with MYST family HAT complex members. A, Volcano plot for enriched proteins in transiently transfected HEK293T cells expressing HA-NUP98::KDM5A compared with the empty vector. The fusion bait protein and significantly enriched associated proteins (adjusted P < 0.05) are labeled. Data with missing values in the empty vector were imputed; these appear as a distinct cluster of high log2 fold change values. The average log2 fold change of all three biological replicates was used for the plot. B, Search Tool for the Retrieval of Interacting analysis of enriched proteins (log2 fold change >1, adjusted P < 0.025) from RIME in transiently transfected HEK293T cells expressing HA-NUP98::KDM5A (compared with the empty vector). C, Western blot of input and IP samples for NUP98 FO interactors in transiently transfected HEK293T cells expressing the empty vector or HA-NUP98 FO. D, Western blot of glycerol gradient fractions from HEK293T cells transfected to express HA-NUP98::KDM5A. E, IP of CHRF-288-11 cells engineered to express HA-NUP98::KDM5A was performed using IgG and BRPF1 antibodies, followed by western blot for HA (FO), BRPF1, and KAT7. F, Western blot of glycerol gradient fractions from CHRF-288-11 cells engineered to express HA-NUP98::KDM5A. G, RNA FISH with mRNA probes targeting MEIS1 or HOXA/B loci in HEK293T cells transiently transfected to express GFP-NUP98::LNP1. Scale bar, 5 μm. Insets in merged images are 2X magnification of the original images. H–J, HEK293T cells were transiently transfected with GFP-tagged NUP98::LNP1, fixed with methanol, and stained for MYST family HAT complex members or associated histone modifications. Images were acquired by confocal microscopy. H, Example cell showing antibody fluorescence signals for GFP-NUP98::LNP1 in green and KAT6A in red. GFP condensate segmentation is shown with white outlines, and cell nuclear boundaries are shown with cyan outlines. The fluorescence intensities along the yellow lines were normalized and plotted in E. Scale bar, 5 μm. I, Line plot comparing normalized intensities of GFP and Rhodamine Red-X signals along the dotted lines shown in D. J, Quantification of Pearson correlation coefficient (PCC) values for GFP-NUP98::LNP1 vs. antibody RRX signals within GFP condensates. Values are shown for antibodies against the indicated proteins with each distinct point representing a single cell.
Figure 3.
Figure 3.
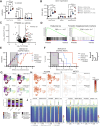
MYST family HAT complex members are molecular dependencies in NUP98-r cells. A, Schematic of in vivo epigenetic CRISPR screen. B, Volcano plot for enriched/depleted gRNAs in bone marrow and spleen cells of NUP98:KDM5A mice vs. spleen T-cell controls from the same animals. C, GSEA of enriched/depleted gRNAs. D, Schematic of BRPF1-containing HAT complexes and the primary histone H3 or H4 acetylation modifications that each mediates. E, Relative fitness of Nup98::Kdm5a;Vav-Cre;Cas9 HSPCs transduced with gRNAs targeting MYST family HAT complex members (marked with Ametrine) and placed in competition with similar cells transduced with nontargeting control gRNA (marked with GFP). Representative data are shown, and a second replicate is in Supplementary Fig. S4C. BM, bone marrow; MFI, mean fluorescence intensity. (D, Created in BioRender. Michmerhuizen, N. (2025) https://BioRender.com/vnflfko.)
Figure 4.
Figure 4.
Pharmacologic inhibition of KAT6A/7 with PF9363 results in the loss of acetylated histone H3 modifications and is effective in vitro and invivo. Volcano plots of histone PTMs identified by mass spectrometry after treatment of Nup98::Kdm5a;Vav-Cre-Cas9 HSPCs for 72 hours with (A) 1 μmol/L or (B) 10 nmol/L PF9363 vs. vehicle (DMSO). (C) NUP98::HOXA9, (D) NUP98::KDM5A, and (E) NUP98::NSD1 mouse leukemia cells were treated with the KAT6A/7 inhibitor PF9363 for 10 days, and viability was measured compared with vehicle (DMSO)-treated controls. CD11b expression was measured by flow cytometry and compared with vehicle (DMSO)-treated controls. F,Nup98::Kdm5a;Vav-Cre;Cas9 HSPCs were treated with increasing concentrations of PF9363 for 9 days, and viability was measured using a resazurin cell viability assay. G and H, CD34+ HSPCs transduced to express HA-NUP98::KDM5A were cultured in media containing vehicle (DMSO) or 100 nmol/L PF9363 for 19 days. G, Growth curve with mean ± SD and mixed linear model; **, P < 0.01. H, CD11b expression measured by flow cytometry at day 19. Mean ± SD and unpaired t test; *, P > 0.05. Experiments were performed in technical triplicate; representative data from one of two biological replicates (different CD34+ cell donors) are shown. I, Total ventral flux was monitored over time for mice bearing luciferase-marked SJCML068699 (NUP98::HOXA13) PDX (n = 10/group) and treated with vehicle or PF9363 (3 mg/kg, 5 days on, 2 days off, intraperitoneally) for 6 weeks. J, Survival curve for mice bearing NTPL511 (NUP98::NSD1) PDX (n = 5/group) treated with vehicle or PF9363 (3 mg/kg, daily, intraperitoneally) for 4 weeks. For mice bearing MSKG5191 (NUP98::NSD1) PDX, human CD45 was monitored over time in the (K) peripheral blood and at the end of the 4-week treatment in the (L) bone marrow and (M) spleen. N, Spleen weight for MSKG5191 PDX-bearing mice at the end of treatment. For L and M, mean ± SD are shown, and using an unpaired t test, *, P > 0.05; **, P < 0.01.
Figure 5.
Figure 5.
KAT6A/7 and menin inhibition have synergistic effects in NUP98-r cells. A,Nup98::Kdm5a;Vav-Cre;Cas9 HSPCs were treated with PF9363, SNDX-5613, or a combination for 9 days, and viability was measured relative to vehicle (DMSO)-treated controls by flow cytometry for DAPI. B, CFU assay for Nup98::Kdm5a;Vav-Cre lin HSPCs treated with DMSO, 1 μmol/L PF9363, 1 μmol/L SNDX-5613, or a combination. NUP98::HOXA9 mouse leukemia cells were treated with PF9363, SNDX-5613, or a combination for 10 days, and (C) viability (using DAPI staining) or (D) CD11b expression was measured by flow cytometry relative to vehicle (DMSO)-treated controls. RLU, relative light units. MFI, mean fluorescence intensity.
Figure 6.
Figure 6.
KAT6A/7 and menin inhibition alter gene expression and remodel chromatin in NUP98-r cells. A, HEK293T cells transfected to express GFP-NUP98::LNP1 were treated with DMSO, 1 μmol/L SNDX-5613, 1 μmol/L PF9363, or a combination for 24 hours, and images were acquired by confocal microscopy. Scale bar, 5 μm. B, Volcano plot showing differentially expressed genes in RNA-seq samples from NUP98::HOXA9 mouse leukemia cells treated for 72 hours with 2 μmol/L SNDX-5613, 500 nmol/L PF9363, or a combination relative to vehicle (DMSO)-treated cells. C, Heatmap showing z-scores for genes with greater than 1.5 log2 fold change after PF9363 treatment in NUP98::HOXA9 mouse leukemia cells constitutively expressing Cas9 and transduced with gRNAs for Brpf1, Kat6a, Kat6b, or Kat7. D, Hockeystick plots depict log2 fold ratios of chromatin occupancy for each ChIP target after a 72-hour treatment with 2 μmol/L SNDX-5613 and 500 nmol/L PF9363 with gene rank ordered by chromatin occupancy. Targets with gene expression changes greater than a 1.5 log2 fold change reduction after treatment are highlighted in red. Common targets in HA, BRPF1, and KMT2A ChIP experiments are annotated. Representative data from n = 3 independent experiments are shown. E, ChIP-qPCR at the Meis1 locus for HA (NUP98::HOXA9), KMT2A, and BRPF1 in NUP98::HOXA9 mouse leukemia cells after a 72-hour treatment with DMSO, 2 μmol/L SNDX-5613, 500 nmol/L PF9363, or a combination. Mean ± SD by two-way ANOVA and Tukey multiple comparison test; *, P > 0.05; **, P < 0.01; ***, P < 0.001; and ****, P < 0.0001. NT, non-targeting.
Figure 7.
Figure 7.
KAT6A/7 and menin inhibition have combinatorial effects in vivo. Mice bearing CPCT0021 (NUP98::KDM5A) PDX cells were treated for 30 days with vehicles, PF9363 (3 mg/kg, QD, IP), SNDX-5613 (chow), or a combination. A, Human CD45 or (B) CD41 expression was measured at the end of treatment in the bone marrow, spleen, and peripheral blood. Statistical comparisons were performed using two-way ANOVA. C, Volcano plot showing differentially expressed genes in RNA-seq samples from vehicle or PF9363-treated mice. D, GSEA showing upregulation of Heikamp Up and Tenedini Megakaryocyte Markers gene sets in NUP98::KDM5A PDX cells after PF9363 treatment. E–J, Mice bearing MSKG5191 (NUP98::NSD1) PDX cells were treated with vehicles, PF9363 (3 mg/kg, daily, intraperitoneally), SNDX-5613 (75 mg/kg, twice a day, orally), or a combination. E, Human CD45 was monitored over time in the peripheral blood during and after treatment for 4 weeks (5 days on, 2 days off). F, Survival curve for NUP98::NSD1 PDX-bearing mice during and after treatment for 4 weeks (5 days on, 2 days off). Statistical comparison was performed using the Mantel–Cox test. G–I, scRNA-seq was performed using the 10x Genomics 5′ technology in spleen samples from n = 2 mice per treatment arm (pooled samples). G, Uniform Manifold Approximation and Projection for Dimension Reduction projection with clustering based on cell type and a bar plot showing the proportion of cells from each treatment group in each cluster. Cells that were not assigned to a cluster were omitted from this analysis/plot. BFU-E, burst forming unit-erythroid; HSC, hematopoietic stem cell; LMPP, lymphoid-primed multipotent progenitor; MEP, megakaryocyte-erythroid progenitor; MkEry, megakaryocyte erythroid; Mono, monocyte; MPP, multipotent progenitor; MyLy, myeloid lymphoid; Neut, neutrophil; Prog, progenitors; ProMono, promonocyte. Uniform Manifold Approximation and Projection for Dimension Reduction plots colored according to (H) HOXA9 and (I) MEIS1 expression between treatment arms. J, ATAC-seq was performed on human leukemia cells isolated from the spleens of MSKG5191 PDX-bearing mice after a 5-day treatment with vehicle, SNDX-5613, PF9363, or a combination. Tornado plots show regions with differentially increased (left) and differentially decreased (right) accessibility between vehicle and treated samples. “Shared” refers to those changes in accessibility observed when comparing both vehicle to PF9363 as well as when comparing vehicle to PF9363 + SNDX-5613. For all panels, *, P > 0.05; **, P < 0.01; ***, P < 0.001; ****, P < 0.0001. MFI, mean fluorescence intensity. ns, not signficant.

References

    1. Hollink IH, van den Heuvel-Eibrink MM, Arentsen-Peters STCJM, Pratcorona M, Abbas S, Kuipers JE, et al. NUP98/NSD1 characterizes a novel poor prognostic group in acute myeloid leukemia with a distinct HOX gene expression pattern. Blood 2011;118:3645–56. - PubMed
    1. Iacobucci I, Wen J, Meggendorfer M, Choi JK, Shi L, Pounds SB, et al. Genomic subtyping and therapeutic targeting of acute erythroleukemia. Nat Genet 2019;51:694–704. - PMC - PubMed
    1. Noort S, Wander P, Alonzo TA, Smith J, Ries RE, Gerbing RB, et al. The clinical and biological characteristics of NUP98-KDM5A in pediatric acute myeloid leukemia. Haematologica 2021;106:630–4. - PMC - PubMed
    1. Bolouri H, Farrar JE, Triche T Jr, Ries RE, Lim EL, Alonzo TA, et al. The molecular landscape of pediatric acute myeloid leukemia reveals recurrent structural alterations and age-specific mutational interactions. Nat Med 2018;24:103–12. - PMC - PubMed
    1. de Rooij JDE, Hollink IHIM, Arentsen-Peters STCJM, van Galen JF, Berna Beverloo H, Baruchel A, et al. NUP98/JARID1A is a novel recurrent abnormality in pediatric acute megakaryoblastic leukemia with a distinct HOX gene expression pattern. Leukemia 2013;27:2280–8. - PubMed

MeSH terms