. 2025 Dec;14(1):2521392.
doi: 10.1080/2162402X.2025.2521392. Epub 2025 Jun 19.

Cancer cells accelerate exhaustion of persistently activated mouse CD4+ T cells

Affiliations

Cancer cells accelerate exhaustion of persistently activated mouse CD4+ T cells

Malgorzata Stachowiak et al. Oncoimmunology. 2025 Dec.

Abstract

Most exhaustion studies have focused on CD8+ T cells. Here, we demonstrated reciprocal growth inhibition of CD4+ T cells and colorectal cancer cells, which induced the expression of PD-1, PD-L1, and PD-L2 in CD4+ T cells. The accelerated exhaustion of CD4+ T cells was evidenced by the reduced secretion of several cytokines, including IL-2, IFN-γ, or TNFα, and elevated secretion of CXCL family chemokines. Progressive expression of PD-L1, CTLA4, and IDO1 exhaustion markers occurred concomitantly with tumor growth in vivo in a mouse model. The pattern of CD4+ T cell exhaustion was analogous to that observed in CD8+ T cells, although with altered dynamics. The PD-L1-high phenotype can be induced by co-culture with tumor cells and is mediated by secreted factors in addition to cell contact. Our findings revealed that IFN-γ receptor knockout T cells exhibited PD-L1 protein expression when cultured with tumor cells, suggesting that PD-L1 expression is not fully dependent on IFN-γ. The TIL population undergoing exhaustion due to persistent antigen stimulation in the presence of cancer cells gradually acquires an immunosuppressive phenotype. The accumulation of inhibitory signals exerted by both cancer cells and T cells, which had converted to a suppressive phenotype, accelerated T cell exhaustion.

Keywords: CD4+ T cell exhaustion; PD-L1 expression; mouse colorectal cancer cells.


Conflict of interest statement

No potential conflict of interest was reported by the author(s).

Figures
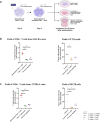
Figure 1.
Figure 1.
Murine CD4+ T cells and cancer cells exert mutual inhibition of growth when cultured together. (a) A schematic diagram of mouse CD4+ T cells stimulation and co-culture with cancer cells. (b) yield of CD4+ T cells isolated from BALB/c mouse and CT26 cancer cells in three experimental groups, normalized to the number of seeded cells. (c) yield of CD4+ T cells isolated from C57BL/6 mouse and MC38 cancer cells in three experimental groups, normalized to the number of seeded cells. Two-way ANOVA with post hoc Dunnett’s correction was used for statistic analysis (**** < 0.0001, *** < 0.001, ** < 0.01, * < 0.05).
Figure 2.
Figure 2.
Expression of exhaustion markers on CD4+ T cells after co-culture of persistently stimulated lymphocytes isolated from C57BL/6 mouse spleen with MC38 cells and BALB/c mouse spleen with CT26 cells. (a and b) the proportion of cells exhibiting the expression of surface markers, PD-L1, PD-1, and PD-L2, in three groups of CD4+ T cells derived from C57BL/6 (A) or BALB/c (B) mice: restimulated CD4+ T cells cultured in the absence of cancer cells; CD4+ T cells/cancer, cultured in the presence of cancer cells; paracrine signaling group, cultured with cancer cells with transwell membrane. (c and d) bar graphs with MFI of specific exhaustion markers in three experimental groups of C57BL/6 CD4+ T cells cultured with MC38 cells (C) or BALB/c CD4+ T cells cultured with CT26 cells (D). MFI, median fluorescence intensity. Two-way ANOVA with post hoc Dunnett’s correction was used for statistic analysis (**** < 0.0001, *** < 0.001, ** < 0.01, * < 0.05).
Figure 3.
Figure 3.
In vivo experiment confirming the involvement of PD-L1 protein in the exhaustion process in CD4+ T cells. (a) Schematic diagram of in vivo experiments. (b) MFI of selected exhaustion markers in C57BL/6 mice, inoculated with MC38 cells and BALB/c mice, inoculated with CT26 cells. Comparison of MFI was conducted between small vs medium tumor or small vs large tumor, from two separate experiments, n = 6. (c) histograms of PD-L1 MFI from flow cytometry analysis, visualizing difference in PD-L1 expression among three groups of harvested tumors, with FMO as a background. (d) MFI of selected exhaustion markers expressed on the splenic T cells, isolated from tumor-bearing mice C57BL/6 and BALB/c. MFI – median fluorescent intensity; FMO – fluorescence minus one. Two-way ANOVA with post hoc Tukey’s correction was used for statistic analysis (**** < 0.0001, *** < 0.001, ** < 0.01, * < 0.05).
Figure 4.
Figure 4.
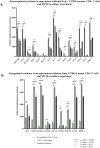
Identification of the paracrine agents responsible for the CD4+ T cell exhaustion mechanism. Cytokine array performed on the supernatant from three experimental groups: restimulated CD4+ T cells cultured in the absence of cancer cells; CD4+ T cells + cancer, cultured in the presence of cancer cells; paracrine signaling group, cultured with cancer cells with transwell membrane; (a) Downregulated cytokines in the supernatants of the same three groups; (b) upregulated cytokines in the supernatant from three experimental groups. Two-way ANOVA with post hoc Bonferroni’s correction was used for statistic analysis (**** < 0.0001, *** < 0.001, ** < 0.01, * < 0.05).
Figure 5.
Figure 5.
Expression of exhaustion markers after co-culture of MC38 cancer cells with CD4+ T cells derived from C57BL/6 IFN-γ receptor knockout mouse in comparison with wild type mouse. Flow cytometry analysis of MHC I (a) MHC II (b) and PD-L1 (c) expression on CT26 and MC38 colorectal cancer cell lines after IFN-γ treatment (gray: unstained; light purple: w/o IFN-γ; dark purple: w/IFN-γ). (d) reduction of a number of T cells in three experimental groups, restimulated, co-culture and paracrine signaling, after persistent stimulation with antigen from (left, grey) in wild type mice or (right, violet) IFNR-KO mice. (e) inhibition of cancer cell growth in three experimental groups, restimulated, co-culture and paracrine signaling, after co-culture with T cells from (left, grey) in wild type mice or (right, violet) in IFNR-KO mice. (f) MFI of exhaustion markers and established from flow cytometry analysis after 10 days of CD4+ T cells from the experiment on wild type mice (left, grey) or on IFNR K/O mice (right, violet); n = 3. MFI – median fluorescence intensity; K/O – knockout. Two-way ANOVA with post hoc Dunnett’s correction was used for statistic analysis (**** < 0.0001, *** < 0.001, ** < 0.01, * < 0.05).
Figure 6.
Figure 6.
Comparison of T cells and their surface markers on TIL markers from different size of CT26 and MC38 tumors. TILs were harvested when the tumor reached targeted volume. Independent populations and marker MFI of TILs were measured by flow cytometry. Heatmaps were generated from flow cytometry data of each mice (n = 6). Each column represents an individual mouse. (a) Percentages of immune cell populations from a parent population (live cells, CD4+ T cells, CD8+ T cells). (b) statistical analysis of immune cell population (Figure 6a). (c) MFI of markers within immune cell populations – CD4+ T cells or CD8+ T cells; frequency is row-scaled for enhanced visual differentiation; MFI – median fluorescence intensity. (d) statistical analysis of MFI of specific markers (Figure 6c). In both analyses two-way ANOVA with post hoc Tukey’s correction was used (**** < 0.0001, *** < 0.001, ** < 0.01, * < 0.05).

Similar articles

References

    1. Pardoll DM. The blockade of immune checkpoints in cancer immunotherapy. Nat Rev Cancer. 2012;12(4):252–17. doi: 10.1038/nrc3239. - DOI - PMC - PubMed
    1. Taube JM, Anders R, Young GD, Xu H, Sharma R, McMiller TL, Chen S, Klein AP, Pardoll DM, Topalian SL. et al. Colocalization of inflammatory response with B7-H1 expression in human melanocytic lesions supports an adaptive resistance mechanism of immune escape. Sci Transl Med. 2012;4(127):1–22. doi: 10.1126/scitranslmed.3003689. - DOI - PMC - PubMed
    1. Balkhi MY. Receptor signaling, transcriptional, and metabolic regulation of T cell exhaustion. Oncoimmunology. 2020;9(1). doi: 10.1080/2162402X.2020.1747349. - DOI - PMC - PubMed
    1. Blank CU, Haining WN, Held W, Hogan PG, Kallies A, Lugli E, Lynn RC, Philip M, Rao A, Restifo NP, et al. Defining ‘T cell exhaustion. Nat Rev Immunol. 2019;19(11):665–674. doi: 10.1038/s41577-019-0221-9. - DOI - PMC - PubMed
    1. Wherry EJ, Kurachi M. Molecular and cellular insights into T cell exhaustion. Nat Rev Immunol. 2015;15(8):486–499. doi: 10.1038/nri3862. - DOI - PMC - PubMed

LinkOut - more resources