. 2025 Aug;12(29):e04192.
doi: 10.1002/advs.202504192. Epub 2025 Jun 19.

Ezetimibe Engineered L14-8 Suppresses Advanced Prostate Cancer by Activating PLK1/TP53-SAT1-Induced Ferroptosis

Affiliations

Ezetimibe Engineered L14-8 Suppresses Advanced Prostate Cancer by Activating PLK1/TP53-SAT1-Induced Ferroptosis

Yu Zhang et al. Adv Sci (Weinh). 2025 Aug.

Abstract

Androgen receptor signaling inhibitors (ARSIs) have demonstrated a survival benefit in metastatic prostate cancer. However, patients taking these agents inevitably acquire resistance and even develop neuroendocrine prostate cancer (NEPC), in which stage the AR signaling is inactive, and therapies are limited for these lethal cases. Therefore, developing novel treatments independent of the AR signaling pathway is urgently needed. Here it is reported that L14-8, a small molecule is derived and optimized from ezetimibe, a marketed drug primarily used for intestinal cholesterol and phytosterol absorption, significantly suppresses cell growth in advanced prostate cancer by inducing ferroptosis. Mechanistically, L14-8 binds to and promotes the ubiquitin-mediated PLK1 degradation, resulting in an increase of downstream TP53 protein phosphorylation, which is further enriched at the promoter of SAT1, a well-established ferroptosis inducer, and boosting SAT1 transcription thus triggers ferroptosis-mediated cancer cell death. Importantly, in vivo studies further demonstrate a potent anti-tumor efficacy of L14-8 without obvious toxicity. Overall, this study develops a novel small molecular engineered from ezetimibe for treating lethal prostate cancer in an AR-independent manner and provides mechanistic insights into its action by triggering PLK1-TP53-SAT1 axis-mediated ferroptosis in lethal PCa models independent of the AR signaling pathway.

Keywords: SAT1; TP53; drug design and optimization; ferroptosis; prostate cancer.


Conflict of interest statement

F.Y., W.Z., Y. Z., and X.S. are co‐inventors on a patent filed by Shanghai University of Traditional Chinese Medicine that relates to the research reported in this paper. The remaining authors declare no competing interests.

Figures
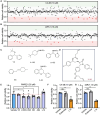
Figure 1
Figure 1
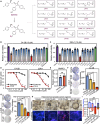
Screening of anti‐prostate cancer agents in vitro with small‐molecule library. A,B) Prostate cancer cells in C4‐2B and 22Rv1 cells were plated in 96 well plates and indicated agents were added at the concentration of 10 µm and incubated for 48 h, the cell viability was determined with a CCK‐8 kit. Marked in the red star indicates the cell growth inhibition effect of the indicated agent is consistent in both C4‐2B and 22Rv1. n = 3. (C,D) The structures of six agents showed tumor cell growth inhibition effects in both C4‐2B and 22Rv1. E–G) The impact of 25 µm of Y8, A182, A193, B5, A94, and L14 on normal prostate RWPE1 cell (E) and the impact of 10 µm of ezetimibe on C4‐2B and 22Rv1 cell viability determined by the CCK‐8 kit. **, p < 0.01, * p < 0.05.
Figure 2
Figure 2
Structural optimization of Ezetimibe‐based anti‐tumor agents. A) Structures of optimized agents derived from L14 and Ezetimibe. B,C) Prostate cancer cells C4‐2B (B) and 22Rv1 (C) were plated in 96 well plates and indicated agents were added at the concentration of 10 µm and incubated for 48 h, the cell viability was determined with a CCK‐8 kit. D,E) The impact of different dosages of L14‐8 in CRPC cells C4‐2B and 22Rv1 (E) and normal prostate RWPE1 cells (E) was determined by the CCK‐8 kit. F,G) Colony formation assays to determine the impact of different doses of L14‐8 on the survival ability of C4‐2B (F) and 22Rv1 (G). H,I) Patient‐derived prostate cancer organoids were treated with indicated agents, and the morphology and viability were detected by brightfield imaging and staining with PI (red, dead) and Hoechst (blue, alive) fluorescence dye, respectively. The relative organoid viability was statistically analyzed as shown in the right panel (I), n = 3. ns, not significant, **, p < 0.01.
Figure 3
Figure 3
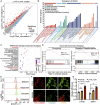
Transcriptome analysis reveals that L14‐8 induced ferroptosis in prostate cancer. A) RNA sequencing to character the differential expression genes (DEGs) after L14‐8 treatment in the prostate cancer cell model. B) Histograms of the gene count that fall into different KEGG pathways. C,D) Differential gene enrichment analysis and GSEA analysis of DEGs after the L14‐8 treatment highlighted the significance of ferroptosis. E,F) flow cytometry analysis (E) and microscope image analysis of BODIPY‐C11 after cells were treated with L14‐8. G) The MDA level after indicated cells were treated with different dosages of L14‐8 was determined with the Lipid Peroxidation MDA Assay Kit after cells were treated for 48 h. ns, not significant, **, p < 0.01.
Figure 4
Figure 4
L14‐8‐induced SAT1 transcriptional activation triggered ferroptosis. A) CCK‐8 assays were employed to determine the rescue effect of ferr‐1 on L14‐8 treatment‐induced cell growth inhibition in C4‐2B and 22Rv1 cells. B,C) RNA‐seq analysis of ferroptosis‐related gene expression analysis after L14‐8 treatment. D) Protein–protein interaction (PPI) analysis of DEGs with TP53. E) RT‐qPCR analysis of ferroptosis‐related gene expression analysis after L14‐8 treatment. F,G) The expression correlation of SAT1 with Glasson score (F) and patient survival (G) in MSK prostate cancer cohort. H,I) Gene ablation efficiency of different gRNAs corresponding to CRISPR‐Cas13 targeting SAT1. J,K) Cell viability was determined by CCK‐8 assays after SAT1 was knocked down and treated with L14‐8 in C4‐2B (H) and 22Rv1 (I) cells. **, p < 0.01.
Figure 5
Figure 5
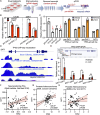
Short TP53 is indispensable for L14‐8‐induced SAT1 transcriptional activation. A) Flow diagram to generate premature mRNA (pre‐mRNA) library for pre‐SAT1 detection. B) RT‐qPCR to detect the relative pre‐SAT1 mRNA expression after cells were treated with L14‐8. C) The left panel indicated the knockdown efficiency of different gRNAs corresponding to CRISPR‐Cas13 targeting TP53, and the middle and right panels showed the expression of pre‐SAT1 and SAT1 in TP53 ablated cells after being treated with L14‐8. D) TP53 ChIP‐seq visualization of the enrichment of TP53 on the promoter of SAT1 in different cancer cell models. E) ChIP qPCR to determine the enrichment of TP53 on SAT1 promoter after treated with L14‐8. The upper panel shows the location of primers used for ChIP qPCR analysis. F–H) Expression correlation analysis of TP53 and SAT1 in different prostate cancer cohorts. ns, not significant, ***, p < 0.001, **, p < 0.01.
Figure 6
Figure 6
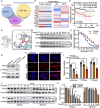
L14‐8 binds to PLK1 and promotes TP53 expression and phosphorylation. A) L14‐8 targets prediction and correlation analysis of TP53‐associated proteins. B) The relative expression of the top 20 L14‐8 predicted targets in prostate tumor versus adjacent prostate tissues and their correlation with overall survival (OS) and disease‐free survival (DFS) in the TCPG‐PRAD cohort. C) DFS analysis of PLK1 with MSK prostate cancer cohort. D) Molecular docking of PLK1 with L14‐8, the binding energy is −5 kJ mol−1. E,F) CETSA assay to determine the thermal stability of PLK1 after cells were treated with L14‐8. The left panel shows the representative western blot images and the right shows the statistical analysis of three independent experiments. G) Western blot to evaluate the impact of L14‐8 on the protein expression of PLK1, TP53, and the phosphorylation of TP53. H) Microscope image to visualize the protein expression and localization of TP53 after cells were treated with L14‐8. I) Cell viability was detected with CCK‐8 kit after cells transfected with TP53‐targeted CIRSPR‐Cas13 were treated with indicated dosages of L14‐8 for 72 h. J,K) C4‐2B cells were treated with Cycloheximide (CHX, 40 µm), L14‐8 (10 µm), and MG132 (40 µm) for the indicated time, cells were then collected for western blot analysis with PLK1 and vinculin antibodies. ns, not significant, **, p < 0.01.
Figure 7
Figure 7
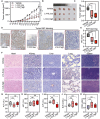
The anti‐tumor growth effect and potential toxicity of L14‐8 in C4‐2B xenografted nice model. A) Tumor volume after mice were treated with different doses of L14‐8 for indicated times. B,C) Tumor images (B) and tumor weight (C). D,E) representative images (D) and statistical analysis (e) of Ki67 staining of prostate tumors in different groups. F–H) Representative images of H&E staining of indicated major organs (F) and statistical analysis of the liver and kidney indicators including ALT, AST, ALP, BUN, and CREA G–K) after the mice were treated with different doses of L14‐8 for 25 days. n = 5, ns, not significant, ***, p < 0.001, **, p < 0.01.

References

    1. Sung H., Ferlay J., Siegel R. L., Laversanne M., Soerjomataram I., Jemal A., Bray F., CA Cancer J. Clin. 2021, 71, 209. - PubMed
    1. Chung C., Abboud K., Am. J. Health Syst. Pharm. 2022, 79, 1224. - PubMed
    1. Verma S., Prajapati K., Kushwaha P., Shuaib M., Singh A., Kumar S., Gupta S., Cancer Drug Resist. 2020, 3, 742. - PMC - PubMed
    1. Feng Q., He B., Front. Oncol. 2019, 9, 858. - PMC - PubMed
    1. Chen Y., Zhou Q., Hankey W., Fang X., Yuan F., Cell Death Dis. 2022, 13, 632. - PMC - PubMed

MeSH terms

LinkOut - more resources