. 2025 Aug;12(30):e00225.
doi: 10.1002/advs.202500225. Epub 2025 Jun 19.

Nanoparticle-Mediated CXCL12-CXCR4 Inhibition Reprograms Macrophages and Suppresses Gastric Carcinoma

Affiliations

Nanoparticle-Mediated CXCL12-CXCR4 Inhibition Reprograms Macrophages and Suppresses Gastric Carcinoma

Qianqian Cao et al. Adv Sci (Weinh). 2025 Aug.

Abstract

Gastric carcinoma (GC) remains a major global health challenge, requiring novel therapeutic approaches. This study investigates the efficacy of self-assembled M2pep-Cs NPs/Plerixafor nanoparticles in suppressing GC by targeting the CXCL12-CXCR4 signaling pathway and reprogramming tumor-associated macrophages (TAMs) to enhance anti-tumor immunity. The nanoparticles' physicochemical properties and biocompatibility are assessed using transmission electron microscopy, dynamic light scattering, and biological assays. A GC mouse model is established, followed by histological and immunohistochemical analyses to evaluate tumor apoptosis and proliferation. Multi-omics approaches, including transcriptomics, proteomics, and metabolomics, identify key genes and pathways affected by treatment. Flow cytometry and ELISA quantify immune activation markers; while, cell migration and invasion assays evaluate tumor suppression effects. The results demonstrate that M2pep-Cs NPs/Plerixafor effectively modulates the tumor microenvironment, suppressing GC progression by reprogramming TAMs through CXCL12-CXCR4 inhibition, enhancing immune recognition and T cell responses. This study provides mechanistic insights and highlights the potential of nanoparticle-based immunotherapy for GC, offering a promising avenue for clinical translation.

Keywords: CXCL12–CXCR4 signaling pathway; M2pep‐Cs NPs/plerixafor nanoparticles; gastric carcinoma; immunotherapy; macrophage reprogramming.


Conflict of interest statement

The authors declare no conflict of interest.

Figures

Figure 1
Figure 1
Preparation and characterization of M2pep‐Cs NPs/Plerixafor nanoparticles. Note: A) Schematic diagram of the preparation process for M2pep‐Cs NPs/Plerixafor nanoparticles (Created by BioRender); B) TEM images of Cs NPs, M2pep‐Cs NPs, and M2pep‐Cs NPs/Plerixafor nanoparticles, scale bar: 50 nm; C) average hydrodynamic diameter of Cs NPs, M2pep‐Cs NPs, and M2pep‐Cs NPs/Plerixafor nanoparticles; and D) zeta potential of Cs NPs, M2pep‐Cs NPs, and M2pep‐Cs NPs/Plerixafor nanoparticles. Each experiment was repeated three times, and values are presented as mean ± standard deviation.
Figure 2
Figure 2
Potential pathways for inhibiting GC identified through multi‐omics data analysis of M2pep‐Cs NPs/Plerixafor nanoparticles. Note: A) Volcano plot of differentially expressed genes between GC and M2pep‐Cs NPs/Plerixafor groups based on high‐throughput sequencing data from 3 GC and 3 M2pep‐Cs NPs/Plerixafor mouse tumor tissues; B) heatmap of differentially expressed genes between GC and M2pep‐Cs NPs/Plerixafor groups based on high‐throughput sequencing data from 3 GC and 3 M2pep‐Cs NPs/Plerixafor mouse tumor tissues; C) LASSO algorithm selected nine feature genes; D) SVM‐RFE algorithm selected ten feature genes; E) Venn diagram showing the intersection of 1 gene identified by both machine learning methods; F) GO enrichment bubble chart for differentially expressed genes between GC and M2pep‐Cs NPs/Plerixafor groups based on high‐throughput sequencing data from 3 GC and 3 M2pep‐Cs NPs/Plerixafor mouse tumor tissues; G) KEGG enrichment bubble chart for differentially expressed genes between GC and M2pep‐Cs NPs/Plerixafor groups based on high‐throughput sequencing data from 3 GC and 3 M2pep‐Cs NPs/Plerixafor mouse tumor tissues; H) Venn diagram of 1 protein identified by intersecting results from two machine learning methods based on proteomics sequencing data; and I) KEGG pathway analysis of 27 differentially expressed metabolites based on metabolomics data.
Figure 3
Figure 3
Effect of M2pep‐Cs NPs/Plerixafor nanoparticles on the CXCL12–CXCR4 signaling pathway. Note: A) Western blot analysis of CXCL12 and CXCR4 protein expression levels in RAW264.7 cells (Created by BioRender); B) RT‐qPCR analysis of CXCL12 and CXCR4 mRNA expression levels in RAW264.7 cells; C) immunofluorescence staining of CXCL12 expression in RAW264.7 cells, scale bar: 25 µm; D) immunofluorescence staining of CXCR4 expression in RAW264.7 cells, scale bar: 25 µm; and E) ELISA analysis of CXCL12 and CXCR4 protein levels in RAW264.7 cell culture supernatants. Each experiment was repeated three times, and values are presented as mean ± standard deviation. Multiple group comparison using one‐way ANOVA, ***p < 0.001.
Figure 4
Figure 4
Impact of M2pep‐Cs NPs/Plerixafor nanoparticles on TAM polarization via the CXCL12–CXCR4 signaling pathway. Note: A) Schematic representation of TAM polarization (Created by BioRender); B) RT‐qPCR analysis of mRNA levels of CD80, IL‐1β, IL‐6, CD206, and IL‐10 in RAW264.7 cells in different groups; C) flow cytometry analysis of CD80 expression in RAW264.7 cells in different groups; D) flow cytometry analysis of CD206 expression in RAW264.7 cells in different groups; E) immunofluorescence detection of iNOS protein expression in RAW264.7 cells in different groups, scale bar: 25 µm; and F) immunofluorescence detection of ARG1 protein expression in RAW264.7 cells in different groups, scale bar: 25 µm. Each experiment was repeated three times, and values are presented as mean ± standard deviation. Multiple group comparison using one‐way ANOVA, **p < 0.01, and ***p < 0.001.
Figure 5
Figure 5
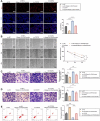
M2pep‐Cs NPs/Plerixafor nanoparticles inhibit the CXCL12–CXCR4 signaling pathway, reprogramming TAMs and enhancing the immune system's response to GC cells. Note: A) Edu immunofluorescence staining to assess MFC cell proliferation, scale bar: 50 µm; B) wound healing assay to measure the migration speed of MFC cells, scale bar: 100 µm; C) Transwell assay to evaluate MFC cell migration, scale bar: 50 µm; D) Transwell assay to assess MFC cell invasion, scale bar: 50 µm; and E) flow cytometry analysis of MFC cell apoptosis. Each experiment was repeated three times, and values are presented as mean ± standard deviation. Multiple group comparisons were conducted using one‐way ANOVA; while, data from different time points were analyzed using two‐way ANOVA, *p < 0.05, **p < 0.01, and ***p < 0.001.
Figure 6
Figure 6
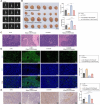
M2pep‐Cs NPs/Plerixafor nanoparticles inhibit tumor growth in GC mouse models. Note: A) In vivo imaging of tumor growth in different groups of mice; B) tumor images and measurements of tumor volume and weight in each group of mice; C) H&E staining of tumor tissue morphology and structure in each group, scale bar: 50 µm; D) TUNEL staining to assess apoptosis in tumor tissues of each group, scale bar: 50 µm; and E) immunohistochemical analysis of Ki67 expression in tumor tissues of each group, scale bar: 50 µm. Each group consisted of six mice, and values are presented as mean ± standard deviation. Multiple group comparisons were conducted using one‐way ANOVA, ***p < 0.001.
Figure 7
Figure 7
Impact of M2pep‐Cs NPs/Plerixafor nanoparticles on the CXCL12–CXCR4 signaling pathway. Note: A) Western blot analysis of CXCL12 and CXCR4 protein expression levels in mouse tumor tissues; B) RT‐PCR analysis of CXCL12 and CXCR4 mRNA expression levels in mouse tumor tissues; C) immunofluorescence staining of CXCL12 expression in mouse tumor tissues, scale bar: 50 µm; D) immunofluorescence staining of CXCR4 expression in mouse tumor tissues, scale bar: 50 µm; and E) ELISA analysis of CXCL12 and CXCR4 protein levels in tumor tissues. Each group consisted of six mice, and values are presented as mean ± standard deviation. Multiple group comparisons were conducted using one‐way ANOVA, ***p < 0.001.
Figure 8
Figure 8
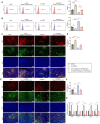
Effect of M2pep‐Cs NPs/Plerixafor nanoparticles on the reprogramming of TAMs via inhibition of the CXCL12–CXCR4 signaling pathway. Note: A) Flow cytometry analysis of CD80 expression in tumor tissues from each group of mice; B) flow cytometry analysis of CD206 expression in tumor tissues from each group of mice; C,D) immunofluorescence staining of iNOS protein expression in tumor tissues from each group of mice, scale bar: 50 µm; E,F) immunofluorescence staining of ARG1 protein expression in tumor tissues from each group of mice, scale bar: 50 µm; G) RT‐qPCR analysis of IL‐1β, IL‐6, TNFα, CD206, and IL‐10 mRNA levels in tumor tissues from each group of mice. Each group consisted of six mice, and values are presented as mean ± standard deviation. Multiple group comparisons were conducted using one‐way ANOVA, *p < 0.05, **p < 0.01, ***p < 0.001.

References

    1. Misawa S., Denda T., Kodama S., Suzuki T., Naito Y., Kogawa T., Takada M., Suichi T., Shiosakai K., Kuwabara S., Saito G., Hino A., Imanishi S., Ureshino N., Satomi D., Tanabe Y., Hanaoka Y., Miyamoto A., Suzuki T., Naganuma A., Yanagita Y., Sekine K., Kusano F., Nakamura M., Imazeki H., BMC Cancer 2023, 23, 1098. - PMC - PubMed
    1. Griger J., Widholz S. A., Jesinghaus M., de Andrade Krätzig N., Lange S., Engleitner T., Montero J. J., Zhigalova E., Öllinger R., Suresh V., Winkler W., Lier S., Baranov O., Trozzo R., Ben Khaled N., Chakraborty S., Yu J., Konukiewitz B., Steiger K., Pfarr N., Rajput A., Sailer D., Keller G., Schirmacher P., Röcken C., Fagerstedt K. W., Mayerle J., Schmidt‐Supprian M., Schneider G., Weichert W., et al., Cancer Cell 2023, 41, 1327. - PubMed
    1. Chen Y. I‐C., Malfertheiner P., Yu H.‐T., Kuo C.‐L., Chang Y.‐Y., Meng F.‐T., Wu Y.‐X., Hsiao J.‐L., Chen M. J., Lin K. P., Wu C. Y., Lin J. T., O'Morain C., Megraud F., Lee W. C., El‐Omar E. M., Wu M. S., Liou J. M., Gastroenterology 2024, 166, 605. - PubMed
    1. Sung H., Ferlay J., Siegel R. L., Laversanne M., Soerjomataram I., Jemal A., Bray F., CA: Cancer J. Clin. 2021, 71, 209. - PubMed
    1. Bray F., Laversanne M., Sung H., Ferlay J., Siegel R. L., Soerjomataram I., Jemal A., CA: Cancer J. Clin. 2024, 74, 229. - PubMed

MeSH terms

LinkOut - more resources