. 2025 Jun 19;135(16):e185001.
doi: 10.1172/JCI185001. eCollection 2025 Aug 15.

Cross-species efficacy of AAV-mediated ARSA replacement for metachromatic leukodystrophy

Affiliations

Cross-species efficacy of AAV-mediated ARSA replacement for metachromatic leukodystrophy

Shyam Ramachandran et al. J Clin Invest. .

Abstract

Metachromatic leukodystrophy (MLD) is an autosomal recessive neurodegenerative disorder caused by mutations in the arylsulfatase A (ARSA) gene, resulting in lower sulfatase activity and the toxic accumulation of sulfatides in the central and peripheral nervous system. Children account for 70% of cases and become progressively disabled, with death occurring within 10 years of disease onset. Gene therapy approaches to restore ARSA expression via adeno-associated virus (AAV) vectors have been promising but hampered by limited brain biodistribution. We report the development of an engineered capsid, AAV.GMU01, demonstrating superior biodistribution and transgene expression in the central nervous system of nonhuman primates (NHPs). Next, we show that AAV.GMU01-ARSA-treated MLD mice exhibit persistent, normal levels of sulfatase activity and a concomitant reduction in toxic sulfatides. Treated mice also show a reduction in MLD-associated pathology and auditory dysfunction. Lastly, we demonstrate that treatment with AAV.GMU01-ARSA in NHPs is well tolerated and results in potentially therapeutic ARSA expression in the brain. In summary, we propose AAV.GMU01-ARSA-mediated gene replacement as a clinically viable approach to achieve broad and therapeutic levels of ARSA.

Keywords: Gene therapy; Genetic diseases; Genetics; Neuroscience.


Conflict of interest statement

Conflict of interest: All authors are present or past Sanofi employees and may hold shares and/or stock options in the company. Patents covering this study: Methods for Treating Metachromatic Leukodystrophy (WO2023225481A1; SR inventor); AAV.GMU01 for the treatment of CNS disorders (provisional application filed; SR inventor).

Figures

Figure 1
Figure 1. The engineered capsid AAV.GMU01 shows higher transgene expression in the brain of NHPs compared with AAV.rh10.
Cynomolgus monkeys (male, Mauritius, 2 years old, 2–3 kg) seronegative for AAV.rh10 and AAV.GMU01 were dosed by intrathecal delivery at the cervical level 1–2 junction using a ported intrathecal catheter inserted at the lumbar region. Animals were dosed in the Trendelenburg position. One dose of AAV.GMU01 or rh10-CBA-eGFP was administrated at 2.75e13 VG/NHP (3.65e11 VG/g brain weight). At 16–29 days after dose, animals were euthanized. (AH) Forty-one tissue biopsy punches from 19 different gray matter brain regions were taken. AAV VG copies (AC) were measured in brain biopsy punches by bovine growth hormone-digital polymerase chain reaction and normalized to TUBB1 gene intron to obtain VG copies per cell, presented by animal (A) or by punch (B and C). eGFP expression (DF) in the same regions was measured by ELISA, presented by animal (D) or by punch (E and F). (G and H) Correlation of vector exposure to eGFP expression in brain, presented by animal (G) or by punch (H). (I) Representative images depicting distinct brain regions from AAV.GMU01- and AAV.rh10-treated NHPs stained for eGFP. Scale bar: 5 mm. Data are shown as the mean ± SEM. Two-way ANOVA with Tukey’s or Šidák’s (B and D) multiple-comparison test. *P < 0.05; **P < 0.01; ***P < 0.001; ****P < 0.0001.
Figure 2
Figure 2. AAV.GMU01 shows widespread vector biodistribution and transgene activity throughout brain, spinal cord, and DRGs.
Cynomolgus monkeys (male, Vietnam, 2–3 years old, 2–3 kg) seronegative for AAV.GMU01 were dosed with AAV.GMU01-CBA-nLuc-mCherry at 2.0e13 VG/NHP (2.75e11 VG/g brain weight) either by bilateral ICV injection or direct ICM. Four weeks after dose, animals were euthanized, and brain, spinal cord, and DRG tissues were flash-frozen. Tissue biopsy punches corresponding to the indicated brain regions and 4 spinal cord levels were assessed for VG exposure (A and C) by dPCR. nLuc activity (B and D) was assessed using the Nano-Glo luciferase assay and normalized to total protein measured by bicinchoninic acid assay. (E and F) Histopathological findings in brain, spinal cord, and DRG; each data point represents the maximum severity of findings scored on 1–2 sections per animal. Severity scores refer to findings graded as 0 = no findings, 1 = minimal, 2 = mild, 3 = moderate, 4 = marked, and 5 = severe. Block 8: frontal cortex, striatum; Block 9: insular cortex, temporal cortex; Block 10: motor cortex, striatum; Block 17: thalamus, insular cortex; Block 18: hippocampus, entorhinal cortex; Block 28: parietal cortex; Block 30: cerebellum, medulla, Block 105: midbrain, pons. Data are shown as the mean ± SEM; 1- and 2-way ANOVA with Šidák’s multiple-comparison test. *P < 0.05; ***P < 0.001.
Figure 3
Figure 3. Phenotypic reversal in Arsa-KO mice treated with AAV.GMU01-ARSA.
Pre-neuronopathic Arsa-KO mice and age-matched control animals were dosed with AAV.GMU01-ARSA at 1.6e11 VG/mouse (3.3e11 VG/g brain weight). Thirteen months after dose, Arsa-KO mice were euthanized, and brain, spinal cord, DRG, sciatic nerve, liver, plasma, and CSF samples were collected. (A and B) ARSA-mediated sulfatase activity was measured using the sulfatase activity assay; data normalized to total protein measured by bicinchoninic acid (BCA) assay. (C and D) Sulfatide levels were measured using liquid chromatography–mass spectrometry. Data normalized to tissue weight: converted from ng/mL (50 μL) to μg/g (ng ST/μg total protein for DRG and sciatic nerve). For fluids, data are presented as ng/mL (CSF). (EG) RT-dPCR was performed to quantify Gfap, Aif1 (gene for Iba1), and Lamp1 levels, normalized to mouse Hprt gene. Each data point represents a single animal. Data are shown as the mean ± SEM; 1-way ANOVA with Tukey’s multiple-comparison test. (H) At 4, 7, 10, and 13 months after dose, ABR measurements were recorded via electrodes placed on the scalp of an anesthetized animal. Data are shown as the mean ± SEM; 2-way ANOVA with Tukey’s multiple-comparison test. #denotes “KO+FB” versus “KO+AAV” group; *denotes “WT+FB” versus “KO+FB” group. (IK) Histopathological findings in brain, spinal cord, and DRG; each data point represents the maximum severity of findings scored on 1–2 sections per animal. Severity scores refer to findings graded as 0 = no findings, 1 = minimal, 2 = mild, 3 = moderate, 4 = marked, and 5 = severe. Data are shown as the mean ± SEM. */#P < 0.05; **/##P < 0.01; ***/###P < 0.001; ****/####P < 0.0001. FB, formulation buffer; ST, sulfatide.
Figure 4
Figure 4. ARSA expression and function are persistent over time.
Early-neuronopathic Arsa-KO mice (6 months at dosing) and age-matched control animals were dosed with AAV.GMU01-ARSA at 5e10 VG/mouse (1.0e11 VG/g brain weight). At 1, 2, 3, and 6 months after dose, Arsa-KO mice were euthanized and samples collected. (AF) Brain (forebrain + midbrain) samples. (A) Vector exposure by bovine growth hormone-digital polymerase chain reaction normalized to the Rab1a gene (intronic region). (B) ARSA-mediated sulfatase activity was measured using the sulfatase activity assay kit, and data were normalized to total protein measured by bicinchoninic acid assay. (C) Lyso-ST, (D) C16-sulfatide isoform, (E) C18-sulfatide isoform, and (F) total sulfatide levels were measured using liquid chromatography–mass spectrometry. Data were normalized to tissue weight: converted from ng/mL (50 μL) to μg/g. Total sulfatide levels were also measured in (G) CSF and (H) plasma samples. (I) Plasma samples were collected at necropsy and assayed using the Simoa platform (Quanterix) to quantify Nf-L. Data are shown as the mean ± SEM. Two-way ANOVA with Tukey’s multiple-comparison test. *P < 0.05; **P < 0.01; ***P < 0.001; ****P < 0.0001. FB, formulation buffer; ST, sulfatide.
Figure 5
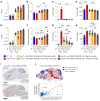
Figure 5. AAV-ARSA treatment results in dose-dependent sulfatide clearance in Arsa-KO mice with evidence of robust cross-correction.
(AH) Brain (forebrain + midbrain) samples. (AD) Neonatal Arsa-KO mice (P0 at dosing) and age-matched control animals were dosed with AAV.GMU01-ARSA at noted doses. Six months after dose, mice were euthanized and samples collected. (A) Vector exposure by bovine growth hormone-digital polymerase chain reaction (bGH-dPCR) normalized to the Rab1a gene (intronic region). (B) ARSA-mediated sulfatase activity was measured using the sulfatase activity assay kit and data normalized to total protein measured by bicinchoninic acid (BCA) assay. (C) Lyso-ST and (D) total sulfatide levels were measured using liquid chromatography–mass spectrometry (LC-MS). Data normalized to tissue weight: converted from ng/mL (50 μL) to μg/g. (EH) Early-neuronopathic Arsa-KO mice (6 months at dosing) and age-matched control animals were dosed with AAV.GMU01-ARSA at noted doses. Three months after dose, mice were euthanized and samples collected. gm, gram. (E) Vector exposure by bGH-dPCR normalized to the Rab1a gene (intronic region). (F) ARSA-mediated sulfatase activity was measured using the sulfatase activity assay kit and data normalized to total protein measured by BCA assay. (G) Lyso-ST and (H) total sulfatide levels were measured using LC-MS. Data normalized to tissue weight: converted from ng/mL (50 μL) to μg/g. Data are shown as the mean ± SEM. Two-way ANOVA with Tukey’s multiple-comparison test. *P < 0.05; **P < 0.01; ***P < 0.001; ****P < 0.0001. FB, formulation buffer; ST, sulfatide. (I and J) AAV.rh10-ARSA-WPRE–treated Arsa-KO mice showing evidence of ARSA protein cross-correction. Late-stage (13 month) Arsa-KO mice were dosed with AAV.rh10-CBA-ARSA-WPRE. Three months after dose, ARSA mRNA ISH and ARSA protein IHC were performed on matched sagittal brain hemisections. The sections were imaged and analyzed for signal overlay. (I) Representative sections from mouse brain stained for ARSA mRNA (ISH) and ARSA protein (IHC) with DAPI staining for nuclei (inset: staining from buffer-treated Arsa-KO mice). Scale bars: 2 mm. (J) Cross-correction factor (ratio of IHC+ cells to ISH+ cells) is represented as a heatmap with highly cross-corrected tiles shown in shades of red. ISH+ cell count versus IHC+ cell count from each tile is plotted as a scatterplot with y = x line shown in red. Tiles above the y = x line indicate cross-corrected cells.
Figure 6
Figure 6. Widespread dose-dependent vector biodistribution and ARSA expression in NHP brain.
Purpose-bred, naive, male/female cynomolgus (Cambodia 2 to 3 years old, 2.6 to 3.1 kg) NHPs seronegative for AAV.GMU01 neutralizing antibodies were dosed by single direct ICM infusion. Animals received a single 2.5 mL infusion of AAV.GMU01-ARSA at 0.125 mL/min, followed by a 250 μL flush with formulation buffer. Five weeks after dose, the animals were euthanized, and samples were assessed. (A and B) Vector biodistribution (digital PCR [dPCR]) normalized to the TUBB1 gene intron. Each data point represents VG/cell exposure for that tissue punch, either (A) averaged across all NHPs in that group or (B) presented by individual brain regions. (C and D) ARSA mRNA (RT-dPCR) normalized to endogenous HPRT gene. Each data point represents normalized ARSA expression in that tissue punch, either (C) averaged across all NHPs in that group or (D) presented by individual brain regions. (E and F) Human ARSA protein expression (liquid chromatography–mass spectrometry). Each data point represents the amount of human ARSA in that tissue punch, averaged across 3 animals in that group, either presented as an (E) average across all NHPs in that group or (F) presented per individual brain region. Data below lower limit of quantitation have been excluded. (G) Correlation of ARSA protein and VG/cell at 7.5e12 and 2.5e13 VG/NHP doses (R2 = 0.06 and 0.18, respectively). Samples represent 64 biopsy punches from brain representing 19 distinct gray matter regions and 7 distinct white matter regions. Data are shown as the mean ± SEM. Two-way ANOVA with Tukey’s multiple-comparison test. *P < 0.05; **P < 0.01; ***P < 0.001; ****P < 0.0001. FB, formulation buffer; T/I/C cortex, temporal/insular/cingulate cortex.
Figure 7
Figure 7. ICM infusion was well tolerated, resulted in expected Nf-L elevation, and did not trigger innate nor cell-mediated immune responses.
(A) Predose and at necropsy, CSF was collected and analyzed for Nf-L levels by the Simoa platform (Quanterix). Each data point represents Nf-L levels per animal, averaged across all NHPs in that group. (B) Plasma was isolated predose at days 2, 4, 7, 14 after dose, and at necropsy. The Luminex assay was used to determine the concentration of MCP1 (graphed) and IL-1b, IL-1RA, IL-6, IL-10, IL12/23 (p40), IL-15, IL-18, IFN-γ, TNF-α, G-CSF, MCP-1, MIP-1b, GM-CSF, IL-2, IL-4, IL-5, IL-8, IL-13, and IL-17A (graphed in Supplemental Figure 13). Each data point represents cytokine concentration in that sample, averaged across all NHPs in that group. (C) PBMCs isolated from animals in the 1e11 and 3.3e11 VG/g brain weight dosing groups were subjected to IFN-γ enzyme-linked immunosorbent spot. (DF) Histopathological findings in brain, spinal cord, and DRG; each data point represents the maximum severity of findings scored on 1–2 sections per animal. Severity scores refer to findings graded as 0 = no findings, 1 = minimal, 2 = mild, 3 = moderate, 4 = marked, and 5 = severe. Data are shown as the mean ± SEM; 2-way ANOVA with *Tukey’s and #Dunnett’s multiple-comparison test.
Figure 8
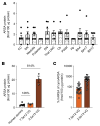
Figure 8. AAV.GMU01-ARSA effective doses are at potentially therapeutic levels.
(A) Liquid chromatography–mass spectrometry (LC-MS) was performed to quantify human ARSA protein levels in 12 brain regions from 7 healthy 3- to 8-year-old organ donors. Human tissue was received from the NIH NeuroBioBank at the University of Miami and the Sepulveda Research Corporation. gm, gram. (B) LC-MS was performed to quantify human ARSA protein levels in 30 tissue biopsy punches collected from brain (gray matter) of NHPs in dose-ranging study. Mean ARSA protein in each group is presented. (C) LC-MS was performed to quantify both human and endogenous Macaca fascicularis cynoARSA protein levels. Each data point is represented as a ratio of human ARSA to cynomolgus cynoARSA protein in that tissue punch and averaged across 3 animals in that group. Data are shown as the mean ± SEM. CC, corpus callosum; SN, substantia nigra; DN, dentate nucleus; Thal LNG, lateral geniculate nucleus of the thalamus; Cb, cerebellum; PWM, periventricular white matter; Hp, hippocampus; BA, Brodmann area.

References

    1. Gieselmann V, Ingeborg KM. Metachromatic leukodystrophy. In: Valle DL, et al. eds. The Online Metabolic and Molecular Bases of Inherited Disease. McGraw-Hill; 2019: Chapter 179.
    1. Aubourg P. Gene therapy for leukodystrophy: progress, challenges and opportunities. Expert Opin Orphan Drugs. 2016;4(4):359–367. doi: 10.1517/21678707.2016.1151352. - DOI
    1. Batzios SP, Zafeiriou DI. Developing treatment options for metachromatic leukodystrophy. Mol Genet Metab. 2012;105(1):56–63. doi: 10.1016/j.ymgme.2011.10.002. - DOI - PubMed
    1. Cesani M, et al. Mutation update of ARSA and PSAP genes causing metachromatic leukodystrophy. Hum Mutat. 2016;37(1):16–27. doi: 10.1002/humu.22919. - DOI - PubMed
    1. Mirzaian M, et al. Quantification of sulfatides and lysosulfatides in tissues and body fluids by liquid chromatography-tandem mass spectrometry. J Lipid Res. 2015;56(4):936–943. doi: 10.1194/jlr.M057232. - DOI - PMC - PubMed

Substances