. 2025 Jun 19;135(16):e181034.
doi: 10.1172/JCI181034. eCollection 2025 Aug 15.

Blood immunophenotyping identifies distinct kidney histopathology and outcomes in patients with lupus nephritis

Affiliations

Blood immunophenotyping identifies distinct kidney histopathology and outcomes in patients with lupus nephritis

Alice Horisberger et al. J Clin Invest. .

Abstract

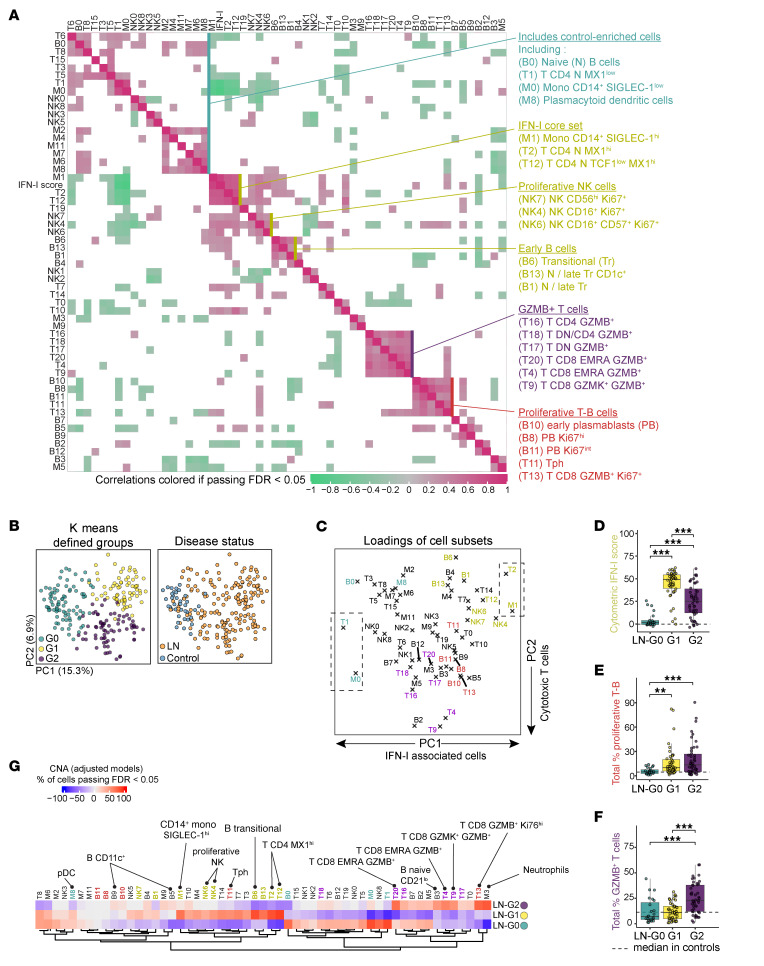
Lupus nephritis (LN) is a frequent manifestation of systemic lupus erythematosus, and fewer than half of patients achieve complete renal response with standard immunosuppressants. Identifying noninvasive, blood-based immune alterations associated with renal injury could aid therapeutic decisions. Here, we used mass cytometry immunophenotyping of peripheral blood mononuclear cells in 145 patients with biopsy-proven LN and 40 healthy controls to evaluate the heterogeneity of immune activation and identify correlates of renal parameters. Unbiased analysis identified 3 immunologically distinct groups of patients that were associated with different patterns of histopathology, renal cell infiltrates, urine proteomic profiles, and treatment response at 1 year. Patients with enriched circulating granzyme B+ T cells showed more active disease and increased numbers of activated CD8+ T cells in the kidney, yet they had the highest likelihood of treatment response. A second group characterized by a high type I interferon signature had a lower likelihood of response to therapy, while a third group appeared immunologically inactive but with chronic renal injuries. The major immunologic axes of variation could be distilled down to 5 simple cytometric parameters that recapitulate several clinical associations, highlighting the potential for blood immunoprofiling to translate to clinically useful noninvasive metrics to assess immune-mediated disease in LN.

Keywords: Autoimmunity; Biomarkers; Immunology; Lupus.


Figures

Figure 1
Figure 1. Blood immunophenotyping by mass cytometry captures the range of IFN-I signaling intensity in LN.
(A) Cell type–specific clustering analysis for each panel (e.g., B cells in the B panel, including LN [n = 145] and controls [n = 40]). (B) T cell UMAPs of LN-associated cell neighborhoods adjusted for demographic factors (age, sex, ethnicity, and race) and false discovery rate (FDR < 0.05), along with MX1 expression. (C) Myeloid cell UMAPs of LN-associated cell neighborhoods adjusted for demographic factors and FDR (FDR < 0.05), along with Siglec-1 expression. (D and E) Top Spearman’s ρ absolute correlation between marker expression in the T panel (D) or myeloid panel (E) and the main axis of covarying neighborhood analysis (CNA) for T cells and myeloid cells, respectively. (F) Comparison of IFN-I cytometric scores between patients with LN (n = 125) and controls (n = 40) including samples stained with T, B, and myeloid panels; the dashed line represents 3 standard deviations above the control mean (mean + 3 SD = 6.46). (G) Comparison of IFN-I cytometric scores in patients with membranous LN (class V, n = 38) versus proliferative LN (class III or IV with or without V, n = 87). (F and G) Statistical significance was determined using Wilcoxon’s rank sum test.
Figure 2
Figure 2. Association of circulating immune cell subsets with histologic patterns of active LN.
(A) Heatmap showing associations between circulating blood cell types (y axis) and LN histologic patterns (x axis). CNA was used to test for associations, adjusting for demographic factors (age, sex, ethnicity, and race) and history of previous biopsy. Purple and light purple represent global adjusted CNA P values, with asterisks indicating significant local associations (FDR < 0.05). (BD) B cell associations with LN histologic class (n = 124) (B), NIH renal activity index (n = 111) (C), and glomerular fibrinoid necrosis as defined by the NIH renal activity index (n = 90) (D); C includes a violin plot illustrating contributions of individual B cell clusters to the NIH activity index association. (E) Violin plots depicting selected protein expression levels in specific B cell clusters. (F) Scatterplot showing selected protein expression in B cell clusters B0 and B3. E and F include all subjects (LN = 145, controls = 40). (G) Proportion of B cell cluster B3 (percentage of total B cells) associated with LN histologic class (n = 140), renal activity index (n = 124), complement levels (n = 138), and longitudinal changes in non-responders (n = 19) versus complete responders (n = 23). Cross-sectional analyses used linear models, while longitudinal analyses used mixed-effects models with patients as a random effect. (H) Top correlations between B panel marker expression and the main axis of variation from the NIH activity index B cell association, using Spearman’s ρ correlations. (I) Association of myeloid cells with glomerular fibrinoid necrosis (n = 78). (J) Association of T cells with renal interstitial inflammation (n = 82). (AD, G, I, and J) All cross-sectional statistical analyses shown were adjusted for demographic factors (age, sex, ethnicity, and race) and history of previous biopsy.
Figure 3
Figure 3. Distinct immune cell signatures in LN patients identified through unbiased blood immunophenotyping.
(A) Correlation heatmap of 55 immune cell clusters and IFN-I cytometric signature in 115 LN patients, organized by hierarchical clustering. Spearman’s correlation coefficients are highlighted in color when correlations passed FDR < 0.05. (B) Principal component analysis (PCA) of 224 samples (39 controls, 115 baseline LN samples, 39 LN samples from week 12, and 31 LN samples from week 52) visualized by K-means–defined groups (left) and disease status (right). (C) Loadings of immune cell subsets on the first 2 PC dimensions, highlighting key cell groups associated with IFN-I and cytotoxic T cell signatures. (DF) Comparisons of key immune cell signatures between each LN group at baseline (G0: n = 26; G1: n = 46; G2: n = 46). Statistical significance was determined using the Kruskal-Wallis tests with Dunn’s multiple comparisons. **P < 0.01, ***P < 0.001. (G) Heatmap showing covarying neighborhood associations of baseline immune cell subsets with LN groups relative to the 2 other groups. Colors represent the percentage of cells passing FDR < 0.05, as either enriched (red) or depleted (blue). (AG) Selected immune cell subsets and groupings are consistently color-coded (green, yellow, purple, red) across all panels.
Figure 4
Figure 4. Blood-defined LN groups are associated with renal pathology and outcome.
(A) Comparison of NIH renal activity index between blood-defined LN groups (G0: n = 20; G1: n = 40; G2: n = 40; LN groups were defined using K-means clustering based on blood immunophenotyping). Statistical significance was determined using the Kruskal-Wallis test with Dunn’s multiple comparisons. (B) Heatmap showing Spearman’s correlation coefficients between LN groups (one-versus-rest) and NIH renal activity/chronicity subscores (G0: n = 18; G1: n = 33; G2: n = 30). Adjusted significance levels are indicated (FDR < 0.05 and < 0.1). (C) Multivariable models evaluating one-versus-rest group associations with activity index (linear model) and proliferative class (logistic regression; reference = membranous class), adjusting for demographic factors (age, sex, ethnicity, and race), history of previous biopsy, and prednisone dose. (D) Comparison of NIH renal chronicity index between LN groups (G0: n = 20; G1: n = 40; G2: n = 40), with statistical significance determined by the Kruskal-Wallis test with Dunn’s multiple comparisons. *P < 0.05, **P < 0.01, ***P < 0.001. (E) Multivariable model testing one-versus-rest group associations with chronicity index (linear model), adjusting for demographic variables, history of previous biopsy, and prednisone dose. (F) Multivariable model testing one-versus-rest group associations with complete renal response at 52 weeks (non-complete vs. complete response), adjusting for demographic variables, history of previous biopsy, and prednisone dose. (G) Univariate model evaluating group associations with complete renal response at 52 weeks in patients treated with MMF throughout the study.
Figure 5
Figure 5. Blood-defined LN groups are associated with specific immune cell infiltration in the kidney and translate to urinary markers of inflammation.
(A) Distribution of T cells and NK cells and selected gene expression by single-cell RNA-Seq analysis of kidney tissue from patients with LN (n = 101). (B) CNA of T-NK cells with blood-defined LN group G2 relative to others (G0 and G1) applied to paired kidney tissue samples. Cells in the UMAP are expanded (red) or depleted (blue) in patients with LN, if correlation passed FDR < 0.05. (C and D) Comparison of the proportions of CNA-identified granzyme B+ and a subset of granzyme K+ immune cell subsets, and CD4+ memory T cells in the kidney tissue (C), or IFN-I gene signature (21-gene list previously reported) in all immune cells from the kidney tissue (D), between blood-defined LN groups (G0: n = 19; G1: n = 40; G2: n = 42); *P < 0.05, **P < 0.01, ****P < 0.0001. (E) Comparison of each urine protein abundance between specified groups, as displayed by the performance of classification using the area under the curve (AUC). Dots colored pink passed FDR threshold of 0.10, and labels were assigned to the top associated proteins. Statistical significance was determined using Wilcoxon’s rank sum test.
Figure 6
Figure 6. Immune cellular signature heterogeneity across and within patients with LN.
(A) Importance and direction of the effect of demographic, clinical, and renal characteristics on immune cell signatures. The coefficients were defined by a linear model with an elastic net penalization using a 10-fold cross-validation, with the cellular signature as a response variable and the y axis variables as the predictor variables. IS, immunosuppressants; DA, disease activity; low c, low complement. (B) Comparison of immune cell signatures between treated (n = 80) or not treated (n = 59) with MMF at baseline. Statistical significance was determined using Wilcoxon’s rank sum test; ***P < 0.001. (C) Changes in blood-defined group membership over time. Each band represents a patient, and each patient is colored by the baseline group membership. All patients with LN with samples at 3 time points and samples stained with all 4 panels were included in this analysis (n = 21). (D) Longitudinal changes in immune cell signatures, stratified by response status (NR/PR, no response/partial response [n = 13]; CR, complete response [n = 16]) including patients with LN who were treated with MMF throughout the study. Statistical significance was determined using a mixed-effects model including patients as a random effect. *P < 0.05, **P < 0.01, ***P < 0.001. (E) Correlations between simplified immune cell signatures and NIH activity subscores at baseline. Statistical significance was determined using Spearman’s ρ correlation followed by FDR correction for multiple testing. For visualization purposes we showed the inversed value of median CD21 in non-proliferative B cells (written as *–1). (F) Longitudinal changes in simplified immune cell signatures in patients treated with an MMF-based therapy. For visualization purposes we showed the inversed value of median CD21 in non-proliferative B cells (written as *–1). Statistical significance was determined using a mixed-effects model including patients as a random effect. P = 0.05, *P < 0.05, **P < 0.01, ***P < 0.001.

Update of

  • Blood immunophenotyping identifies distinct kidney histopathology and outcomes in patients with lupus nephritis.
    Horisberger A, Griffith A, Keegan J, Arazi A, Pulford J, Murzin E, Howard K, Hancock B, Fava A, Sasaki T, Ghosh T, Inamo J, Beuschel R, Cao Y, Preisinger K, Gutierrez-Arcelus M, Eisenhaure TM, Guthridge J, Hoover PJ, Dall'Era M, Wofsy D, Kamen DL, Kalunian KC, Furie R, Belmont M, Izmirly P, Clancy R, Hildeman D, Woodle ES, Apruzzese W, McMahon MA, Grossman J, Barnas JL, Payan-Schober F, Ishimori M, Weisman M, Kretzler M, Berthier CC, Hodgin JB, Demeke DS, Putterman C; Accelerating Medicines Partnership: RA/SLE Network; Brenner MB, Anolik JH, Raychaudhuri S, Hacohen N, James JA, Davidson A, Petri MA, Buyon JP, Diamond B, Zhang F, Lederer JA, Rao DA. Horisberger A, et al. bioRxiv [Preprint]. 2024 Mar 9:2024.01.14.575609. doi: 10.1101/2024.01.14.575609. bioRxiv. 2024. Update in: J Clin Invest. 2025 Jun 19;135(16):e181034. doi: 10.1172/JCI181034. PMID: 38293222 Free PMC article. Updated. Preprint.

Similar articles

Cited by

References

    1. Hoover PJ, Costenbader KH. Insights into the epidemiology and management of lupus nephritis from the US rheumatologist’s perspective. Kidney Int. 2016;90(3):487–492. doi: 10.1016/j.kint.2016.03.042. - DOI - PMC - PubMed
    1. Tektonidou MG, et al. Risk of end-stage renal disease in patients with lupus nephritis, 1971-2015: a systematic review and Bayesian meta-analysis. Arthritis Rheumatol. 2016;68(6):1432–1441. doi: 10.1002/art.39594. - DOI - PMC - PubMed
    1. Mok CC, et al. Effect of renal disease on the standardized mortality ratio and life expectancy of patients with systemic lupus erythematosus. Arthritis Rheum. 2013;65(8):2154–2160. doi: 10.1002/art.38006. - DOI - PubMed
    1. Arazi A, et al. The immune cell landscape in kidneys of patients with lupus nephritis. Nat Immunol. 2019;20(7):902–914. doi: 10.1038/s41590-019-0398-x. - DOI - PMC - PubMed
    1. Der E, et al. Tubular cell and keratinocyte single-cell transcriptomics applied to lupus nephritis reveal type I IFN and fibrosis relevant pathways. Nat Immunol. 2019;20(7):915–927. doi: 10.1038/s41590-019-0386-1. - DOI - PMC - PubMed