. 2025 Jun;29(12):e70679.
doi: 10.1111/jcmm.70679.

Insights From Amniotic and Umbilical Cord Mesenchymal Stem Cells in Wound Healing

Affiliations

Insights From Amniotic and Umbilical Cord Mesenchymal Stem Cells in Wound Healing

Nong-Er Shen et al. J Cell Mol Med. 2025 Jun.

Abstract

Skin repair is a complex physiological process that involves the coordinated actions of various cell types. This study examines the distinct roles of amniotic mesenchymal stem cells (A-MSCs) and umbilical cord mesenchymal stem cells (UC-MSCs) in skin healing using a mouse model. Gene Ontology (GO) and Kyoto Encyclopedia of Genes and Genomes (KEGG) pathway analyses revealed significant differences in gene expression between A-MSCs and UC-MSCs. Specifically, A-MSCs exhibited upregulation of genes associated with extracellular matrix (ECM) organisation and cell migration, thereby enhancing their tissue remodelling capabilities. In contrast, UC-MSCs demonstrate increased expression of genes involved in angiogenesis and anti-inflammatory responses, highlighting their role in creating a favourable healing environment. These findings highlight the unique therapeutic potentials of A-MSCs and UC-MSCs in skin repair strategies. Although MSCs hold promise in regenerative medicine, challenges such as optimal cell selection and modulation of the inflammatory microenvironment remain to be addressed. Our research emphasises the need for continued research related to properties of MSCs to refine therapeutic approaches for effective wound healing.

Keywords: amniotic membrane; inflammatory microenvironment; mesenchymal stem cell; skin repair; umbilical cord.


Conflict of interest statement

The authors declare no conflicts of interest.

Figures

FIGURE 1
FIGURE 1
Isolation and characterisation of UC‐MSCs and A‐MSCs. (A) Both UC‐MSCs and A‐MSCs exhibit a typical spindle‐shaped morphology. Scale bar = 100 μm. (B) The proliferation of the two cells was evaluated by CCK8 assay. (C) These cells are positively stained for the common MSC‐associated markers, CD73, CD90, CD105, and have no expression of haematopoietic markers CD45, CD34 and HLA‐DR. (D) Following the culture in a specific differentiation medium for 2–3 weeks, the isolated UC‐MSCs and A‐MSCs successfully differentiated into mesenchymal derivatives, including osteoblasts (Alizarin Red labeling), adipocytes (Oil Red O labeling) and chondrocytes (Alcian blue). Scale bar = 50 μm. (E) The transwell was adopted to evaluate the migration ability of the two types of cells. Scale bar = 50 μm. (F) The wound healing assays were further adopted for the migration ability of the cells. Scale bar = 100 μm.
FIGURE 2
FIGURE 2
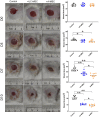
Local injection of MSCs improved the repair of skin injuries in mice. Representative photos of mice in each group, time points include 0, 3, 7 and 10 days after surgery. The wound area at each time point was calculated by imageJ software and compared between groups. n = 8, *p < 0.05, **p < 0.01.
FIGURE 3
FIGURE 3
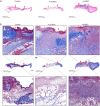
Histological analysis of skin repair on day 10 post‐surgery. (A) Haematoxylin and eosin (H&E) staining reveals significantly improvement of the wound tissue in MSC treatment groups compared to the control group. The A‐MSC treatment group shows tightly arranged cells with greater thickness than both the PBS and UC‐MSC treatment groups, indicating superior cell proliferation effects in the newly formed skin. (B) Masson's staining illustrates newly generated cavity‐like or cord‐like blood vessels at the edges of wounds across all groups; however, these structures are less abundant in the control group, significantly increased in the A‐MSC treatment group, and most pronounced in the UC‐MSC treatment group. The lower panel shows collagen fibre structures within the wounds: Loose in the control group while more neatly arranged in both MSC treatment groups, with denser collagen deposition observed in the A‐MSC treatment group. Colorimetric analysis indicates greater collagen accumulation and more effective collagen fibre repair in the A‐MSC group. Both MSC‐treated groups also show increased adipocyte production at the wound site, particularly evident in the UC‐MSC‐treated group. The arrows indicate the location of the wound.
FIGURE 4
FIGURE 4
Determination of serum TNF‐α and TGF‐β levels. (A, B) The expression trends and significance of TNF‐α and TGF‐β were assessed over time post‐surgery. *p < 0.05.
FIGURE 5
FIGURE 5
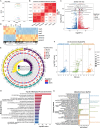
Transcriptomic profiles and differential expression analysis. (A) Principal component analysis (PCA) illustrates distinct clustering of treatment groups into two populations. (B) The Pearson correlation heatmap indicates strong correlations among samples within each group. (C) Volcano plots visualise differential gene expression between UC‐MSCs and A‐MSCs, the top 20 genes with significant differences between groups were labelled based on their p‐values. (D) A heatmap displays the top 100 transcripts. (E) The outermost circle displays the top enriched GO terms (ranked by smallest p‐ or q‐values), with an external scale indicating gene counts. Different colours represent the three main GO categories. The second circle shows the number of genes annotated to each GO term, with colour intensity reflecting the −log10(p‐value) or −log10(q‐value). The third circle provides a breakdown of upregulated and downregulated genes for each GO term, with red representing upregulation and blue representing downregulation. The innermost circle indicates the percentage of enrichment factor (Rich.Factor). (F) GO enrichment analysis shows top enriched GO terms ranked by smallest p‐values, with bubble charts highlighting gene distributions across GO terms. (G, H) Significant enrichments were noted in biological processes such as cell adhesion, migration, ECM organisation and angiogenesis. amnion, A‐MSC group; msc, UC‐MSC group.
FIGURE 6
FIGURE 6
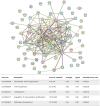
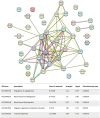
Protein–protein interaction analysis of differentially expressed genes. The biological processes analysis indicates that genes highly expressed in A‐MSCs are significantly enriched in GO terms related to extracellular matrix organisation, cell–cell adhesion, cell migration, regulation of cell population proliferation and epithelium development.
FIGURE 7
FIGURE 7
Protein–protein interaction analysis of differentially expressed genes. The biological processes analysis indicates that genes elevated in UC‐MSCs are enriched in terms associated with angiogenesis regulation, blood vessel morphogenesis, blood vessel development, negative regulation of platelet activation and tube development.

Similar articles

References

    1. Yang F., Bai X., Dai X., and Li Y., “The Biological Processes During Wound Healing,” Regenerative Medicine 16 (2021): 373–390, 10.2217/rme-2020-0066. - DOI - PubMed
    1. Singer A. J., “Healing Mechanisms in Cutaneous Wounds: Tipping the Balance,” Tissue Engineering. Part B, Reviews 28 (2022): 1151–1167, 10.1089/ten.TEB.2021.0114. - DOI - PMC - PubMed
    1. Su L., Zheng J., Wang Y., Zhang W., and Hu D., “Emerging Progress on the Mechanism and Technology in Wound Repair,” Biomedicine and Pharmacotherapy 117 (2019): 109191, 10.1016/j.biopha.2019.109191. - DOI - PubMed
    1. Zeng R., Lin C., Lin Z., et al., “Approaches to Cutaneous Wound Healing: Basics and Future Directions,” Cell and Tissue Research 374 (2018): 217–232, 10.1007/s00441-018-2830-1. - DOI - PubMed
    1. Farahani M. and Shafiee A., “Wound Healing: From Passive to Smart Dressings,” Advanced Healthcare Materials 10 (2021): e2100477, 10.1002/adhm.202100477. - DOI - PubMed

LinkOut - more resources