. 2025 Jun 19;388(6753):eadm8203.
doi: 10.1126/science.adm8203. Epub 2025 Jun 19.

Sleep need-dependent plasticity of a thalamic circuit promotes homeostatic recovery sleep

Affiliations

Sleep need-dependent plasticity of a thalamic circuit promotes homeostatic recovery sleep

Sang Soo Lee et al. Science. .

Abstract

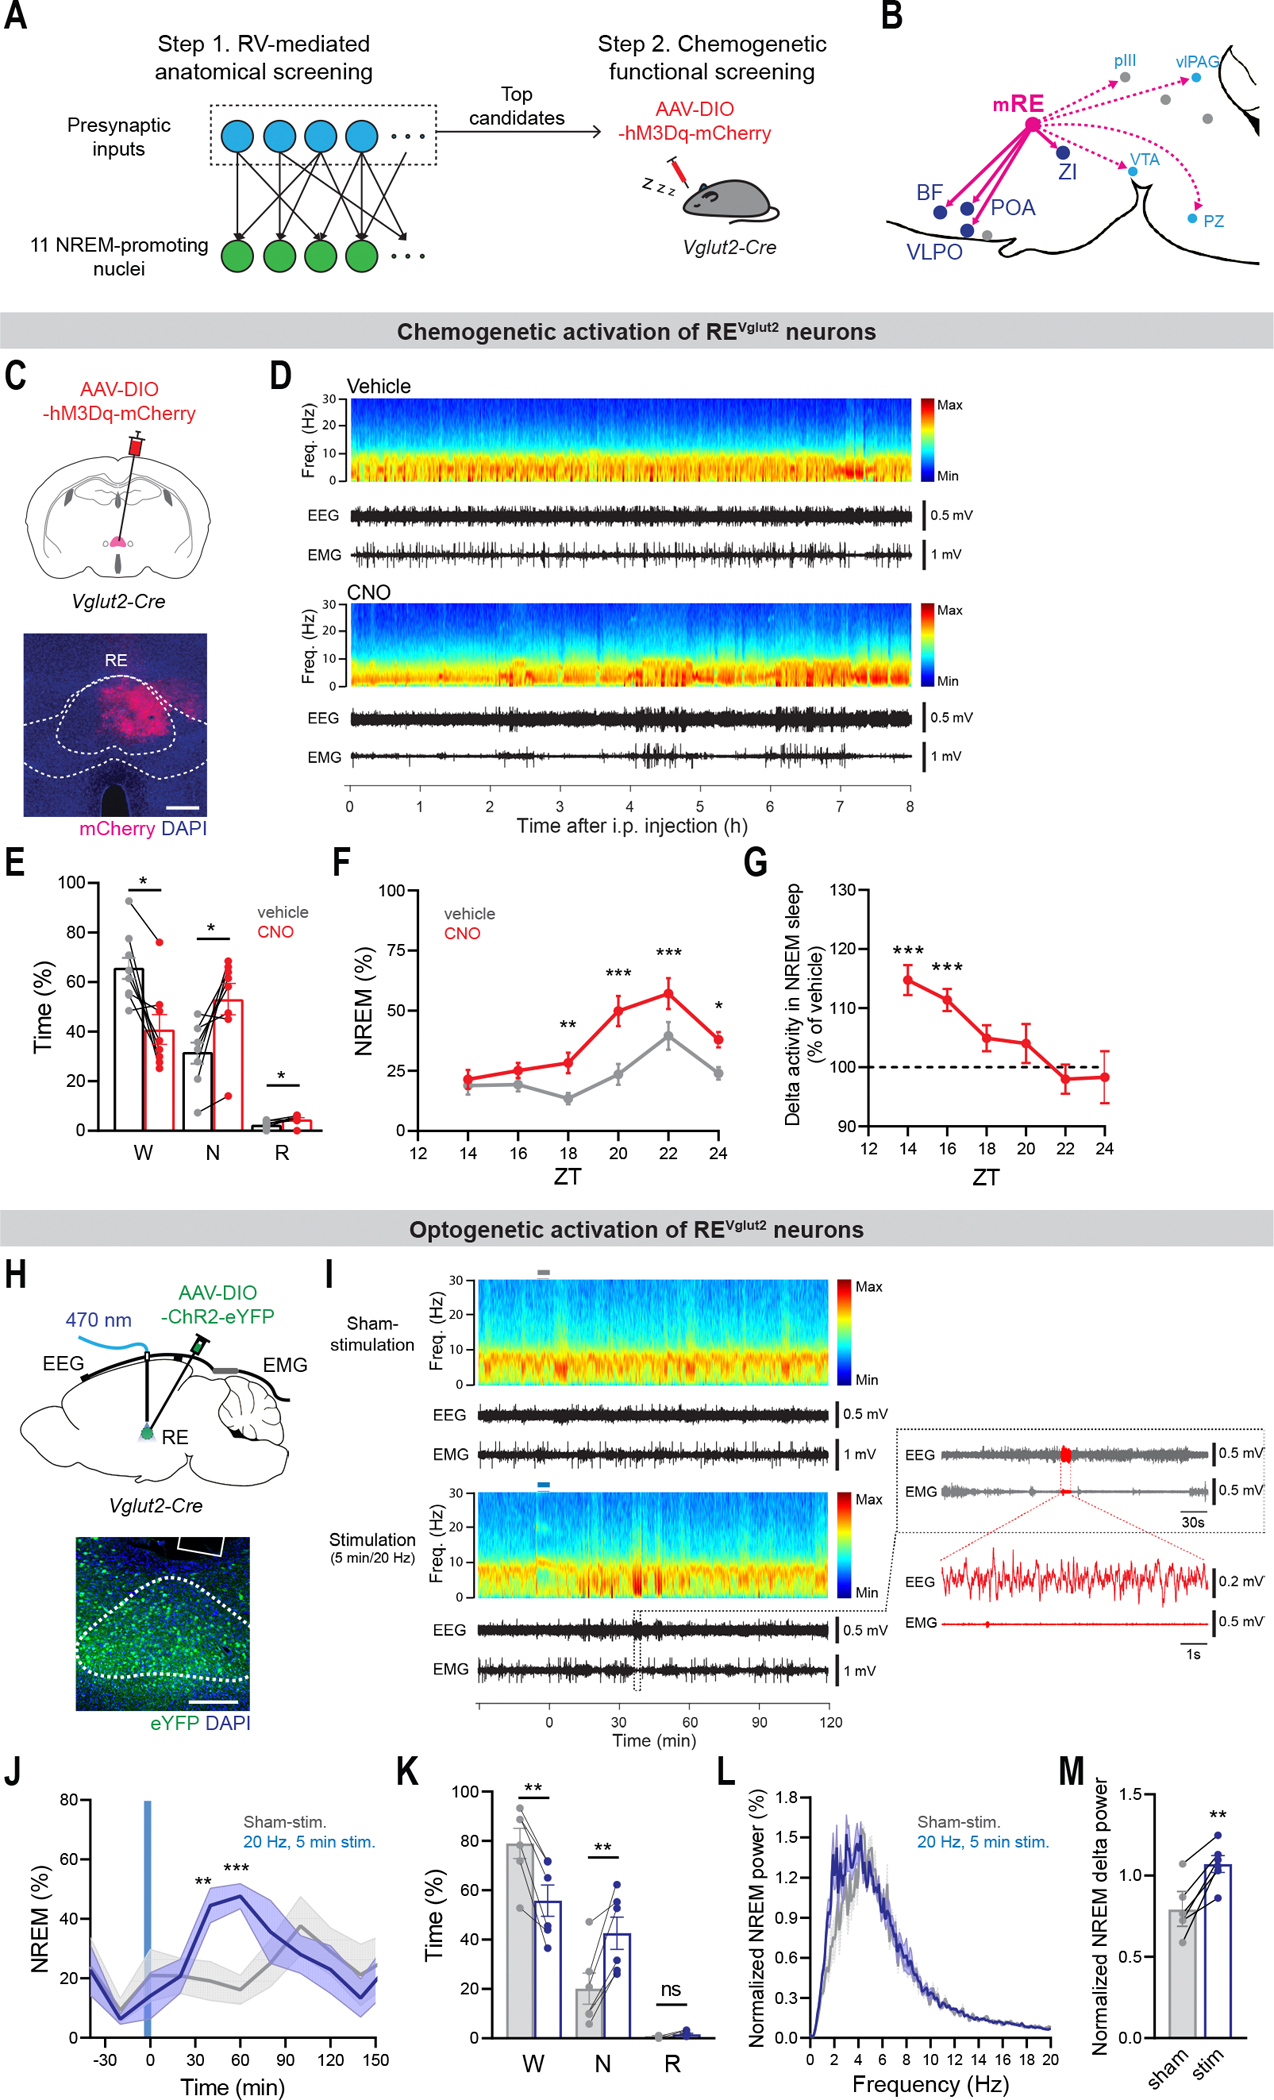
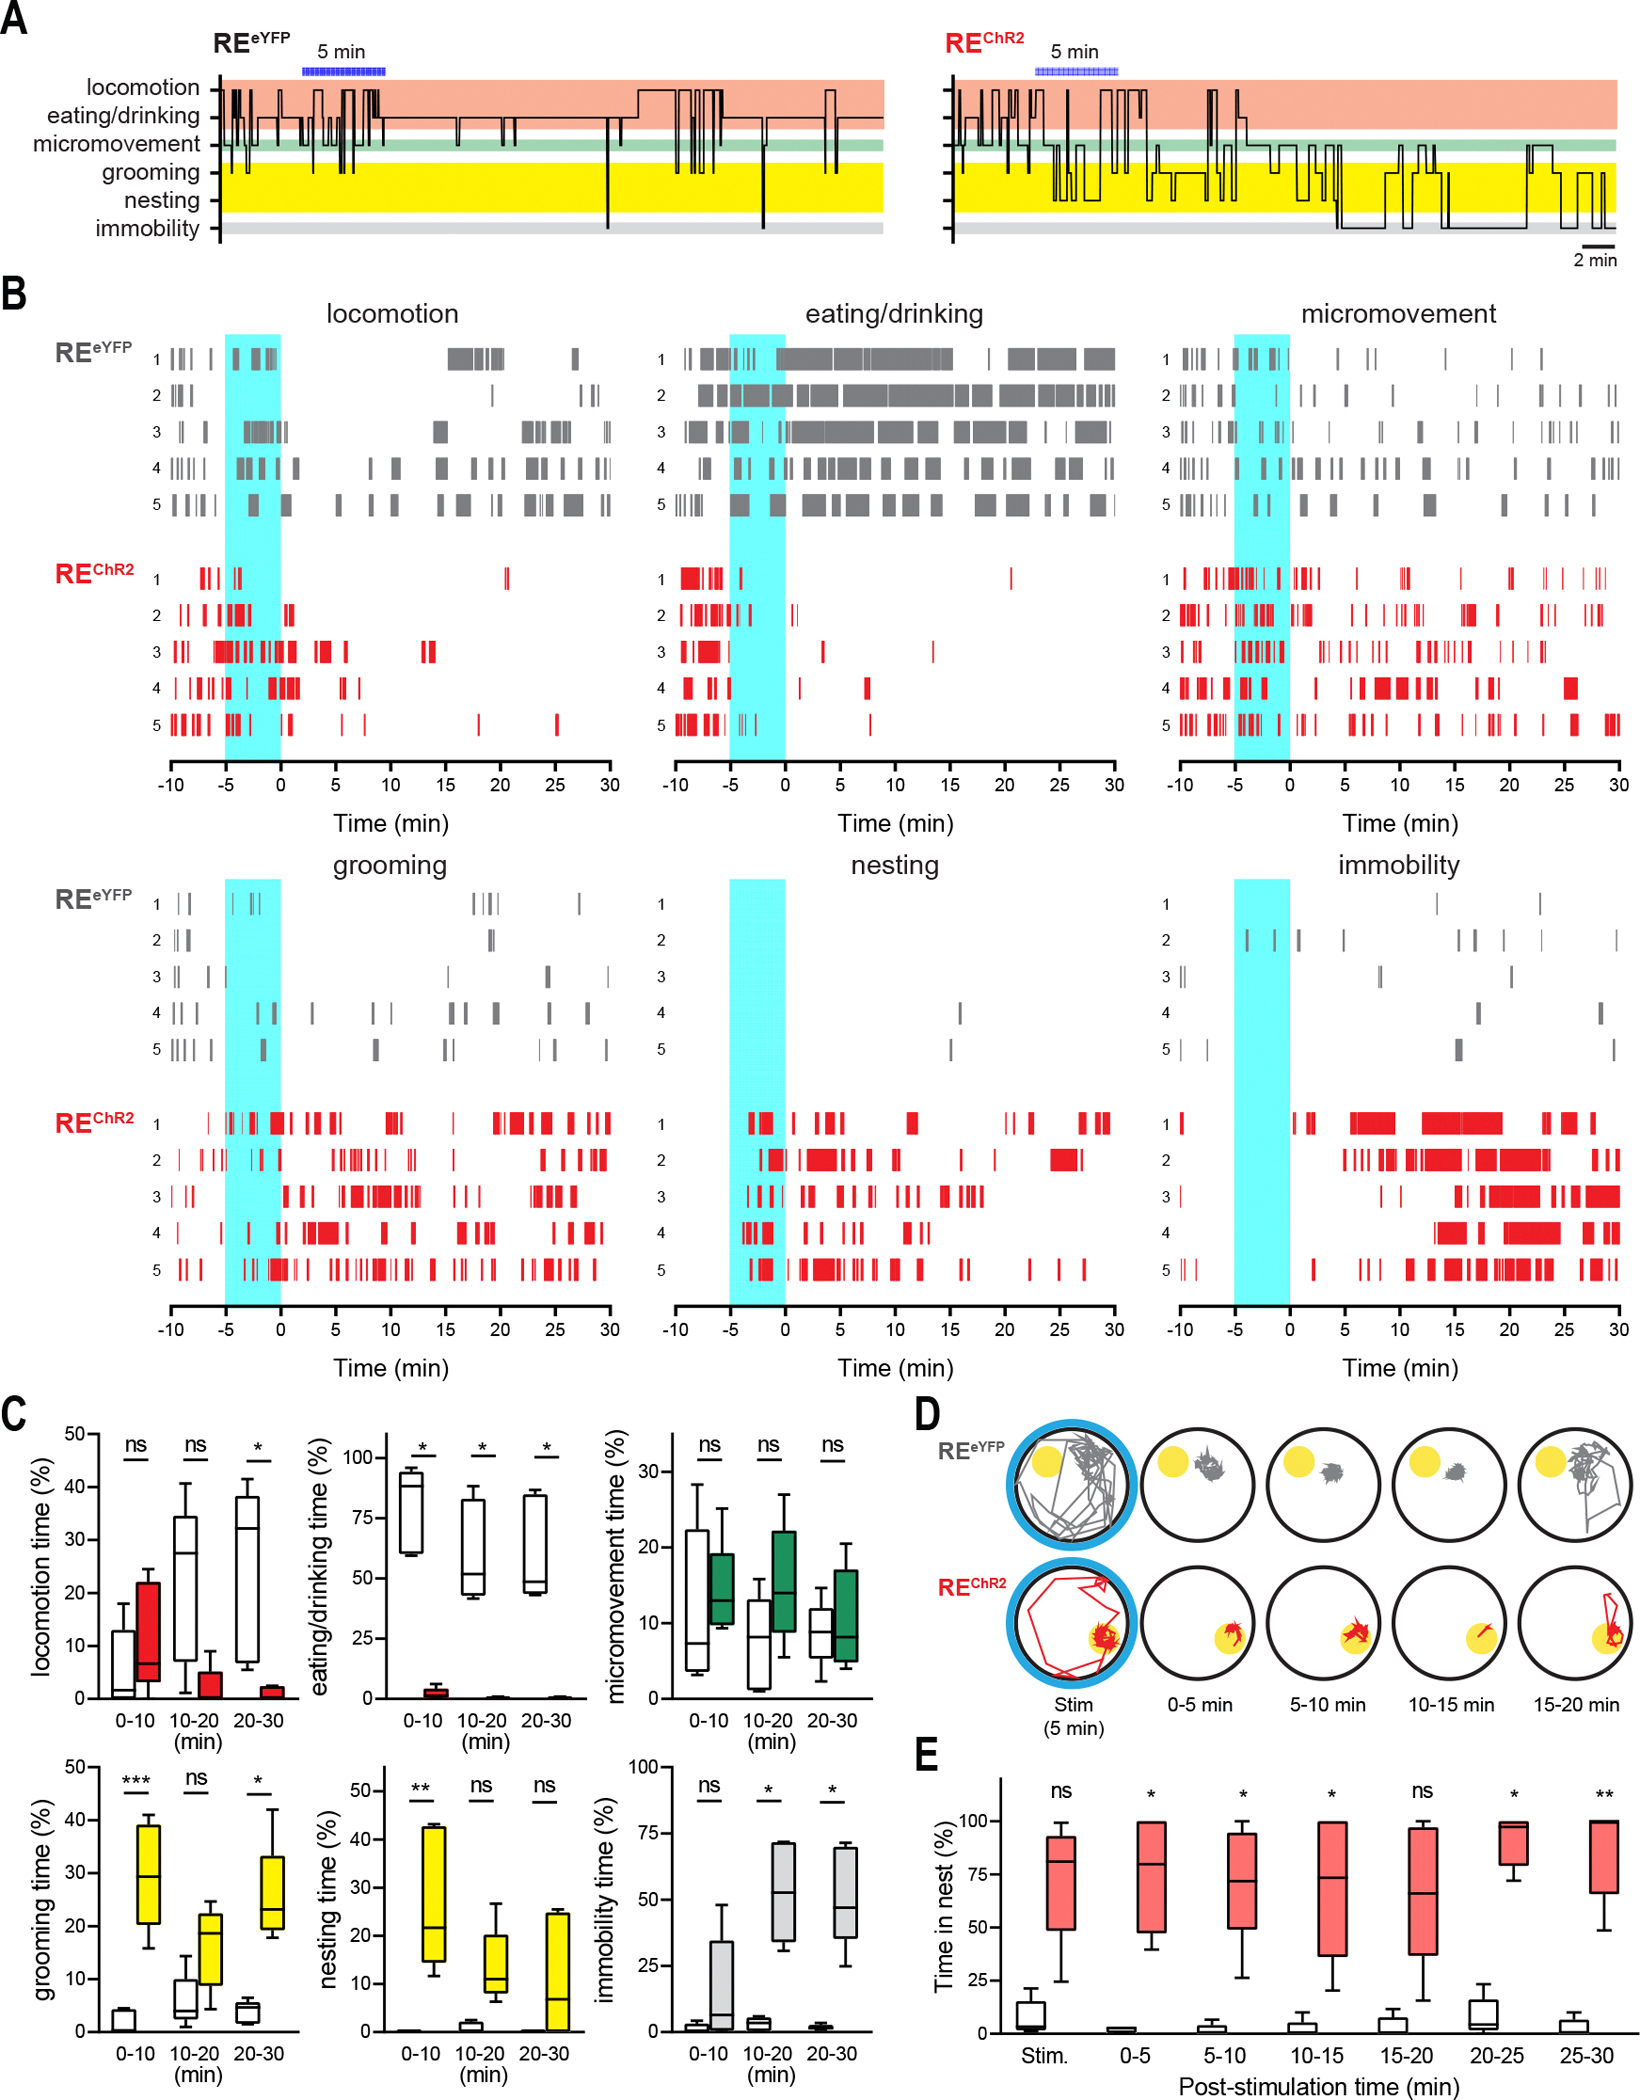
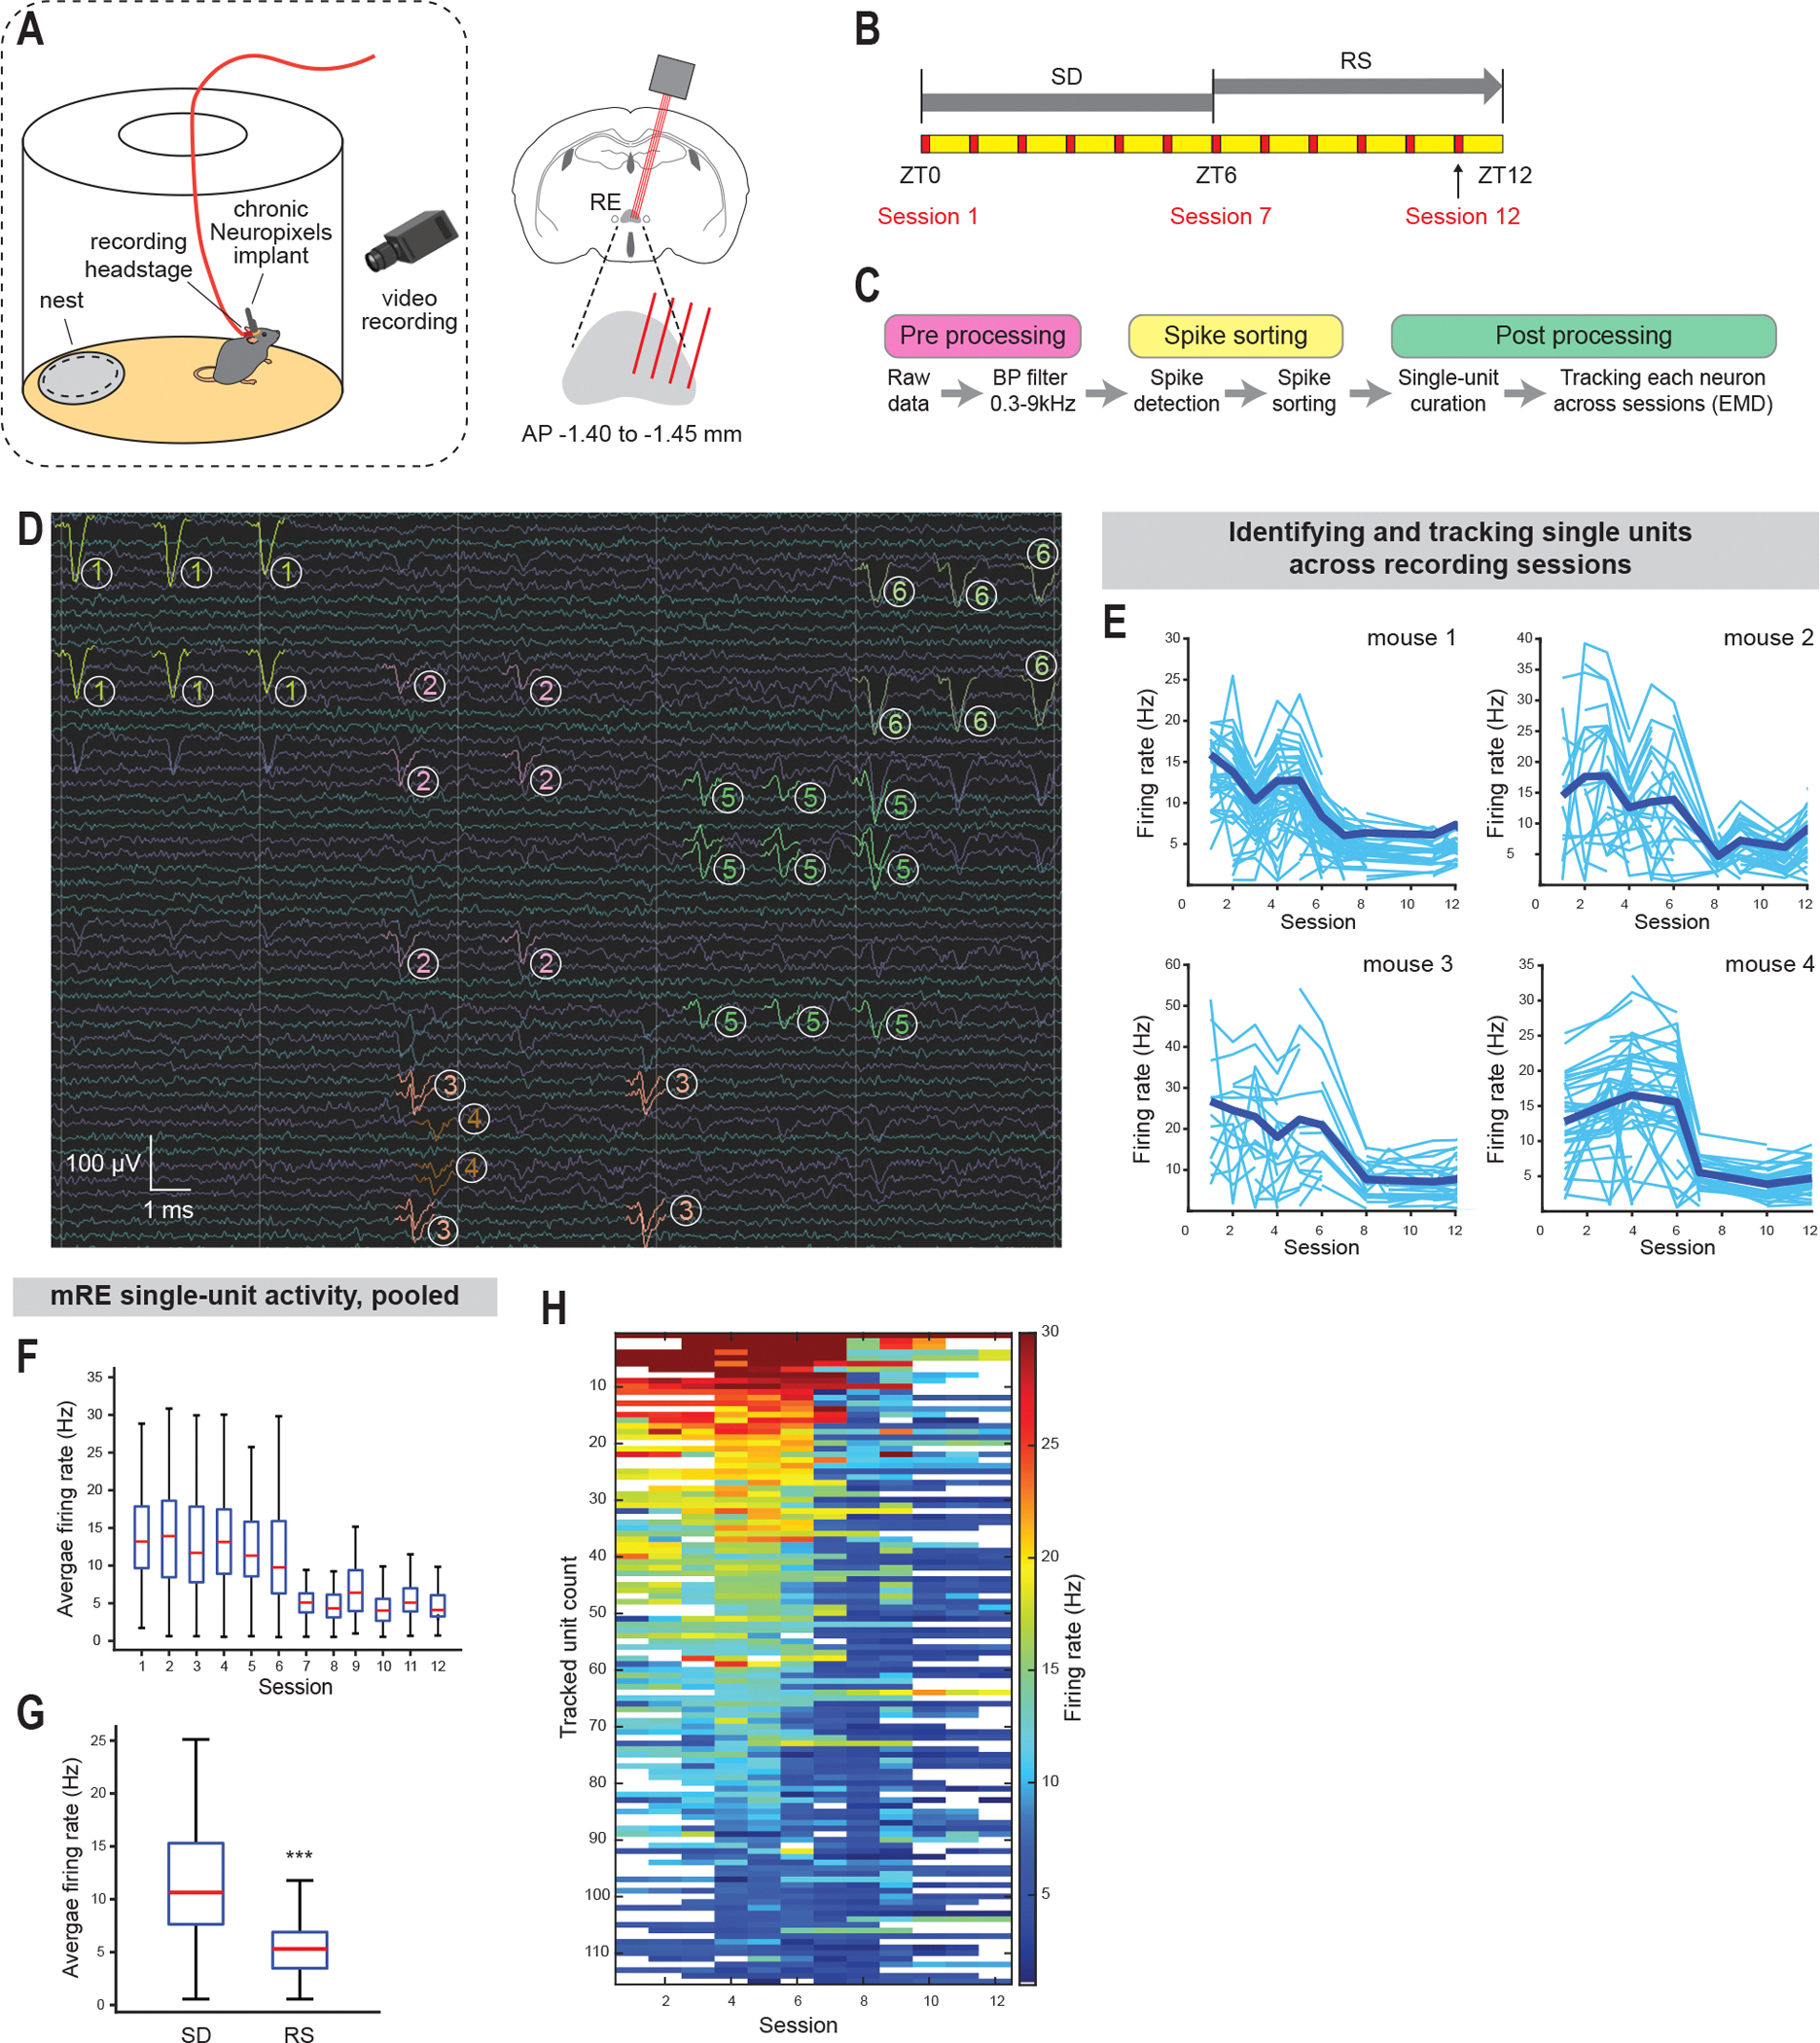
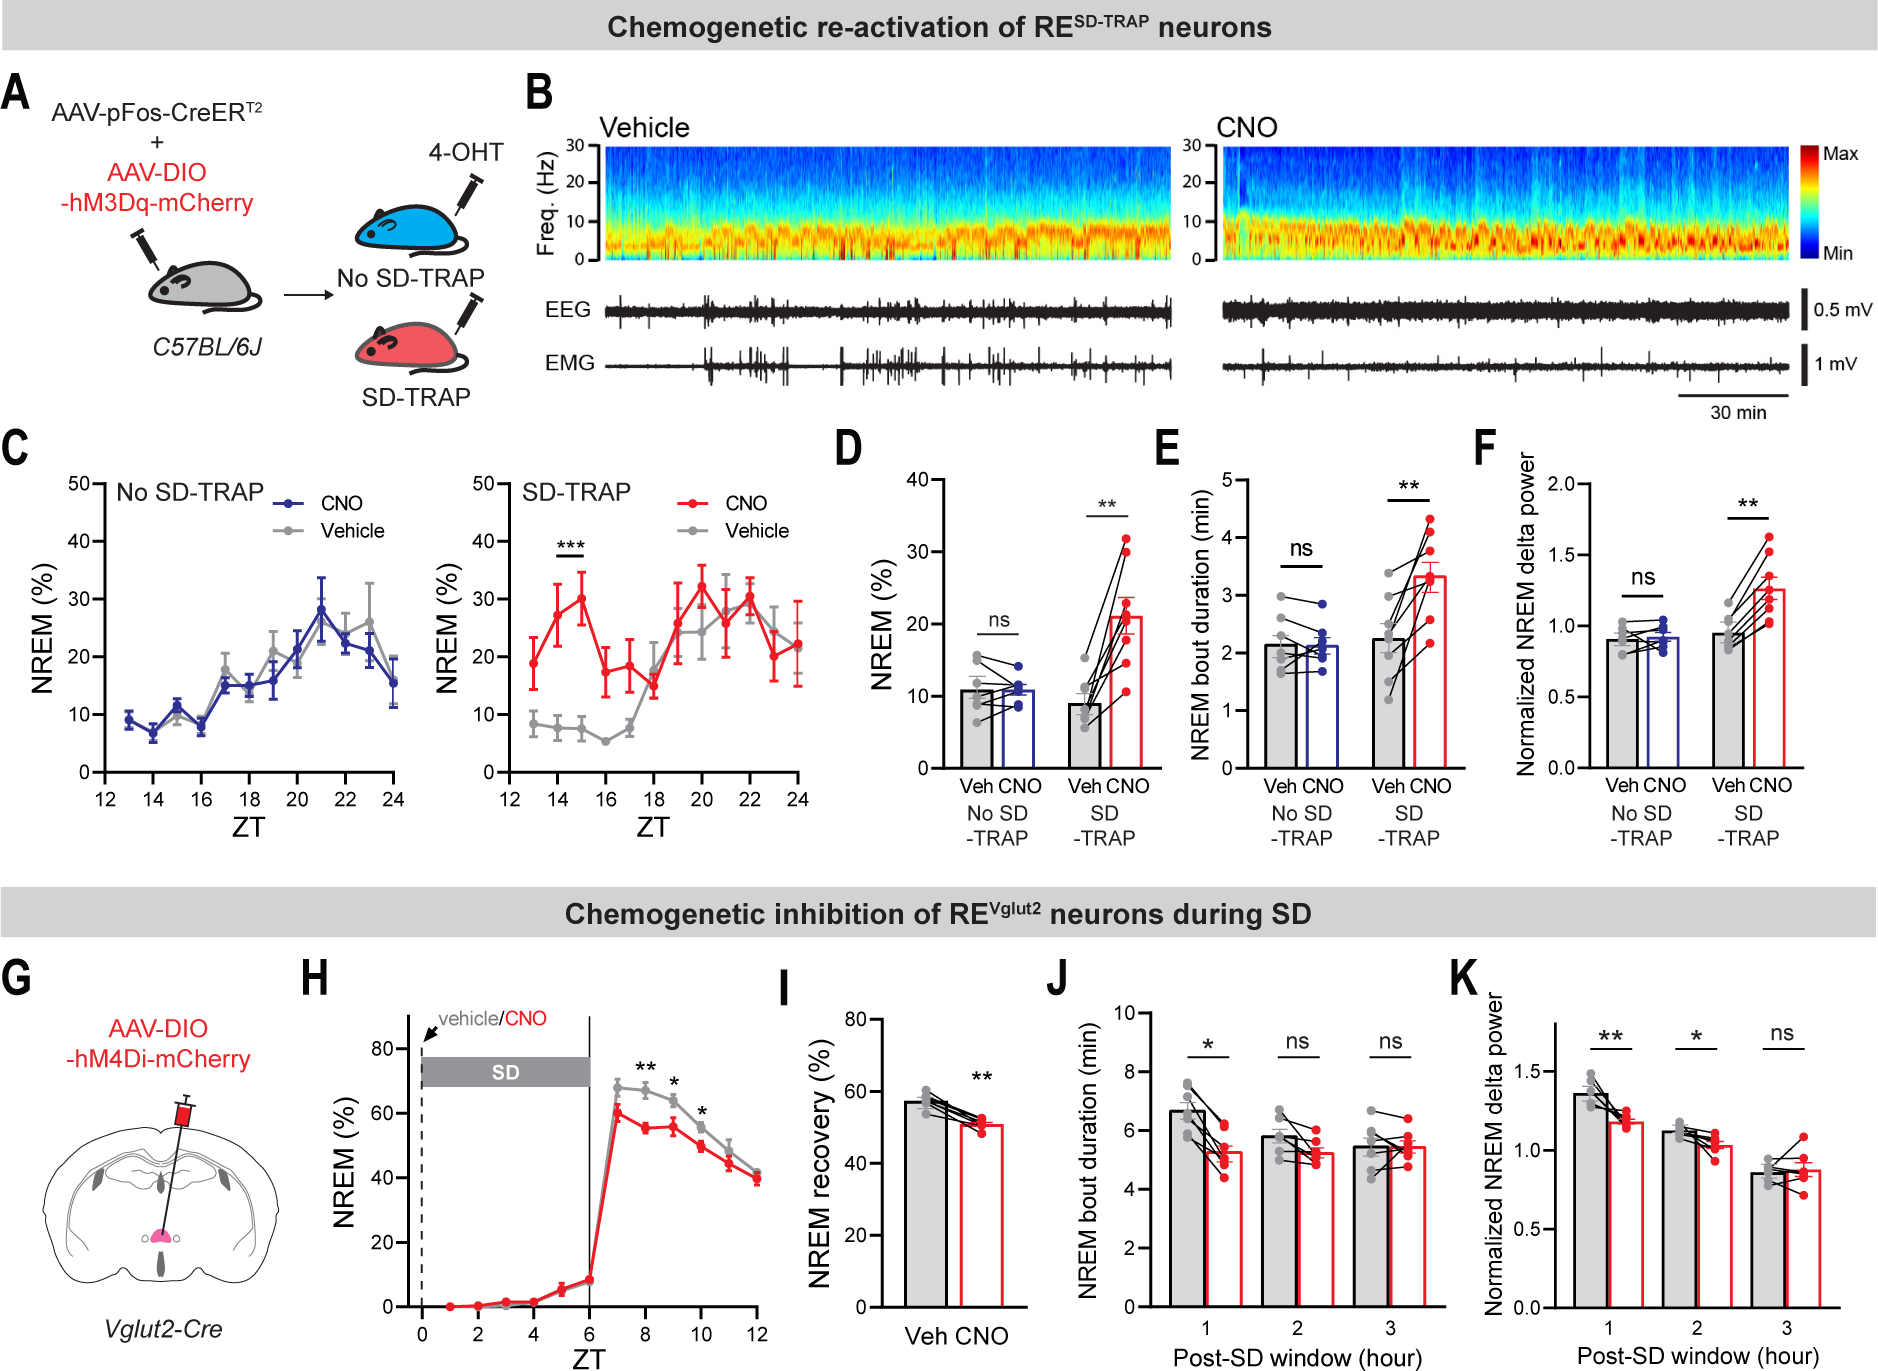
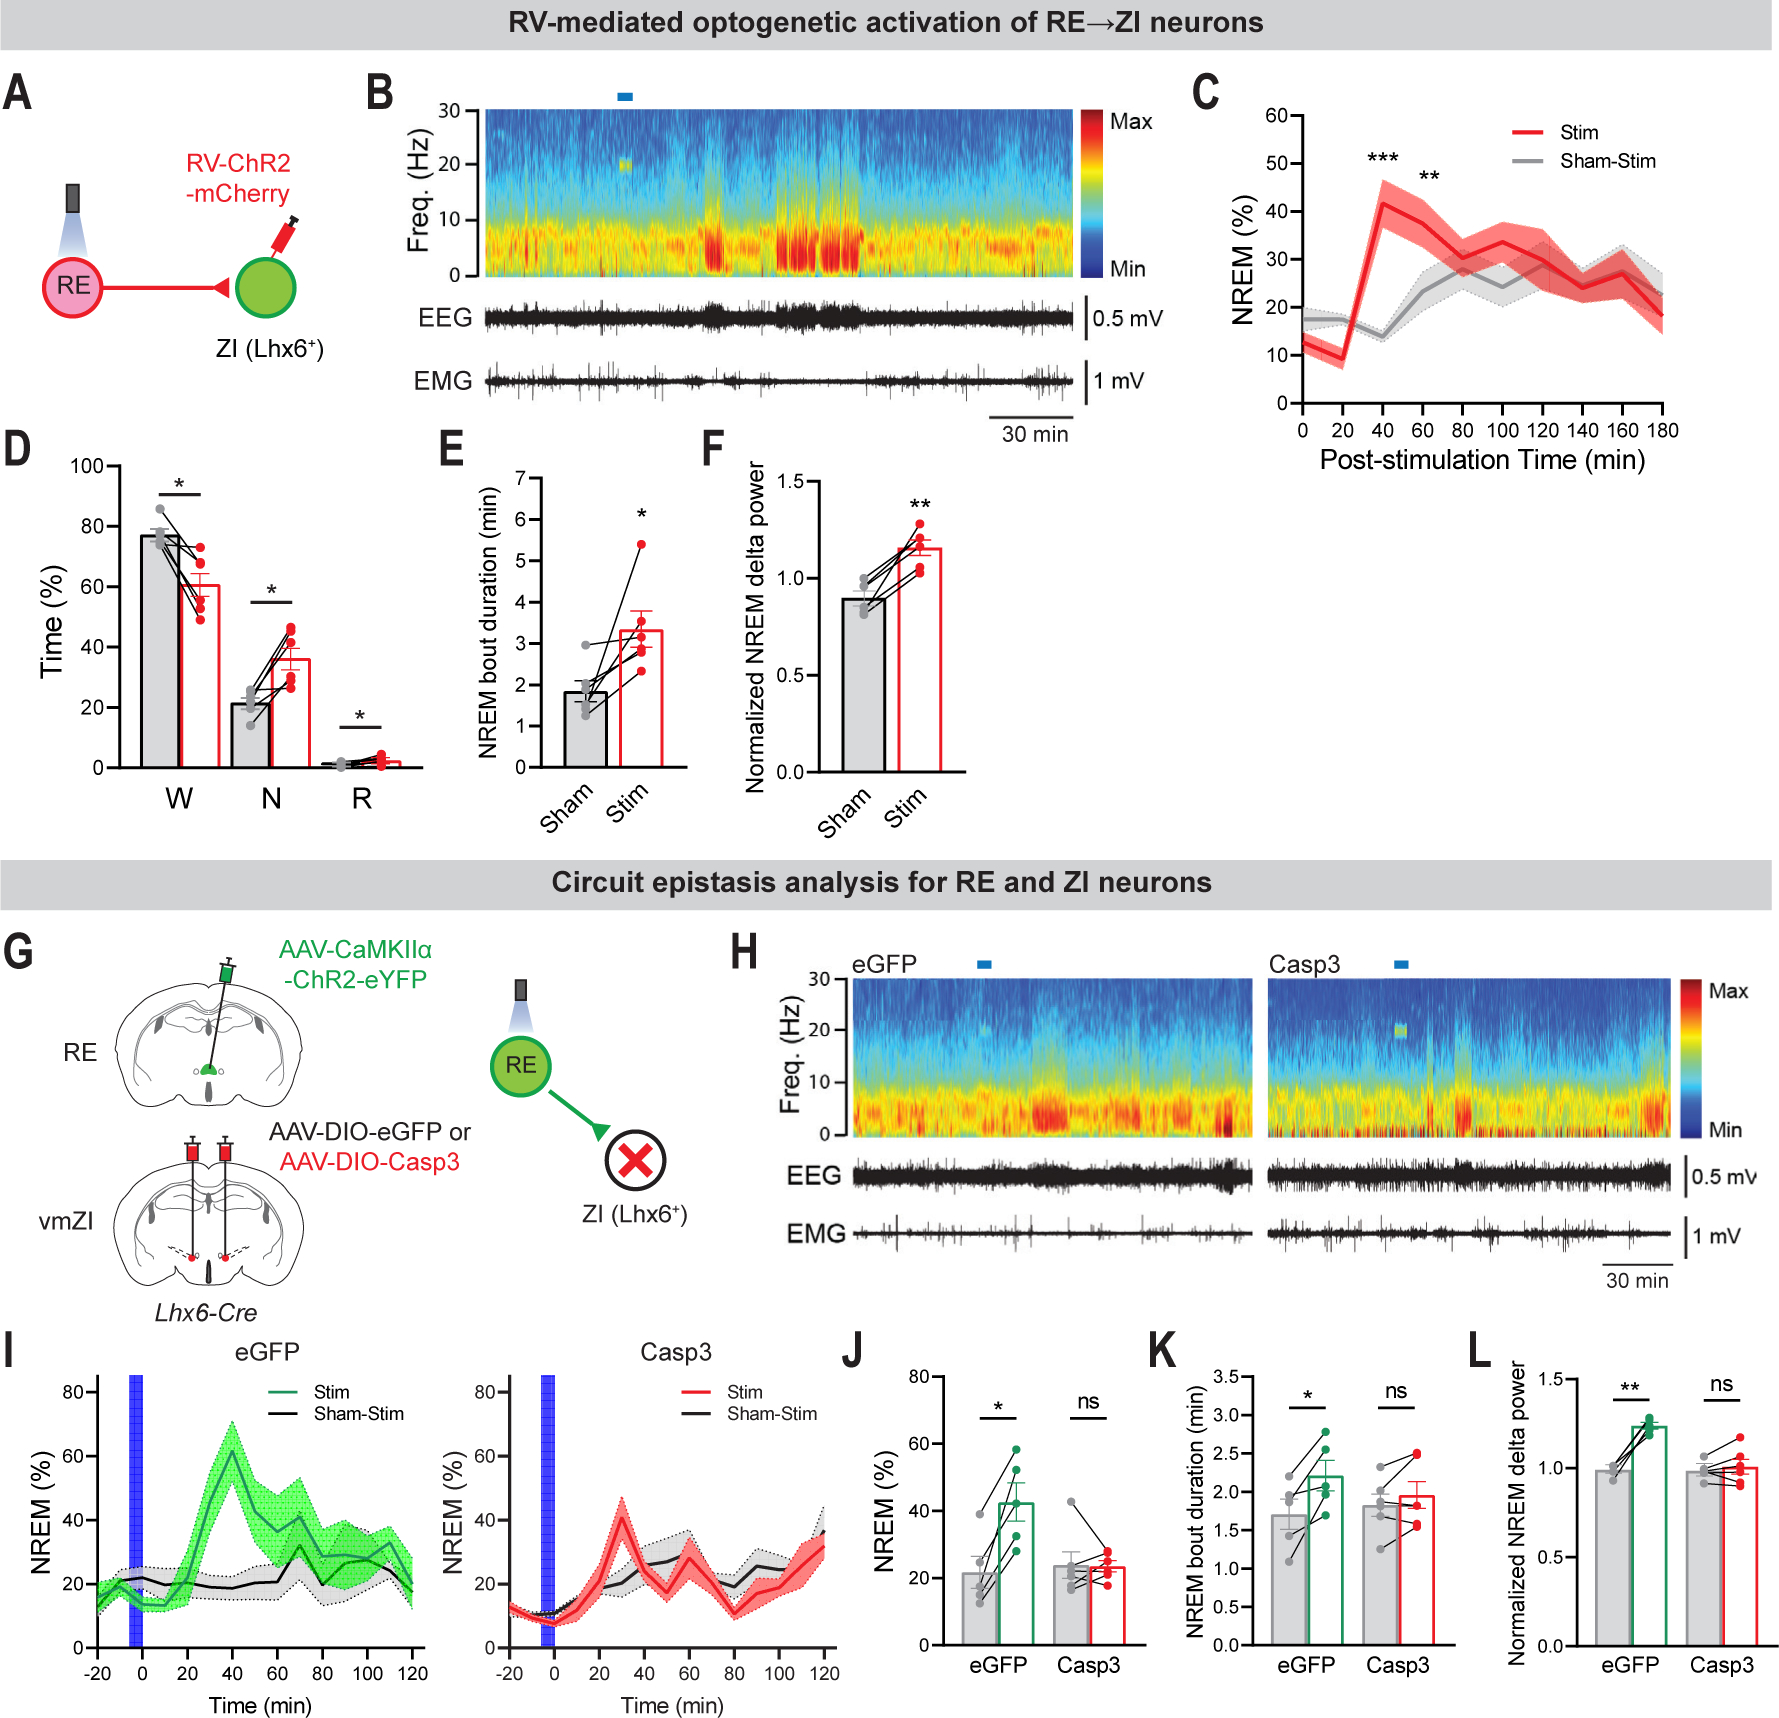
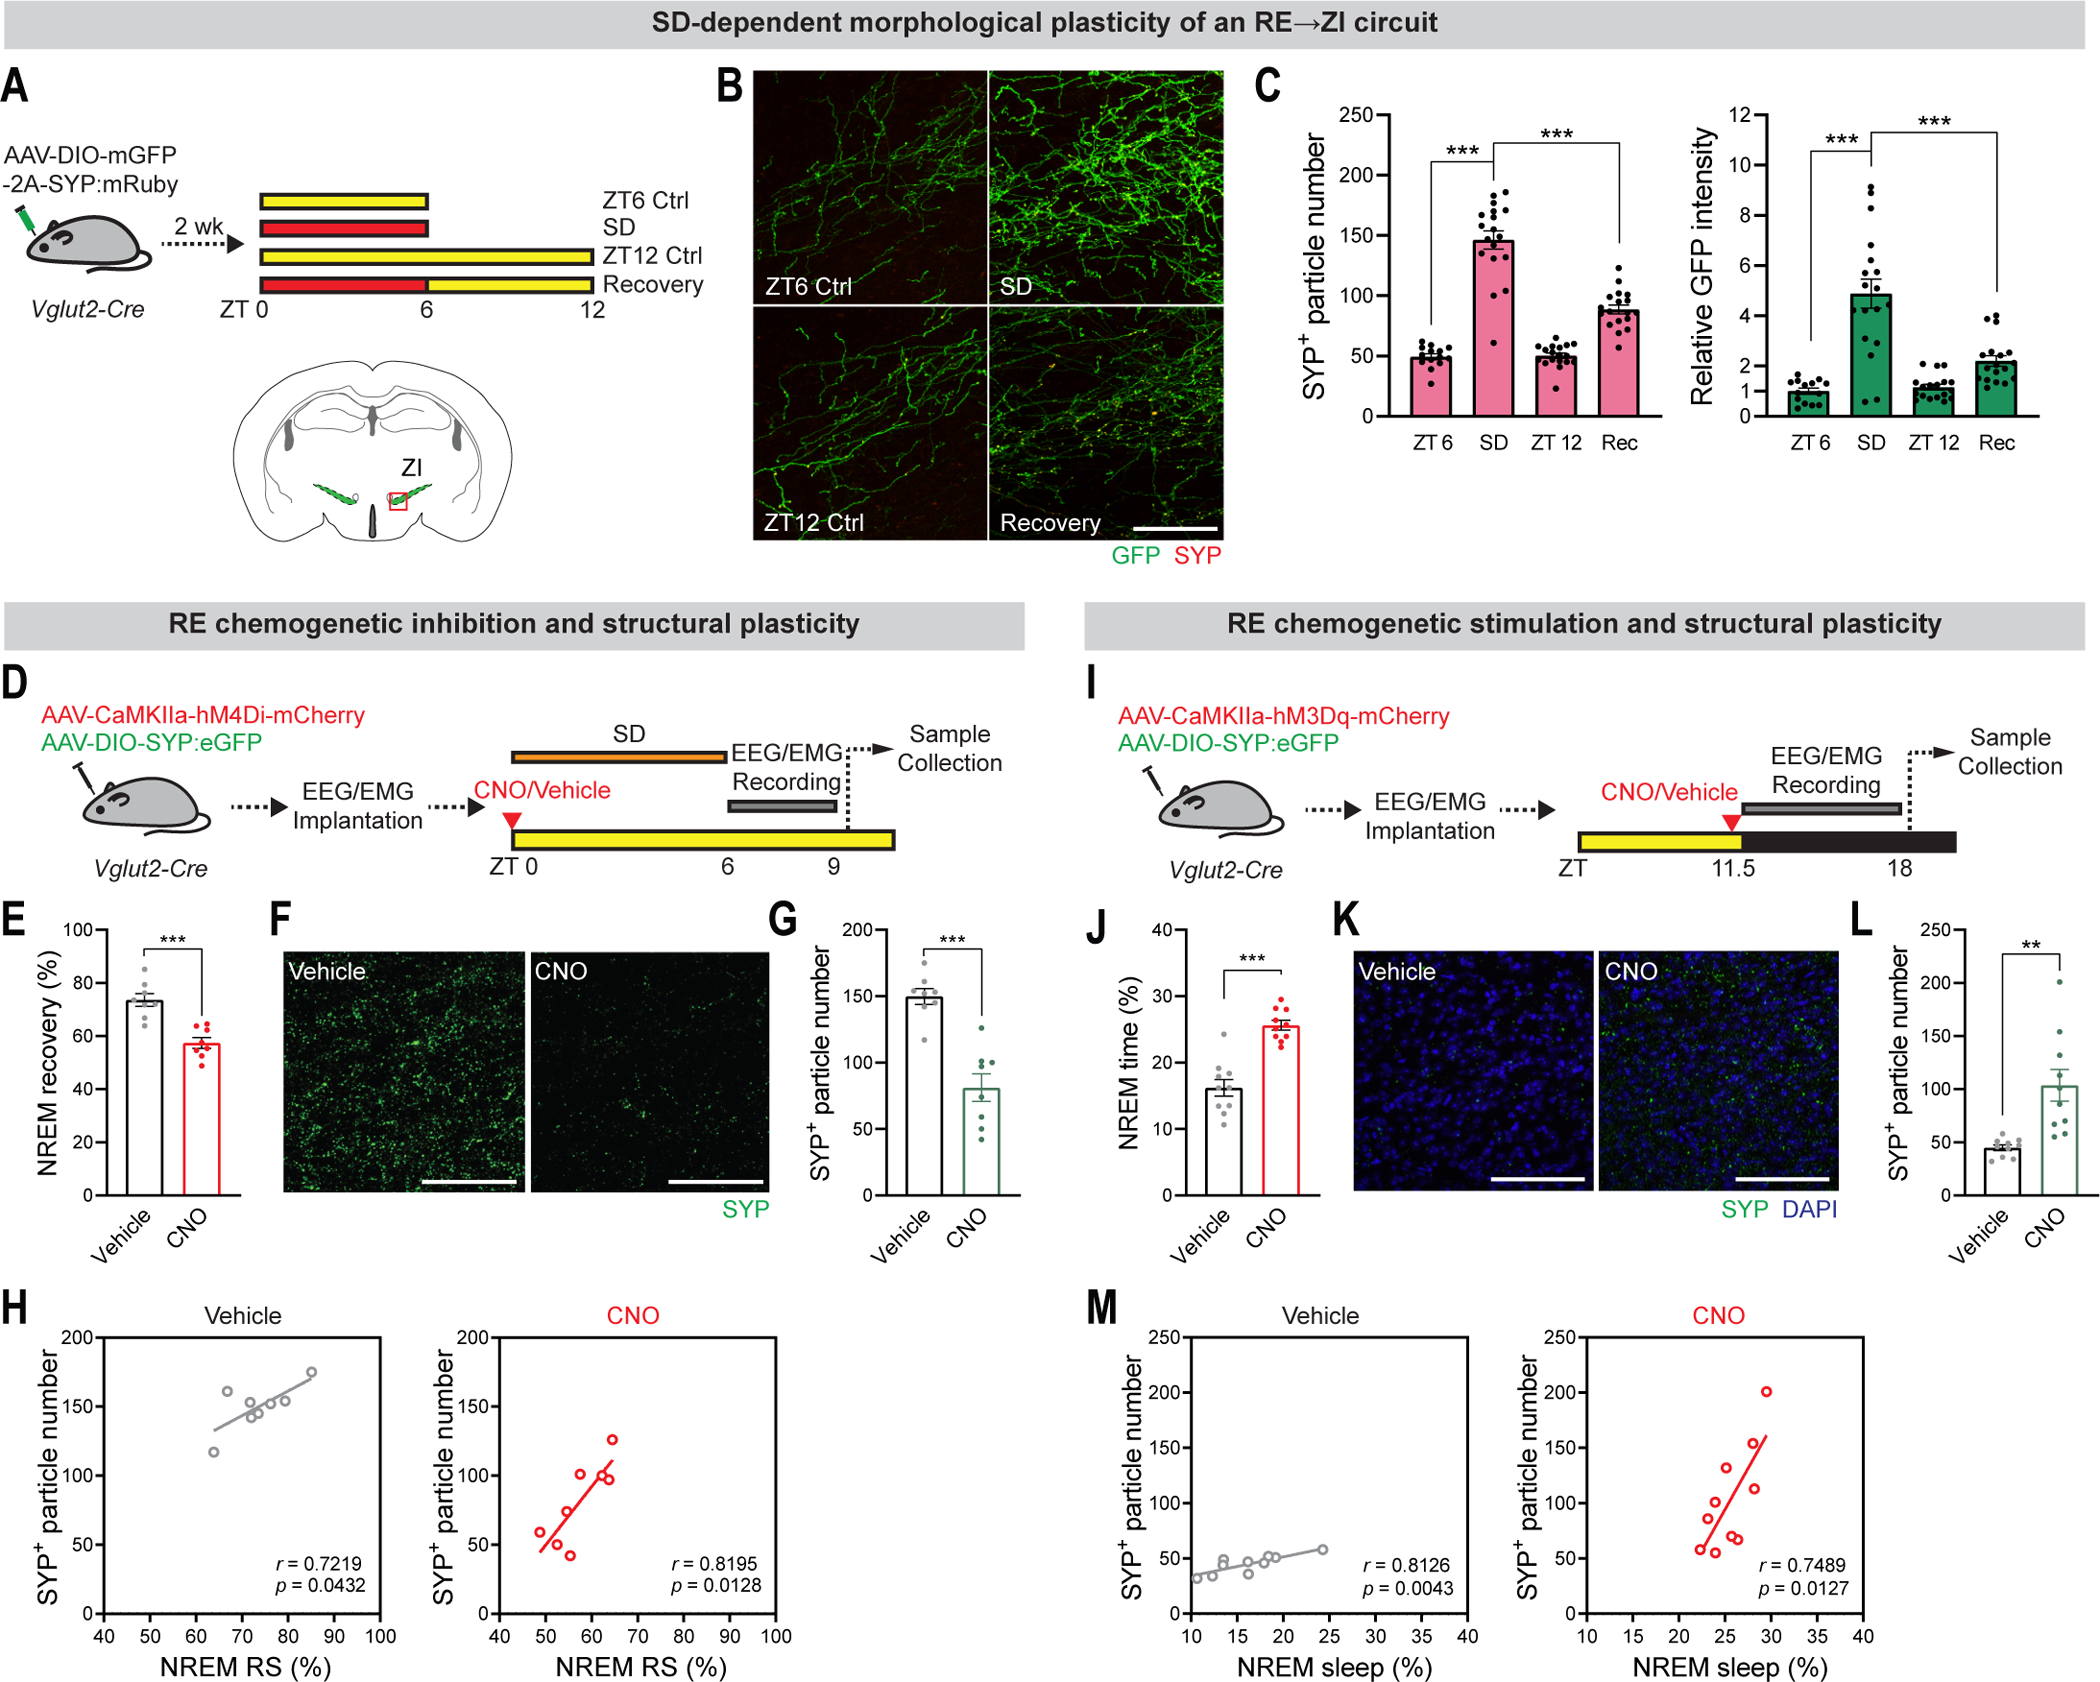
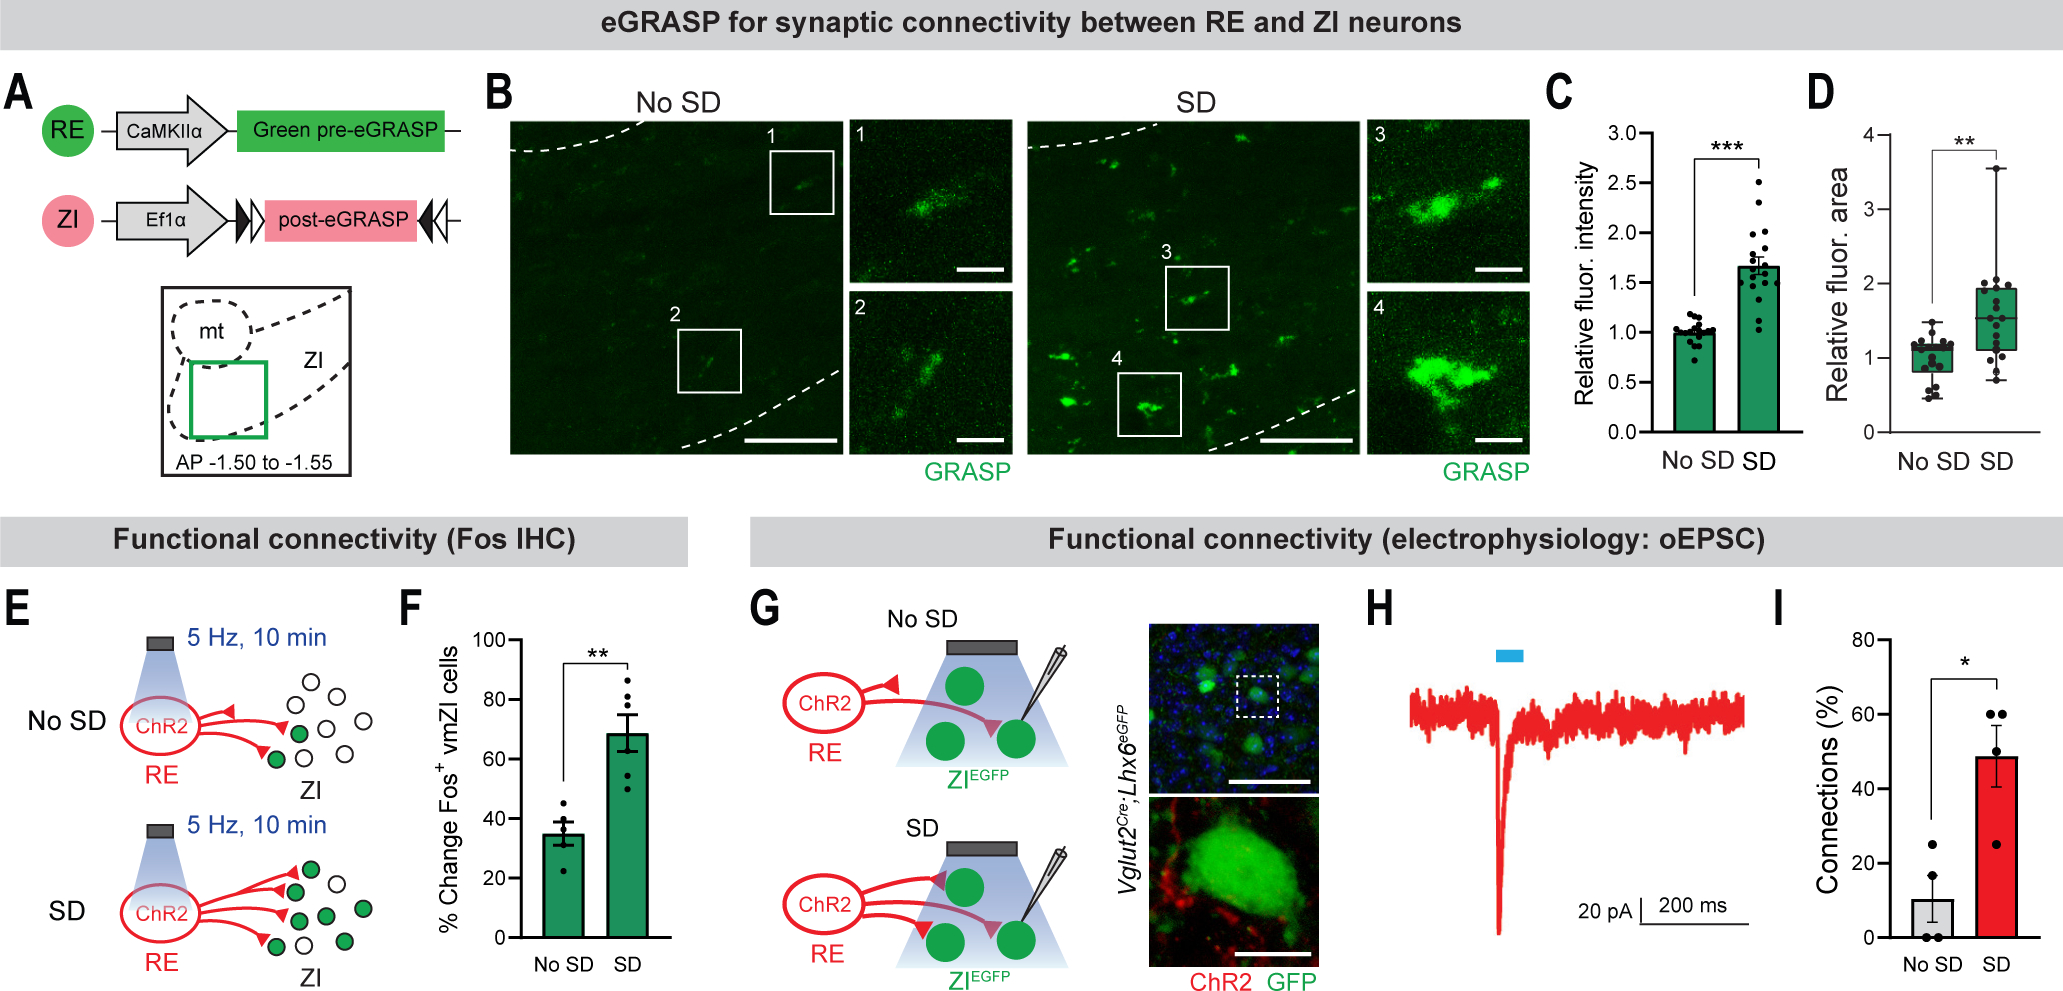
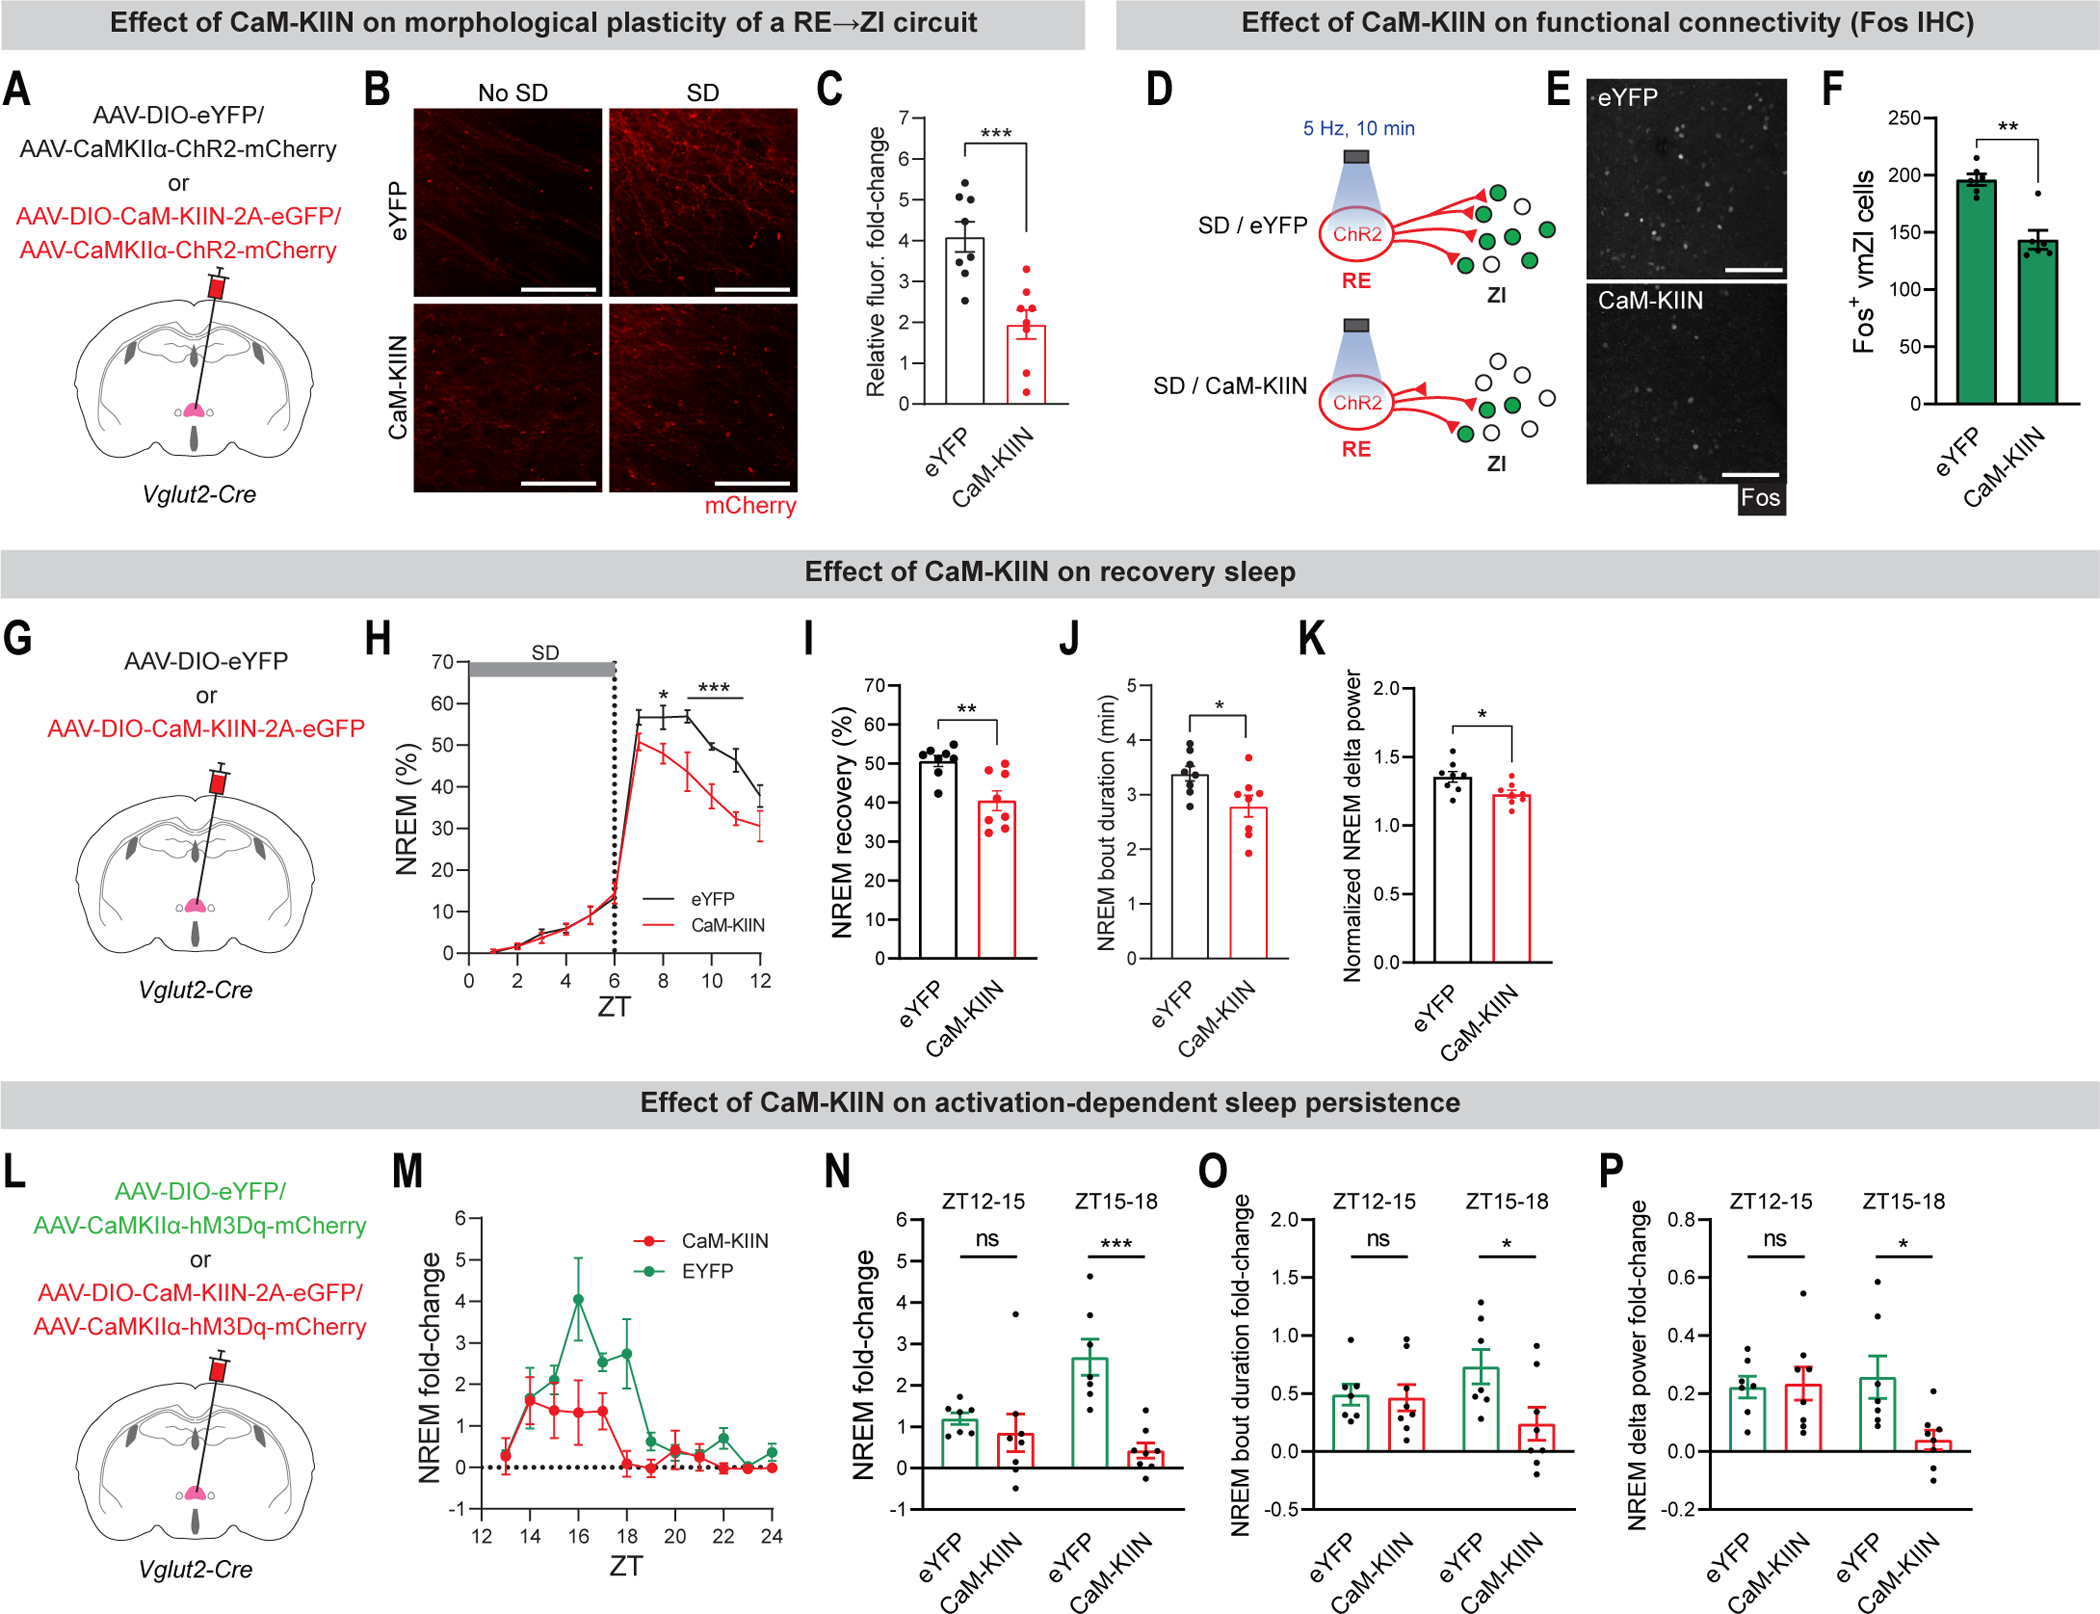
Prolonged wakefulness leads to persistent, deep recovery sleep (RS). However, the neuronal circuits that mediate this process remain elusive. From a circuit screen in mice, we identified a group of thalamic nucleus reuniens (RE) neurons activated during sleep deprivation (SD) and required for sleep homeostasis. Optogenetic activation of RE neurons leads to an unusual phenotype: presleep behaviors (grooming and nest organizing) followed by prolonged, intense sleep that resembles RS. Inhibiting RE activity during SD impairs subsequent RS, which suggests that these neurons signal sleep need. RE neurons act upstream of sleep-promoting zona incerta cells, and SD triggers plasticity of this circuit to strengthen their connectivity. These findings reveal a circuit mechanism by which sleep need transforms the functional coupling of a sleep circuit to promote persistent, deep sleep.


Conflict of interest statement

Competing interests: S.B. receives funding from Genentech and is a cofounder, shareholder, and Scientific Advisory Board member of CDI Labs LLC. The remaining authors declare no competing interests.

Figures

Fig. 1.
Fig. 1.. Glutamatergic neurons in mid RE (mRE) induce persistent, deep NREM sleep.
(A) Experimental schematic. (B) Schematic showing NREM sleep-promoting nuclei downstream of mid RE (mRE) neurons. Solid lines and dashed lines denote stronger and weaker projections, respectively. (C) Schematic depicting viral injection (above) and fluorescence image of the mREVglut2 neurons expressing hM3D(Gq)-mCherry (below); internal dashed lines indicate mRE region, scale bar, 200 μm. (D) EEG power spectrogram, EEG traces, and EMG traces during an 8 h window (ZT12-ZT20) post vehicle (above) or CNO (1.0 mg/kg, below) injection at ZT11.5. (E) % time in wakefulness (W), NREM sleep (N), and REM sleep (R) from ZT18-ZT22 following CNO (red) or vehicle (gray) injections (n=8). (F) Amount of NREM sleep during the nighttime following chemogenetic activation of mREVglut2 neurons at ZT11.5. Gray and red indicate vehicle- and CNO-treatment, respectively. (G) Relative NREM delta power following chemogenetic mREVglut2 activation, expressed as % of vehicle control. (H) Schematic of optogenetic mREVglut2 stimulation (above) and a fluorescence image of the mREVglut2 neurons expressing ChR2-eYFP (below); dashed lines indicate mRE and position of optical fiber is shown, scale bar, 200 μm. (I) EEG power spectrogram, EEG traces, and EMG traces showing photoactivation of mREVglut2 neurons at ZT13. Sham-stimulation (above) and 5 min of 20 Hz stimulation (below) are indicated by gray and blue bars, respectively. Insets illustrate expanded EEG and EMG traces. (J) % NREM amount before, during, and after optical (blue) or sham (gray) stimulation (n=6). “0” time indicates ZT13. Solid lines and shading denote mean and s.e.m., respectively. (K) % time for each vigilance state following photostimulation (blue) or sham-stimulation (gray) in the 1 hr window starting 20 min post-stimulation. (L and M) Normalized NREM power (L) and normalized NREM delta (0.5–4.0 Hz) power (M) during the 20–80 min post-stimulation window (Gray, sham-stimulation; Blue, stimulation). Error bars denote s.e.m.
Fig. 2.
Fig. 2.. Activation of mREVglut2 neurons promotes sleep preparatory behaviors.
(A) Behavioral state plots showing active behaviors (locomotion and eating/drinking), micromovement, pre-sleep behaviors (grooming and nesting), and immobility for a 30 min window starting 5 min before 5 min photostimulation (20Hz, blue box) for a Vglut2-Cre mouse expressing eYFP (left) or ChR2 (right) in mRE. Optical stimulation started at ZT13. (B) Raster plots of locomotion, eating/drinking, micromovement, grooming, nesting, and immobility of mice expressing ChR2 (red) or eYFP (gray) in mREVglut2 neurons. Blue shadings represent 5 min photostimulation. (C) % time spent performing specified behaviors in 10 min bins following optical stimulation of mREeYFP (open box) or mREChR2 (filled box) (n = 5 each). Time “0” indicates the time when the photostimulation ends. (D and E) Trajectory plots (D) and % time spent in nest area (E) for 5 min windows during and after photostimulation for mREeYFP and mREChR2 mice. Yellow circles in (D) represent the nest area. Open and filled boxes (E) indicate mREeGFP and mREChR2, respectively. Box and whisker plots in (C) and (E), where boxes denote 75th percentile, median, 25th percentile and whiskers indicate maximum and minimum.
Fig. 3.
Fig. 3.. mRE neuron activity is elevated during SD and reduced during RS.
(A) Experimental schematic. Left: A probe-implanted C57BL/6J mouse was housed in an acrylic chamber with bedding, nest, food, and water for one week prior to the test day. Right: A 4-shank Neuropixels 2.0 probe was chronically inserted into the mRE region at a 15° angle, at least 2 wks prior to recording. (B) Recording timeline. Data were recorded for 10 min each hr for 12 sessions, starting from ZT0. SD was performed from ZT0-ZT6; RS from ZT6-ZT12. (C) Data processing pipeline. Raw data were band-pass filtered (0.3–10 kHz), spikes were automatically detected, and units were sorted using KiloSort2.5. (D) Raw voltage traces. Each row shows the voltage recorded from a single site of a Neuropixels 2.0 probe implanted in the mRE. Representative data from 51 adjacent channels along one shank are presented. Spikes likely belonging to the same putative single unit are color-coded (output of KiloSort2.5) and labeled with the same number. (E) Firing rates of tracked units across recording sessions for four different mice. Thick line denotes average trace. mouse 1, n=124 neurons; mouse 2, n=72 neurons; mouse 3, n=81 neurons; mouse 4, n=70 neurons. (F and G) Box plots with whiskers showing averaged firing rates of all tracked units across each session (F) and pooled firing rates during SD vs RS (n=173 neurons for SD and n=209 neurons for RS) (G). Data in (E) to (G) excluded sessions where the mouse was “active” during RS (see Materials and Methods). (H) Heat map showing firing rates of all individual units (N=4 mice, n=115 units) that were tracked for at least 8 consecutive sessions. Right, scale bar: warm colors denote increased firing rate; cool colors denote decreased firing rate. White spaces indicate sessions where data were recorded, but neurons could no longer be tracked across sessions. For box and whisker plots in (F) and (G), boxes denote 75th percentile, median, 25th percentile and whiskers indicate maximum and minimum.
Fig. 4.
Fig. 4.. mRE neuron activity is required for homeostatic sleep rebound.
(A) Experimental schematic. Sleep deprivation (SD-TRAP) or non-SD (no SD-TRAP)-sensitive mRE cells were selectively labeled using a virally induced Fos-TRAP2 system. (B) EEG power spectrogram, EEG traces, and EMG traces from an mRESD-TRAP-hM3D(Gq) mouse during 3 hr post vehicle (left) or CNO (1.0 mg/kg, right) injection at ZT11.5. (C) % NREM sleep for mREno SD-TRAP (left) and mRESD-TRAP (right) mice following i.p. injection of vehicle (gray) or CNO (blue or red) (n=7 for mREno SD-TRAP and n=8 for mRESD-TRAP). (D to F) NREM amount (D), NREM bout duration (E), and normalized NREM delta power (F) during the ZT12–18 window for the mice shown in (A). (G) Schematic diagram depicting AAV-DIO-hM4D(Gi)-mCherry injection into mREVglut2 neurons. (H) % NREM sleep amount during and after 6 hr SD with injection of vehicle (gray) or CNO (3.0 mg/kg, red) at the beginning of SD (ZT0) (n=6). (I) NREM RS amount from ZT6–12 following SD for mice shown in (G) following injection of vehicle (gray) or 3.0 mg/kg CNO (red, n=6). (J and K) NREM bout duration (J) and normalized NREM delta power (K) of vehicle control (gray) and CNO-treated (red) for the mice shown in (G) during the first 3 hrs of RS. Error bars denote s.e.m.
Fig. 5.
Fig. 5.. mREVglut2 neurons signal to vmZILhx6 neurons to generate persistent NREM sleep.
(A) Schematic showing RV-mediated ChR2 expression strategy for photostimulation of mRE neurons projecting to vmZILhx6 cells. (B) EEG power spectrogram, EEG trace, and EMG trace showing optogenetic activation of vmZILhx6-projecting mRE neurons from a vmZILhx6 mouse expressing RV-ChR2. Optical stimulation (20 Hz, 5 min) at ZT13 is indicated by a blue bar. (C) % NREM amount following photostimulation (red) or sham-stimulation (gray) of mRE neurons (mRE→vmZILhx6) (n=6). (D) % time spent in wakefulness (W), NREM sleep (N), and REM sleep (R) for the 1 hr window starting from 20 min post-stimulation for 5-min photostimulation (red) vs sham-stimulation (gray). (E and F) NREM bout duration (E) and normalized NREM delta power (F). (G) Experimental schematic. mRECaMKIIα neurons were optogenetically activated in Lhx6-Cre mice where vmZILhx6 cells were left intact or ablated via expression of Cre-dependent eGFP or Casp3, respectively. (H) EEG power spectrograms, EEG traces, and EMG traces showing photostimulation of mRE neurons in a control (eGFP) or a vmZILhx6-ablated (Casp3) mouse at ZT13. Optical stimulations (20 Hz, 5 min) at ZT13 are indicated by blue bars. (I) % NREM sleep before, during, or after mRECaMKIIα photostimulation for the control (green) or vmZILhx6-ablated (red) mice. Gray represents sham-stimulation of each group (n=5 for control and n=6 for experimental groups). (J to L) % NREM sleep amount (J), NREM bout duration (K), and normalized NREM delta power (L) in the 1 hr window (20–80 min) following photostimulation (green or red) or sham-stimulation (gray) for control or vmZILhx6-ablated animals. Error bars denote s.e.m. Solid lines and shading in (C and I) denote mean and s.e.m., respectively.
Fig. 6.
Fig. 6.. Increased sleep need induces morphological plasticity of an mRE→vmZI circuit.
(A) Experimental schematic. To label presynaptic termini and fibers of mREVglut2 neurons, AAV-DIO-mGFP-2A-Syp:mRuby was injected into mRE of Vglut2-Cre mice. Two weeks later, the mice were divided into four groups: 6 hr SD from ZT0-ZT6 (SD), 6 hr RS from ZT6-ZT12 following 6 hr SD (Recovery), and their untreated control groups. Red bars and yellow bars indicate SD sessions and no treatment, respectively. (B) Fluorescence images for the conditions shown in (A). Scale bar represents 50 μm. (C) SYP particle number (left) and relative GFP intensity (right) at vmZI (n=14 mice for ZT6 control and n=18 mice for ZT12 control, 6 hr SD, and RS). GFP signals were normalized to the mean fluorescence intensity of ZT6 control group. (D) Schematic diagram depicting co-injection of AAV-CaMKIIα-hM4D(Gi)-mCherry and AAV-DIO-Syp:eGFP into the mREVglut2. (E) % NREM RS amount for vehicle- or CNO-treated mice during the 3 hr post-SD window. (n=8 each). (F) Confocal images of SYP signals in vmZI region for vehicle- or CNO-treated mice. Scale bars, 100 μm. (G) SYP particle numbers for control and CNO-treated groups. (H) Correlation between NREM RS amounts and SYP particle numbers at vmZI for vehicle-treated (left) and CNO-treated (right) groups (from D to G). (I) Schematic diagram illustrating co-expression of AAV-CaMKIIα-hM3D(Gq)-mCherry and AAV-DIO-Syp:eGFP in mREVglut2 neurons. (J) % NREM sleep amount for vehicle- or CNO-treated mice during ZT12–18. (n=10 each). (K) Confocal images of SYP signals in vmZI region for vehicle- or CNO-treated mice. Scale bars, 100 μm. (L) SYP particle numbers for control and CNO-treated groups. (M) Correlation between NREM sleep amounts and SYP particle numbers at vmZI for vehicle-treated (left) and CNO-treated (right) groups (from I to L). Error bars denote s.e.m.
Fig. 7.
Fig. 7.. Sleep deprivation enhances functional connectivity of an mRE→ZI circuit.
(A) Above, schematic illustrating AAVs injected into mRE and vmZI, respectively (AAV-CWB-pre-eGRASP for mRE and AAV-EWB-DIO-post-eGRASP for vmZI of Lhx6-Cre mice). Below, schematic depicting vmZI region (square) imaged for signal analyses. Dashed lines outline mammillothalamic tract (mt) and vmZI. Distance from bregma (mm) on the anterior-posterior (AP) axis is shown. (B) Native fluorescence images of eGRASP signals in vmZI area under baseline conditions (no SD) or following SD. Dashed lines outline vmZI, and scale bars represent 50 μm. Higher magnification images (insets 1–4) highlight examples of eGRASP signal, and scale bars represent 10 μm. (C and D) Relative signal intensity (C) and fluorescence area (D) of individual samples (two consecutive sections from unilateral vmZI per animal, n=9 mice each for sleep and SD, respectively). (E) Schematic showing sub-threshold optogenetic stimulation of mREVglut2 neurons leading to a pronounced increase in Fos labeling of vmZI cells following 6 hr SD (ZT0-ZT6), compared to no SD. AAV-DIO-hChR2(H134R)-mCherry virus was injected into mREVglut2. (F) % change of Fos+ cell numbers in vmZI following mREVglut2 stimulation for SD (n=6) vs no SD (n=5) groups. % change was calculated relative to sham-stimulated control groups. (G) Left: schematic showing whole-cell patch clamp recordings from vmZIeGFP cells from Vglut2-Cre;Lhx6-eGFP mice injected with AAV-DIO-hChR2-mCherry in the mRE, with concomitant optogenetic mREVglut2 activation in the presence or absence of 6 hr SD. Right: Fluorescence image of recorded GFP+ vmZI cell (above); scale bar, 100 μm. Below: high magnification image of cell in dashed box, scale bar indicates 20 μm. (H) Single oEPSC from GFP+ vmZI cells. (I) % responding vmZIeGFP cells to photostimulation of mREVglut2 terminals at vmZI in individual mice without (n=19 cells from 4 mice) or with SD (n=18 from 4 mice). Error bars denote s.e.m. For box and whisker plot in (D), boxes denote 75th percentile, median, 25th percentile and whiskers indicate maximum and minimum.
Fig. 8.
Fig. 8.. CamKII signaling is required for SD-induced mRE plasticity and homeostatic NREM recovery sleep.
(A) Experimental schematic. (B) Confocal images of mCherry signals in vmZI area, in the presence (SD) or absence (no SD) of 6 hr SD (ZT0–6). Scale bars indicate 100 μm. (C) Relative fold-change (SD / no SD) of mCherry signal intensities in vmZI following co-injection of ChR2-mCherry with eYFP or CaM-KIIN (n=8 for all groups). (D) Schematic showing sub-threshold optogenetic stimulation of mREVglut2 neurons following 6 hr SD (ZT0–6), where reduced Fos labeling is observed in vmZI cells with CaM-KIIN expression, compared to eYFP expression. (E and F) Confocal images (E, scale bars indicate 50 μm) and Fos+ cell numbers in vmZI following SD + photostimulation of mREVglut2-eYFP vs mREVglut2-CaM-KIIN groups (F). n=6 each, 3 brain slices from each mouse. (G) Schematic showing injection of AAV-DIO-CaM-KIIN-2A-eGFP or AAV-DIO-eYFP into the mRE of Vglut2-Cre mice. (H) % NREM sleep during and after 6-hr SD (ZT0–6) in mice expressing eYFP or CaM-KIIN in mREVglut2 neurons. (I to K) NREM RS amount (I), NREM bout duration (J), and normalized NREM delta power (K) of control eYFP- (black) vs CaM-KIIN-injected (red) mice during ZT6–12. (n=8 each). (L) Schematic illustrating co-injection of AAV-DIO-eYFP or AAV-DIO-CaM-KIIN-2A-eGFP with AAV-CaMKIIα-hM3D(Gq)-mCherry viral vectors into the mRE of Vglut2-Cre mice. (M) NREM fold-change (CNO / vehicle in 1 hr bins) from ZT12-ZT24 for mice expressing hM3D(Gq)/eYFP (n=7) or hM3D(Gq)/CaM-KIIN (n=8) in mREVglut2 neurons, following vehicle or CNO (1.0 mg/kg) injection at ZT11.5. Analyzed fold-changes (CNO / vehicle in 3 hr bins) of % NREM amount (N), NREM bout duration (O), and relative NREM delta power (P) of control (eYFP) or experimental (CaM-KIIN) groups in ZT12–15 or ZT15–18 windows (n=7 for control group and n=8 for experimental group). Error bars denote s.e.m.

Similar articles

Cited by

References

    1. Borbely AA, A two process model of sleep regulation. Hum Neurobiol 1, 195–204 (1982). - PubMed
    1. Deboer T, Behavioral and electrophysiological correlates of sleep and sleep homeostasis. Curr Top Behav Neurosci 25, 1–24 (2015). - PubMed
    1. Benington JH, Heller HC, Restoration of brain energy metabolism as the function of sleep. Prog Neurobiol 45, 347–360 (1995). - PubMed
    1. Halassa MM et al. , Astrocytic modulation of sleep homeostasis and cognitive consequences of sleep loss. Neuron 61, 213–219 (2009). - PMC - PubMed
    1. Ishimori K, True cause of sleep: a hypnogenic substance as evidenced in the brain of sleep-deprived animals. Tokyo Igakkai Zasshi 23, (1909).

LinkOut - more resources