. 2025 Sep;24(9):e70133.
doi: 10.1111/acel.70133. Epub 2025 Jun 19.

Integrative Multiparametric Analysis of Circulating Cell-Free Nucleic Acids of Plasma in Healthy Individuals During Aging

Affiliations

Integrative Multiparametric Analysis of Circulating Cell-Free Nucleic Acids of Plasma in Healthy Individuals During Aging

Nicolas P Tessier et al. Aging Cell. 2025 Sep.

Abstract

Plasma circulating cell-free nucleic acids (ccfNAs) provide an exceptional source of information about an individual's health, yet their biology in healthy individuals during aging remains poorly understood. Here, we present the first integrative multiparametric analysis of the major types of plasma ccfNAs, including nuclear (ccfnDNA) and mitochondrial (ccfmtDNA) DNA, as well as ribosomal (ccfrRNA), messenger (ccfmRNA) and micro-RNA (ccfmiRNA) in 139 healthy donors aged 19-66 years. We focused on quantity, integrity, and DNA methylation using an optimized experimental workflow that combines highly sensitive analytical methods with the detection of highly repetitive DNA and highly abundant RNA sequences, thereby reducing the required amount of ccfNAs per analysis. We showed a highly significant increase in ccfnDNA levels during aging (p < 0.001), associated with a decrease in its integrity (p < 0.05), while no significant changes were detected in ccfmtDNA levels and ccfDNA methylation. Moreover, a significant increase in ccfmRNA and ccfrRNA (p < 0.05), as well as miR-483-5p (p < 0.001) levels was detected during aging, but without any changes in ccfRNA integrity. Finally, we also showed that ccfDNA and ccfRNA levels were correlated (p < 0.001), and a similar pattern was observed for ccfmtDNA and ccfRNA levels, suggesting a possible common release, maintenance, and/or clearance mechanism. Therefore, our study provides an optimized workflow for the global analysis of ccfNAs, enhances the understanding of their biology during aging, and identifies several potential ccfNA-based biomarkers of aging.

Keywords: DNA methylation; aging; circulating cell‐free DNA; circulating cell‐free RNA; circulating cell‐free nucleic acids; miRNA; plasma.


Conflict of interest statement

The authors declare no conflicts of interest.

Figures

FIGURE 1
FIGURE 1
Overview of the experimental design used for the multiparametric analysis of circulating cell‐free nucleic acids from plasma. (A) Whole experimental workflow from blood collection to ccfNA analysis. (B) Sankey plot showing the volume equivalents of ccfNAs used for the different analyses in this study. ExoV, exonuclease V; HS, high‐sensitivity; rt., room temperature; RT, reverse transcription.
FIGURE 2
FIGURE 2
Plasma ccfDNA quantity and integrity variation during aging (n = 139). (A) ccfnDNA and ccfmtDNA qPCR assays used. (B) ccfnDNA quantification using Set 1 Kpn I repeat assays. (C) ccfmtDNA quantification. (D) ccfDNA integrity assessment using the integrity index based on the ratio of a large PCR amplicon to the smallest one. Mann–Whitney U tests were performed in box‐plots between each age group and between men and women of a same age group. The ‘+’ symbol indicates the mean value obtained for each group. Pearson's r coefficients and associated p‐values as well as linear regression lines are shown in scatterplots. p‐values < 0.05 are considered significant; * < 0.05, ** < 0.01, *** < 0.001.
FIGURE 3
FIGURE 3
Global plasma ccfDNA methylation variation during aging. (A) Line1 pyrosequencing assays. (B) DNA methylation profile obtained by pyrosequencing using 10 ng of DNA methylation standards ranging from 0 to 100% methylation (duplicate experiments). Shaded gray bands indicate excluded CpGs. (C) Line1 DNA methylation difference calculated between two different quantities of DNA methylation standards used as input (duplicate experiments). (D) Global ccfDNA methylation variation during aging measured using the mean DNA methylation value of Line1 (CpG1,3–7,9–10) (n = 139). Mann–Whitney U tests were performed in box‐plots between each age group and between men and women of the same age group. The ‘+’ symbol indicates the mean value obtained for each group. Pearson's r coefficients and associated p‐values, as well as linear regression lines, are indicated in scatterplots. p‐values < 0.05 are considered significant; * < 0.05, ** < 0.01, *** < 0.001.
FIGURE 4
FIGURE 4
Variation of plasma ccfRNA quantity and integrity during aging (n = 139). (A) mRNA and rRNA qPCR assays used for ccfRNA quantification. (B) Correlation of B2M ccfmRNA, GAPDH ccfmRNA, and 18S ccfrRNA quantity in plasma. (C) Variation of 18S ccfrRNA and B2M, GAPDH, and GSTA1/GSTA2 ccfmRNAs during aging. (D) Assessment of ccfrRNA integrity using the integrity index based on the ratio of a large 18S amplicon to the smallest one. Mann–Whitney U tests were performed in box‐plots between each age group and between men and women of the same age group. The ‘+’ symbol indicates the mean value obtained for each group. Pearson's r coefficients and associated p‐values, as well as linear regression lines, are indicated in scatterplots. p‐values < 0.05 are considered significant; * < 0.05, ** < 0.01, *** < 0.001.
FIGURE 5
FIGURE 5
Variation in the levels of different plasma ccfmiRNAs during aging (n = 133 samples). Age‐associated (miR‐126‐3p, miR‐21‐5p, miR‐483‐5p) and liver‐specific (miR‐122‐5p) ccfmiRNA relative expression levels during aging. Mann–Whitney U tests were performed in box‐plots between each age group and between men and women of the same age group. The ‘+’ symbol indicates the mean value obtained for each group. Pearson's r coefficients and associated p‐values, as well as linear regression lines, are shown in scatterplots. p‐values < 0.05 are considered significant; * < 0.05, ** < 0.01, *** < 0.001.
FIGURE 6
FIGURE 6
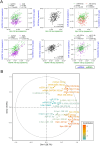
Comparison of ccfDNA and ccfRNA variations in plasma (n = 139 samples). (A) Correlation of ccfnDNA and ccfmtDNA, using Kpn I 60 bp and mtDNA 100 bp assays respectively, with ccfmRNA (GAPDH 102 bp, B2M 102 bp), ccfrRNA (18S 59 pb), and ccfmiRNA (miR‐126‐3p, miR‐21‐5p, miR‐483‐5p, miR‐122‐5p). Linear regression lines are shown, Pearson's r correlation coefficients and associated p‐values are indicated in each graph. p‐values < 0.05 are considered significant. (B) Principal component analysis of the different variables used. The contribution of the variables to the first two components is indicated by a color scale. II, integrity index.

References

    1. Accardi, G. , Bono F., Cammarata G., et al. 2022. “miR‐126‐3p and miR‐21‐5p as Hallmarks of Bio‐Positive Ageing; Correlation Analysis and Machine Learning Prediction in Young to Ultra‐Centenarian Sicilian Population.” Cells 11, no. 9: 1505. 10.3390/cells11091505. - DOI - PMC - PubMed
    1. Al Amir Dache, Z. , Otandault A., Tanos R., et al. 2020. “Blood Contains Circulating Cell‐Free Respiratory Competent Mitochondria.” FASEB Journal 34, no. 3: 3616–3630. 10.1096/fj.201901917RR. - DOI - PubMed
    1. Ameling, S. , Kacprowski T., Chilukoti R. K., et al. 2015. “Associations of Circulating Plasma microRNAs With Age, Body Mass Index and Sex in a Population‐Based Study.” BMC Medical Genomics 8: 61. 10.1186/s12920-015-0136-7. - DOI - PMC - PubMed
    1. Anisimova, A. S. , Alexandrov A. I., Makarova N. E., Gladyshev V. N., and Dmitriev S. E.. 2018. “Protein Synthesis and Quality Control in Aging.” Aging (Albany NY) 10, no. 12: 4269–4288. 10.18632/aging.101721. - DOI - PMC - PubMed
    1. Anisimova, A. S. , Meerson M. B., Gerashchenko M. V., Kulakovskiy I. V., Dmitriev S. E., and Gladyshev V. N.. 2020. “Multifaceted Deregulation of Gene Expression and Protein Synthesis With Age.” Proceedings of the National Academy of Sciences of the United States of America 117, no. 27: 15581–15590. 10.1073/pnas.2001788117. - DOI - PMC - PubMed

Substances

LinkOut - more resources