. 2025 Jun 19;16(1):5344.
doi: 10.1038/s41467-025-60363-7.

TGFα controls checkpoints in CNS resident and infiltrating immune cells to promote resolution of inflammation

Affiliations

TGFα controls checkpoints in CNS resident and infiltrating immune cells to promote resolution of inflammation

Lena Lößlein et al. Nat Commun. .

Abstract

After acute lesions in the central nervous system (CNS), the interaction of microglia, astrocytes, and infiltrating immune cells decides over their resolution or chronification. However, this CNS-intrinsic cross-talk is poorly characterized. Analyzing cerebrospinal fluid (CSF) samples of Multiple Sclerosis (MS) patients as well as CNS samples of female mice with experimental autoimmune encephalomyelitis (EAE), the animal model of MS, we identify microglia-derived TGFα as key factor driving recovery. Through mechanistic in vitro studies, in vivo treatment paradigms, scRNA sequencing, CRISPR-Cas9 genetic perturbation models and MRI in the EAE model, we show that together with other glial and non-glial cells, microglia secrete TGFα in a highly regulated temporospatial manner in EAE. Here, TGFα contributes to recovery by decreasing infiltrating T cells, pro-inflammatory myeloid cells, oligodendrocyte loss, demyelination, axonal damage and neuron loss even at late disease stages. In a therapeutic approach in EAE, blood-brain barrier penetrating intranasal application of TGFα attenuates pro-inflammatory signaling in astrocytes and CNS infiltrating immune cells while promoting neuronal survival and lesion resolution. Together, microglia-derived TGFα is an important mediator of glial-immune crosstalk, highlighting its therapeutic potential in resolving acute CNS inflammation.


Conflict of interest statement

Competing interests: All authors declare no competing interests.

Figures

Fig. 1
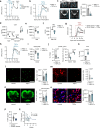
Fig. 1. Spatio-temporal regulation of microglia-derived TGFα during acute CNS inflammation.
a EAE development and timepoints (onset, peak, recovery, late recovery) used for immunohistochemical and flow cytometric analysis of CNS cells (n = 3/5 per group). b TGFα production (% of total) of microglia (MG), astrocytes (astro), monocytes (mono), pro-inflammatory (MHCII + ) monocytes and Ly6C- myeloid cells in brains and spinal cords (c) of EAE during onset, peak, recovery, late recovery, extremely late recovery and naïve mice (n = 3 per timepoint) quantified by intracellular flow cytometry. d UMAP plot of TGFα expression in subsampled CNS resident cells during course of EAE (n = 5–6 per timepoint) analysed by high-dimensional flow cytometry. e Immunostaining and quantification (f) of TGFα+ Iba1+ and TGFα + GFAP+ cells and DAPI for nuclear staining in spinal cords of EAE (onset, peak, recovery, late recovery; n = 3/5 per timepoint) and naïve mice (n = 5). Scale bar 50 µm. g Total TGFα production in spinal cords of EAE at onset, peak, recovery, late recovery, and naïve mice (n = 5 per timepoint) quantified by immunostaining. h Proportional TGFα+ microglia (Iba1 + ), astrocytes (GFAP + ), neurons (NeuN + ) (% of all cells, based on DAPI counts) in spinal cords of EAE at onset, peak, recovery, late recovery, and naïve mice (n = 5 per timepoint) quantified by immunostaining. i UMAP plot (left) of scRNA-seq dataset (Wheeler et al., 2020), showing cell clustering from CNS samples at peak of EAE including expression levels (right) of TGFα across distinct cell clusters: microglia/macrophages (MG/mac), monocytes/macrophages (mono/mac), neutrophils, endothelial cells, T cells, dendritic cells (DCs), neurons, astrocytes, oligodendrocytes, stromal cells, and smooth muscle cells. j UMAP plot of subsampled microglia in the spinal cord during course of EAE (n = 5-6 per timepoint) analysed by high-dimensional flow cytometry showing the expression levels of TGFα, CD45 and Ki67. k Relative EGFR expression (% of parent) of astrocytes (astro), microglia (MG), neutrophils (neutro), dendritic cells (DCs), macrophages (macro), pro-inflammatory (MHCII + ) monocytes, endothelial cells (endo), CD4 + T cells, B cells, PDGFRα+ and O4+ oligodendrocytes of EAE during onset (n = 4), peak (n = 6), recovery (n = 4), late recovery (n = 8) and naïve mice (n = 5) quantified by intracellular flow cytometry. *P < 0.05; **P < 0.01; ***P < 0.001; ****P < 0.0001. Data shown as mean ± SD. Data shown as mean ± SEM in (a, f). Data shown as mean (centre line) and mean ± SEM (b, c). One-way ANOVA with Dunnett’s multiple comparisons test in (bl).
Fig. 2
Fig. 2. Microglia-derived TGFα promotes protective effects during acute CNS inflammation.
a Delivery of lentiviruses (CD11b::scrmbl; CD11b::TGFα) via intracerebroventricular (i.c.v.) injection. b EAE development in mice transduced with CD11b::scrmbl (n = 5) or CD11b::TGFα (n = 5). c UMAP plot of CNS cells analysed by high-dimensional flow cytometry after dimensionality reduction in CD11b::scrmbl (n = 5) and CD11b::TGFα (n = 5) mice. d Abundance of CD4 + T cells, macrophages (macro), pro-inflammatory monocytes (mono) and B cells, neutrophils (e) oligodendrocyte lineage cells (OLC) (g) in the CNS of CD11b::scrmbl (n = 5) and CD11b::TGFα (n = 5) mice normalized to single live cells. f cytokine production by CD4 + T cells (IL17; IFNγ) in the CNS of CD11b::scrmbl (n = 5) and CD11b::TGFα (n = 5) mice analysed by intracellular flow cytometry. h Immunostaining (left) and quantification (right) of Olig2+ oligodendrocytes in spinal cords of CD11b::scrmbl (n = 5) and CD11b::TGFα (n = 4) mice. Scale bar 50 µm. i Immunostaining (left) and quantification (right) of SMI32 in spinal cords of CD11b::scrmbl (n = 5) and CD11b::TGFα (n = 4) mice. Scale bar 50 µm. j Measured area (white matter) for immunostaining (left) and analysis (right) (k) of Fluoromyelin (FM) in spinal cords of CD11b::scrmbl (n = 5) and CD11b::TGFα (n = 4) mice. Scale bar 200 µm. l Immunostaining (left) and quantification (right) of NeuN+ neurons (red) and DAPI for nuclear staining in spinal cords of CD11b::scrmbl (n = 10) and CD11b::TGFα (n = 9) mice. Scale bar 50 µm. Analyses performed at day 30 post immunization. Data shown as mean ± SD. Data shown as mean ± SEM in (b). Two-tailed non-parametric Wilcoxin matched-pairs signed-rank test in (b). Two-way ANOVA with Sidak’s multiple comparisons test in (d). Two-tailed unpaired t-test in (el).
Fig. 3
Fig. 3. TGFα promotes protective effects under inflammatory and demyelinating conditions.
a Schematic and RT-qPCR analysis (b) of Tnf, Nos2, and Il1b expression in primary mouse microglia stimulated with LPS ± TGFα. n = 4 per group. c Abundance (% of parent) of EGFR in primary mouse microglia stimulated with LPS ± TGFα analysed by high-dimensional flow cytometry. n = 4 per group. d Schematic and RT-qPCR analysis (e) of Egfr, Nos2, Lif and Ccl2 expression in primary mouse astrocytes stimulated with TNFα, IL-1β ± TGFα. n = 4 per group. f Relative expression (% of parent) of CCL2, NOS2, GM-CSF and Ki67 in primary mouse astrocytes stimulated with TNFα, IL-1β ± TGFα analysed by intracellular flow cytometry. n = 4 per group. g Schematic of bone-marrow derived macrophages (BMDM) and bone-marrow derived dendritic cells (BMDC) stimulated with LPS ± TGFα. n = 3/4 per group. h Relative expression (% of parent) of CD86, CD80, CD74 and EGFR in BMDM stimulated with LPS ± TGFα analysed by high-dimensional flow cytometry. n = 3 per group. i Flow cytometric analysis of CD86, CD80 and CD74 expression in bone-marrow derived dendritic cells (BMDC) stimulated with LPS ± TGFα. n = 3 per group. j Schematic and RT-qPCR analysis (k) of Bcl2 and Cxcl10 expression in primary mouse oligodendrocytes stimulated with TNFα ± TGFα. n = 3 per group. l Experimental setup for ex vivo culture of retinotectal system stimulated with IFNγ / lysolecithin (LCP) ± TGFα for immunohistochemical detection of RNA-binding protein with multiple splicing (RBPMS + ) retinal ganglion cells, Olig2+ oligodendrocytes and Fluoromyelin. m Immunostaining (left) and quantification (right) of Olig2+ oligodendrocytes and DAPI for nuclear staining in optic nerve explants following stimulation with IFNγ ± TGFα (− n = 5; + n = 7) or vehicle (n = 6). Scale bar 50 µm. n, Immunostaining (left) and quantification (right) of Fluoromyelin (FM) in optic nerve explants following stimulation with LCP ± TGFα (− n = 5; + n = 6) or vehicle (n = 8). Scale bar 200 µm. o Schematic of LCP-induced demyelination via injection of LCP ± TGFα into corpus callosum of each hemisphere. p Immunostaining (left) with Fluoromyelin (FM) and analysis (right) of LCP- induced demyelination in the corpus callosum. n = 7. Scale bar 200 µm. q Schematic and flow cytometric analysis (r) of neuronal cells (N2a) stained with Annexin V (A-V) and Propidium Iodid (PI) following stimulation with TNFα ± TGFα pre-stimulation of 4 hrs. r Quantification of early apoptotic (A-V + PI-) and late apoptotic (A-V + PI + ) neuronal cells following stimulation with TNFα ± TGFα, or vehicle. n = 4 per group. s Measured area (total, central, peripheral) for immunostaining (left) and quantification (right) (t) of RBPMS+ retinal ganglion cells in retinae stimulated IFNγ ± TGFα or vehicle (n = 4 per group). Scale bar 50 µm. Data shown as mean ± SD. Data shown as mean ± SEM in (mt). One-way ANOVA with Tukey’s multiple comparisons test in (bk). One-way ANOVA with Dunnett’s multiple comparisons test in (mt). Two-way ANOVA with Sidak’s multiple comparisons test in (r, t). Two-tailed unpaired in (fp).
Fig. 4
Fig. 4. TGFα as treatment target for lesion resolution in autoimmune CNS inflammation.
a Schematic workflow of intranasal TGFα treatment approach (pre-symptomatic and onset starting point) including MRI analysis at peak of disease and immunohistochemistry and flow cytometry during recovery from EAE. b EAE development in mice following intranasal treatment with TGFα or vehicle on a daily basis (start day 7) (n = 8). c MRI images (left) and quantification (right) of volume of contrast enhancing lesions (CEL, dotted line) in spinal cords of EAE mice following intranasal treatment with TGFα or vehicle. n = 4 per group. d CNS cells from TGFα or vehicle treated mice analysed by intracellular flow cytometry showing expression levels of proliferation (Ki67) marker and cytokine production (IFNγ, GM-CSF, IL17a) in CD4 + T cells. e Abundance of microglia (MG) including microglial GM-CSF production (f) in the CNS of TGFα or vehicle treated mice. n = 4 per group. g EAE development in mice transduced with GFAP::scrmbl (n = 5) GFAP::Erbb1 (n = 4) following intranasal treatment with TGFα or vehicle on a daily basis (start day 7). h EAE development in mice following symptomatic intranasal treatment with TGFα (n = 6) or vehicle (n = 4) on a daily basis (start day 12). i Abundance of CD44+ neutrophils (MFI) and pro-inflammatory monocytes (j left; % of total) and their cytokine (iNOS, Ki67) production (j right; % of parent) in the CNS of TGFα or vehicle treated mice (symptomatic). n = 4/5 per group. k Abundance of OLCs (% of total) in the CNS of TGFα or vehicle treated mice (symptomatic). n = 4/5 per group. l Immunostaining (left) and quantification (right) of Olig2+ oligodendrocytes in the spinal cord in EAE mice following symptomatic intranasal treatment with TGFα. n = 14/15 per group. Scale bar 50 µm. m Immunostaining (left) and quantification (right) of SMI32 in spinal cords of EAE mice following symptomatic intranasal treatment with TGFα. Scale bar 50 µm. n Immunostaining (left) and analysis (right) of Fluoromyelin (FM) in spinal cords following symptomatic intranasal treatment with PBS (n = 9) or TGFα (n = 14). Scale bar 200 µm. o Immunostaining (left) and quantification (right) of NeuN+ neurons and DAPI for nuclear staining in spinal cords of EAE mice following symptomatic intranasal treatment with TGFα. Scale bar 50 µm. n = 5 per group. p, Enzyme-linked Immunosorbent Assay (ELISA) of cerebrospinal fluid (CSF) samples from individuals with relapsing-remitting multiple sclerosis (RRMS; n = 10) and healthy controls (n = 17). q Simple linear regression analysis of Multiplex analysis (Linnerbauer et. al., 2024) of cerebrospinal fluid (CSF) samples from individuals with relapsing-remitting multiple sclerosis (RRMS; n = 47) and healthy controls (n = 20). Data shown as mean ± SD. Data shown as mean ± SEM in (bh). Two-tailed non-parametric Wilcoxin matched-pairs signed-rank test in (bh). Two-way ANOVA with Sidak’s multiple comparisons test in (d, j right). Two-tailed unpaired t-test in (cj left, kp). Simple linear regression in (q).

References

    1. Zheng, B. & Tuszynski, M. H. Regulation of axonal regeneration after mammalian spinal cord injury. Nat. Rev. Mol. Cell Biol.24, 396–413 (2023). - PubMed
    1. Hussain, R., Zubair, H., Pursell, S. & Shahab, M. Neurodegenerative diseases: regenerative mechanisms and novel therapeutic approaches. Brain Sci.8, 177 (2018). - PMC - PubMed
    1. Quan, L., Uyeda, A. & Muramatsu, R. Central nervous system regeneration: the roles of glial cells in the potential molecular mechanism underlying remyelination. Inflamm. Regen.42, 7 (2022). - PMC - PubMed
    1. Harris, M. G. et al. Immune privilege of the CNS is not the consequence of limited antigen sampling. Sci. Rep.4, 4422 (2014). - PMC - PubMed
    1. Meinl, E., Krumbholz, M., Derfuss, T., Junker, A. & Hohlfeld, R. Compartmentalization of inflammation in the CNS: A major mechanism driving progressive multiple sclerosis. J. Neurol. Sci.274, 42–44 (2008). - PubMed

MeSH terms

Substances

LinkOut - more resources