. 2025 Jun 19;9(1):198.
doi: 10.1038/s41698-025-00995-6.

G0S2: a potential target for NSCLC identified through prognostic models from multi-Omic analysis of regulatory T cell metabolic genes

Affiliations

G0S2: a potential target for NSCLC identified through prognostic models from multi-Omic analysis of regulatory T cell metabolic genes

Min Zhou et al. NPJ Precis Oncol. .

Abstract

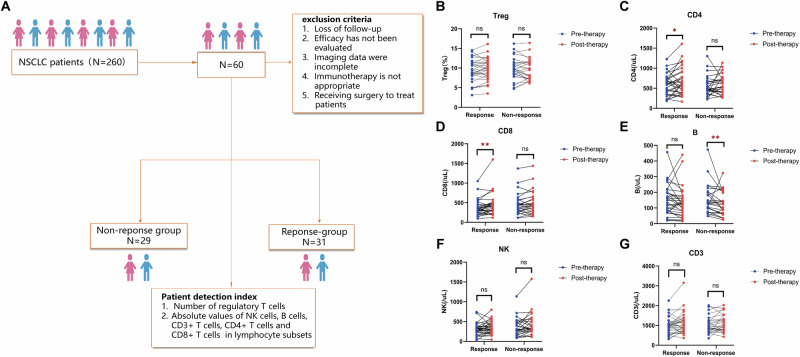
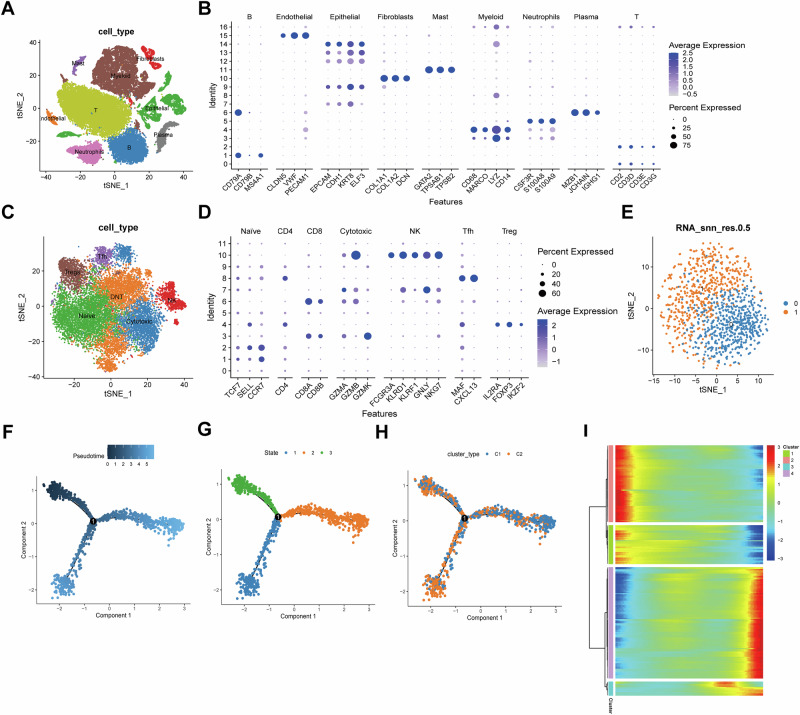
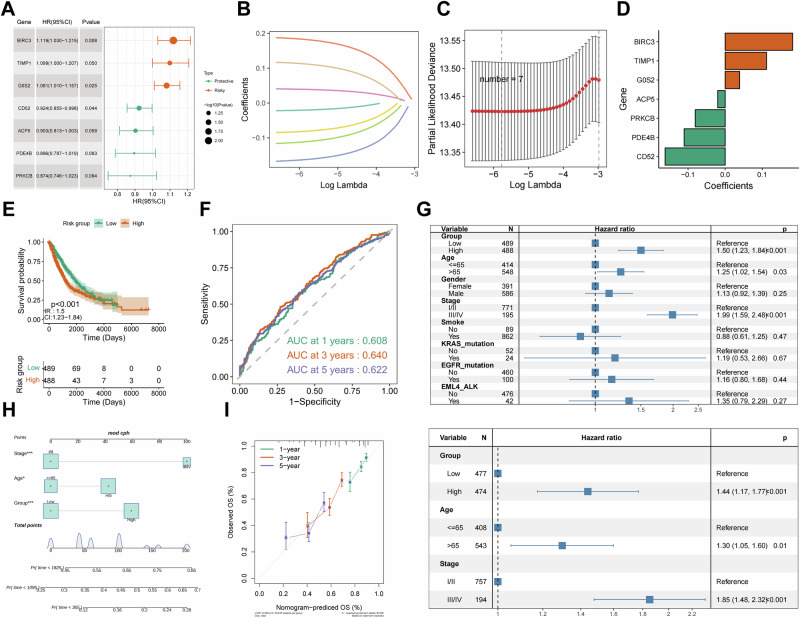
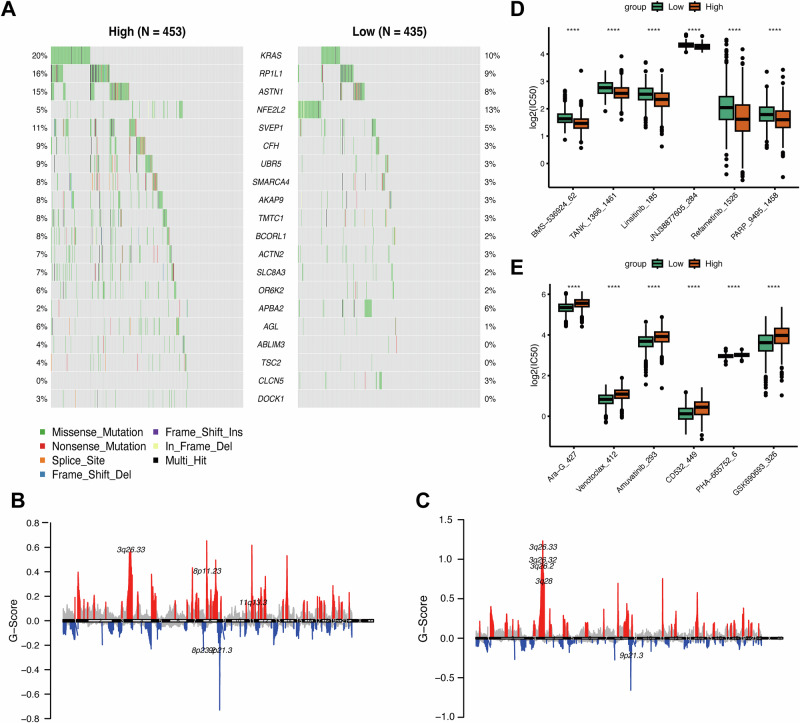
Non-small cell lung cancer (NSCLC) remains a leading cause of cancer-related mortality, with immunotherapy proving effective only in a subset of patients, highlighting the urgent need for improved biomarkers and therapeutic targets. This study explored regulatory T cell (Treg) metabolism-related genes in NSCLC and established a seven-gene prognostic signature (TIMP1, BIRC3, G0S2, PRKCB, PDE4B, CD52, and ACP5) through multi-omics analysis. The model stratified patients into high- and low-risk groups exhibiting distinct immune profiles and drug sensitivities. Clinical validation confirmed that elevated BIRC3 and G0S2 expression correlated with poorer prognosis, while functional assays demonstrated that G0S2 inhibition suppressed tumour progression and reduced Treg infiltration in vivo. These findings position G0S2 as a promising biomarker for immunotherapy response and a potential therapeutic target, providing insights into Treg-mediated immune regulation and advancing personalized NSCLC treatment strategies.


Conflict of interest statement

Competing interests: The authors declare that they have no competing interests. Consent for publication: All authors agreed to publish this manuscript.

Figures

Fig. 1
Fig. 1. Peripheral Blood Lymphocyte Subset Distribution in NSCLC patients.
A total of 60 patients with locally advanced or metastatic NSCLC receiving PD-1/PD-L1-based immunotherapy were retrospectively enrolled based on predefined exclusion criteria. Patients were classified into response (n = 31) and non-response (n = 29) groups according to clinical treatment outcomes (A). Peripheral blood samples were collected before and after treatment to assess changes in lymphocyte subsets. No significant differences in Treg cell proportions were observed in either group (B). CD4+ and CD8+T cell counts significantly increased after treatment in the response group, but not in the non-response group (C, D). B cell counts remained unchanged in the response group but significantly decreased in the non-response group (E). NK cells and CD3+ T cells showed no significant changes in either group (F, G). *P < 0.05, **P < 0.01, ns = not significant.
Fig. 2
Fig. 2. Single-cell analysis of T cell subsets.
Unsupervised clustering identified 16 cell clusters, grouped into nine major cell populations(A). Marker gene expression was used to annotate cell types(B). T cells were classified into Tfh, cytotoxic T cells, double-negative T cells (DNT), naïve T cells, natural killer (NK) cells and Tregs(C). Representative marker genes for each T cell subtype are shown(D). Tregs were subdivided into two transcriptionally distinct subclusters(E). Pseudotime trajectory analysis revealed a dendritic differentiation structure and identified the starting point(F). Three states were observed along the trajectory: pre-branch and two terminal branches(G). Treg cluster C1 was mainly located at the end of branch 2; C2 was enriched at the end of branch 1(H). Dynamic expression of differentially expressed genes along pseudotime was visualized as heatmaps(I).
Fig. 3
Fig. 3. Identification of prognostic treg metabolism-associated genes via WGCNA.
The significant difference in Treg infiltration scores between the paracancer samples and NSCLC samples are shown by the box - plot (A), and based on this, Kaplan -Meier survival curve demonstrated a difference in prognosis between groups with high and low Treg infiltration scores (B). The module genes were statistically analysed and divided into 22 modules, and it was found that the modules brown, magenta and grey60 had the closest relationships with Treg infiltration scores (C). Volcano map of differentially expressed genes in NSCLC and paracancer samples (D), and between groups with high and low Treg infiltration scores (E). Identifying 26 key Treg cell metabolic genes by intersecting different genes (F).
Fig. 4
Fig. 4. Construction and validation of a treg-associated prognostic model in NSCLC.
A univariate Cox regression analysis was performed on the expression profiles of 26 genes to evaluate their potential impact on the overall survival (OS) of patients, and seven genes were significantly associated with OS (A). Subsequently, the LASSO Cox regression method was used to develop a prognostic feature model based on these seven genes (BIRC3, TIMP1, G0S2, ACP5, PRKCB, PDE4B, CD52) (BD). Patients were stratified into high-risk and low-risk groups based on median risk scores calculated by the model, and survival analysis revealed that the OS of patients in the high-risk group was significantly lower than that in the low-risk group (E). Time-dependent ROC curve analysis confirmed the model’s moderate accuracy in predicting 1-year, 3-year, and 5-year survival rates (F). Univariate and multivariate Cox regression analyses identified independent prognostic factors, presented in a forest plot where the final column displays the hazard ratio (HR), 95% confidence interval (CI), and p-value in a compact format (G). A nomogram was established based on independent prognostic factors to predict overall survival (H), and the calibration curves for the nomogram are presented (I).
Fig. 5
Fig. 5. Immune Microenvironment Profiling and Immunotherapy Response Prediction Based on the Prognostic Model.
Expression differences of immune modulators between high and low risk score groups (A), and expression correlations between genes characterising risk scores and immune checkpoints (B). Results of GSEA KEGG analysis and GSEA GO analysis in the high-risk score group (C, D). Differences in predictors of immunotherapy response between high and low risk score groups (E-H). Relationship between risk scores and immunotherapy response in the GSE126044 dataset (I, J).
Fig. 6
Fig. 6. Genomic alterations and chemotherapy sensitivity associated with the prognostic risk model in NSCLC.
Single nucleotide variations (SNVs) were compared between high- and low-risk NSCLC patients, with higher mutation frequencies observed in genes such as KRAS, RP1L1 and ASTN1 in the high-risk group (A). Copy number variation (CNV) analysis revealed more extensive amplifications in the high-risk group, especially at chromosomes 3q, 7p and 11q (B, C). Spearman correlation analysis showed that the IC50 values of BMS_536924, TANK_1366, linsitinib, JNJ38877605, refametini, and PARP_9495 were negatively correlated with risk scores (D), while the IC50 values of GSK690693, PHA_665752, CD532, amuvatinib, venetoclax and Ara-G were positively correlated (E).
Fig. 7
Fig. 7. Expression and clinical relevance of prognostic risk model–associated key genes in NSCLC.
Using qRT-PCR to validate mRNA expression levels of TIMP1, BIRC3, and G0S2 in NSCLC tissues compared to adjacent non-cancerous tissues, with **P < 0.01, ***P < 0.001 (A-C). Quantitative analysis of TIMP1, BIRC3 and G0S2 expression in adjacent non-cancerous tissues and NSCLC tumour tissues. Statistical analysis was performed using the Student’s t-test, with ****P < 0.0001 (DI). Kaplan-Meier survival curves for TIMP1, BIRC3 and G0S2 in NSCLC patients. Note: NA indicates not achieved (JL). Multiplex immunofluorescence of tumour tissue (M, P) and adjacent tissue (N, Q), and CD4+, FOXP3+ and BIRC3+ ratio of tumour tissue and adjacent tissue (O, R).
Fig. 8
Fig. 8. Key gene G0S2 overexpression promotes lung cancer progression and treg infiltration.
Representative Western blot images showing G0S2 protein expression in LLC-G0S2OE (G0S2 overexpression) and LLC-EV-Control (empty vector control) cells. β-actin was used as a loading control (A, B). The models were established using the mouse NSCLC cell lines LLC-G0S2OE and LLC-EV-Control. Survival and body weight of mice bearing orthotopic lung cancer models were recorded. N = 7 (MST: median survival time) (C, D). Bioluminescence signals from orthotopic lung cancer models were monitored weekly using an in vivo imaging system. N = 4 (E, F). On day 28 post-tumour implantation, mice were euthanized, and lung tumours were excised and weighed. N = 5 (G). On day 28 post-tumour implantation, flow cytometry was performed to analyse CD4+ T cells, CD8+ T cells and Tregs in the lung tumour tissue. N = 3. All data are expressed as mean ± standard deviation. Statistical significance: ns, nonsignificant (P > 0.05); *, P < 0.05 (H, I).

Similar articles

References

    1. Siegel, R. L., Miller, K. D. & Jemal, A. Cancer statistics, 2020. CA Cancer J. Clin.70, 7–30 (2020). - PubMed
    1. Howlader, N. et al. The Effect of Advances in Lung-Cancer Treatment on Population Mortality. N. Engl. J. Med.383, 640–649 (2020). - PMC - PubMed
    1. Duma, N., Santana-Davila, R. & Molina, J. R. Non-Small Cell Lung Cancer: Epidemiology, Screening, Diagnosis, and Treatment. Mayo Clin. Proc.94, 1623–1640 (2019). - PubMed
    1. Boumahdi, S. & de Sauvage, F. J. The great escape: tumour cell plasticity in resistance to targeted therapy. Nat. Rev. Drug Discov.19, 39–56 (2020). - PubMed
    1. Sawant, D. V. et al. Adaptive plasticity of IL-10(+) and IL-35(+) T(reg) cells cooperatively promotes tumor T cell exhaustion. Nat. Immunol.20, 724–735 (2019). - PMC - PubMed

LinkOut - more resources