. 2025 Jun 19;16(1):5313.
doi: 10.1038/s41467-025-60534-6.

Herpes simplex virus type 1 reshapes host chromatin architecture via transcription machinery hijacking

Affiliations

Herpes simplex virus type 1 reshapes host chromatin architecture via transcription machinery hijacking

Esther González-Almela et al. Nat Commun. .

Abstract

Herpes simplex virus type 1 (HSV-1) remodels the host chromatin structure and induces a host-to-virus transcriptional switch during lytic infection. We combine super-resolution imaging and chromosome-capture technologies to identify the mechanism of remodeling. We show that the host chromatin undergoes massive condensation caused by the hijacking of RNA polymerase II (RNAP II) and topoisomerase I (TOP1). In addition, HSV-1 infection results in the rearrangement of topologically associating domains and loops, although the A/B compartments are maintained in the host. The position of viral genomes and their association with RNAP II and cohesin is determined nanometrically. We reveal specific host-HSV-1 genome interactions and enrichment of upregulated human genes in the most contacting regions. Finally, TOP1 inhibition fully blocks HSV-1 infection, suggesting possible antiviral strategies. This viral mechanism of host chromatin rewiring sheds light on the role of transcription in chromatin architecture.


Conflict of interest statement

Competing interests: The authors declare no competing interests.

Figures

Fig. 1
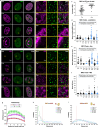
Fig. 1. Host chromatin undergoes high compaction without epigenetic changes at different times post HSV-1 infection.
a Scheme showing hDNA labeling. A549 cells were cultured in medium supplemented with 5 µM EdC for 64 h before HSV-1 infection to ensure the complete labeling of the whole cellular DNA. Cells were infected with HSV-1 (MOI = 3), and fixed at different times post infection. Samples were then labeled with the azide-Alexa 647 (AF647). b Representative STORM density rendering images of hDNA in mock or HSV-1 infected A549 cells. Top: Whole nucleus. Scale bar: 2 µm. Bottom: Zoomed-in regions are shown in yellow boxes. Scale bar: 200 nm. Differences in DNA density follow the color scale bar; top: 0.00001 nm−2 (dark blue) to 0.01281 nm−2 (white); bottom: 0.00001 nm−2 (dark blue) to 0.02001 nm−2 (white). c Cumulative distribution of the Voronoi polygon densities for hDNA distribution in mock (n = 29), and HSV-1 infected cells at 1 hpi (n = 27), 3 hpi (n = 27), and 8 hpi (n = 45). Thick lines show the median and light colors, the interquartile range. ns, p > 0.05; ****p < 0.0001, calculated by ordinary one-way ANOVA followed by Dunnet’s multiple comparison test against mock. d Percentage of hDNA-free area per nucleus of EdC-AF647 labeled hDNA in mock (n = 29), and HSV-1 infected cells at 1 hpi (n = 27), 3 hpi (n = 27), and 8 hpi (n = 45). Mean and SD represented; ns, p > 0.05; ****p < 0.0001, calculated by ordinary one-way ANOVA followed by Dunnett’s multiple comparison test against mock. e Cropped representative STORM-PAINT images of EdC-AF647 labeled hDNA (magenta), immunolabeled ICP4 (cyan), and their merge in mock and HSV-1 infected cells. Yellow dotted line delimits the location of HC and VRCs. Scale bar: 2 µm f (Top) Cropped representative STORM-PAINT images of EdC-AF647 labeled hDNA (magenta), immunolabeled H3 (green), and their merge in mock and HSV-1 infected A549 cells. Scale bar: 2 µm. (Bottom) Zoomed-in regions are shown inside yellow boxes. Scale bar: 200 nm. g Percentage of hDNA-free and H3-free areas per nucleus quantified from SR images of mock (n = 16), or HSV-1 infected A549 cells at 1 hpi (n = 13), 3 hpi (n = 16), and 8 hpi (n = 19). Mean and SD are represented. ns, p > 0.05; **p < 0.01; ***p < 0.001; ****p < 0.0001, calculated by ordinary one-way ANOVA followed by Dunnett’s multiple comparison test against hDNA or H3 mock, correspondingly. h Percentage of H3 clusters located in the HC over the whole nucleus at 3 hpi (n = 16) and 8 hpi (n = 19) in HSV-1 infected A549 cells. Mean and SD are shown. ns, p > 0.05, calculated by unpaired, two-tailed Student’s test. i, j Dot plots showing the median number of localizations per cluster (i) and the median area per cluster (j) in mock (n = 16), and HSV-1 infected cells at 1 hpi (n = 13), 3 hpi (n = 16), and 8 hpi (n = 19). Analysis performed on H3 clusters localized in the whole nucleus for mock and 1 hpi and in the HC for 3 hpi and 8 hpi. Mean and SD are shown. ns, p > 0.05; *p < 0.05; **p < 0.01; ***p < 0.001, calculated by ordinary one-way ANOVA followed by Dunnett’s multiple comparison test against mock. k hDNA density as a function of the distance from the center of the H3 clutch in mock (n = 12), and HSV-1 infected cells at 1 hpi (n = 8), 3 hpi (n = 16), and 8 hpi (n = 18). Density is measured inside rings of increasing search radii. Mean and SD shown. l-o Dot plots showing the percentage of histone-free area (l), the cluster density (m), median localizations per cluster (n) and median area per cluster (o) for H3K27me3 in HSV-1 infected A549 cells. Mock (n = 13), 1 hpi (n = 11), 3 hpi (n = 10), 4 hpi (n = 9), 6 hpi (n = 13), 8 hpi (n = 12). Mean and SD are shown. ns, p > 0.05; **p < 0.01; ****p < 0.0001, calculated by ordinary one-way ANOVA followed by Dunnett’s multiple comparison test against mock. Source data are provided as a Source Data file. p values are indicated in Supplementary Data 1.
Fig. 2
Fig. 2. ICP4-mediated sequestration of RNAP II phSer5 out of the HC is necessary for hDNA compaction.
a (Left) Cropped representative STORM-PAINT images of EdC-AF647 labeled hDNA (magenta), immunolabeled RNAP II phSer5 (green), and their merge in mock and HSV-1 infected A549 cells at 1 hpi, 3 hpi, and 8 hpi. Yellow arrowheads indicate large aggregates of RNAP II phSer5. Scale bar: 2 µm. (Right) Zoomed-in regions are shown in yellow boxes. Scale bar: 200 nm. b Percentage of RNAP II phSer5 clusters located in VRCs over the whole nucleus in HSV-1 infected A549 cells at 3 hpi (n = 20), and 8 hpi (n = 14). Mean and SD are shown. **p < 0.01, calculated by unpaired, two-tailed Student’s t test. c–e Dot plots showing the median number of RNAP II phSer5 localizations per cluster (c), the median area per cluster (d) and the NND between clusters (e), for mock (n = 44) and HSV-1 infected A549 cells at 1 hpi (n = 32), 2 hpi (HC, n = 15; VRC, n = 8), 3 hpi (HC, n = 20; VRC, n = 20), and 8 hpi (HC, n = 14; VRC, n = 28). Mean and SD are shown. ns, p > 0.05; *p < 0.05; ***p < 0.001; ****p < 0.0001; calculated by ordinary one-way ANOVA followed by Dunnett’s multiple comparison test against mock. f Representative conventional images of hDNA (magenta), conventional ICP4 (cyan), and cropped STORM images of RNAP II phSer5 (green), in mock, HSV-1 infected cells and HSV-1 n12 infected cells at 3 and 8 hpi. Scale bar: 2 µm. g Representative STORM density rendering images of hDNA in mock or HSV-1 WT and HSV-1 n12 infected A549 cells. Scale bar: 2 µm. Differences in DNA density follow the color scale bar; top: 0.00001 nm−2 (dark blue) to 0.01518 nm−2 (white). h Cumulative distribution of the Voronoi polygon densities for hDNA distribution in mock, HSV-1 and HSV-1 n12 infected cells at 3 hpi and 8 hpi. Mock (n = 24), 3 hpi WT (n = 22), 3 hpi n12 (n = 32), 8 hpi WT (n = 26), 8 hpi n12 (n = 24). Thick lines show the median and light colors, the interquartile range. ns, p > 0.05; **p < 0.001, ***p < 0.001, calculated by ordinary one-way ANOVA followed by Dunnet’s multiple comparison test against mock. i Percentage of hDNA-free area per nucleus of EdC-AF647 labeled hDNA in mock, HSV-1 WT and HSV-1 n12 infected cells at 3 hpi and 8 hpi. Mock (n = 24), 3 hpi WT (n = 22), 3 hpi n12 (n = 32), 8 hpi WT (n = 26), 8 hpi n12 (n = 24). Mean and SD represented; ns, p > 0.05; ****p < 0.0001, calculated by ordinary one-way ANOVA followed by Dunnett’s multiple comparison test against mock. Source data are provided as a Source Data file. p-values are indicated in Supplementary Data 1.
Fig. 3
Fig. 3. RNAP II phSer5 progressively associates to viral genomes.
a Scheme showing the labeling of newly replicated viral DNA. A549 cells were infected with HSV-1 for 1 h at 37 °C. At the chosen times post infection, the medium was supplemented with 40 µM EdC for 1 h before fixation. Cells were fixed and click chemistry was performed. Only the DNA replicated during this 1 h could incorporate EdC, ensuring the exclusive labeling of the vDNA synthetized at the timepoints of interest. b (Left) Cropped representative STORM-PAINT images of EdC-AF647 labeled newly replicated vDNA (magenta), immunolabeled RNAP II phSer5 (green), and their merge in mock and HSV-1 infected A549 cells. Scale bar: 2 µm. (Right). Zoomed-in regions are shown in yellow boxes. Scale bar: 200 nm. c–e Dot plots showing newly replicated vDNA cluster density (c), median number of localizations per vDNA cluster (d) and median area per vDNA cluster (e) for HSV-1 infected A549 cells at 2 hpi (n = 14), 3 hpi (n = 19), and 8 hpi (n = 28). Mean and SD are shown. ns, p > 0.05; **p < 0.01; ***p < 0.001; calculated by ordinary one-way ANOVA followed by Tukey’s multiple comparison test. f, g Nearest neighbor distance (NND) distribution plot of the distance between RNAP II phSer5 and newly replicated vDNA clusters, using either active polymerase (f) or vDNA (g) as the origin, in HSV-1 infected A549 cells at 2 hpi (n = 8), 3 hpi (n = 19) and 8 hpi (n = 28). Experimental data are shown as continuous lines, random simulated data are displayed as dotted lines. The dotted line at 100 nm represents the threshold for considering that the two clusters interact. **p < 0.01; ***p < 0.001; ****p < 0.0001; calculated by paired, two-tailed Student’s t test. Source data are provided as a Source Data file. p-values are indicated in Supplementary Data 1.
Fig. 4
Fig. 4. VRCs become highly transcriptionally active concomitantly with RNAP II sequestering and human chromatin compaction.
a Scheme showing the labeling of the nascent transcriptome. A549 cells were infected with HSV-1 for 1 h at 37 °C. Cells were incubated in medium with 1 mM EU for 30 min. Only the newly transcribed RNA is labeled. b Cropped representative STORM images of EU-AF647 labeled RNA (magenta), conventional images of immunolabeled RNAP II phSer5 (green), and their merge in mock and HSV-1 infected A549 cells. Scale bar: 2 µm. (Right). Zoom of the RNA regions inside the yellow boxes. Scale bar: 200 nm. c Conventional image of EU-AF647 labeled RNA (magenta) and DAPI labeled DNA (cyan) in A549 cells at 8 h post HSV-1 infection. Scale bar: 5 µm. d–f Dot plots showing the RNA nanodomain density (d), the median number of localizations per RNA nanodomain (e) and the median area per RNA nanodomain (f) in mock (n = 19) and HSV-1 infected A549 cells at 1 hpi (n = 18), 3 hpi (n = 18), and 8 hpi (n = 30). Mean and SD are shown. ns, p > 0.05; **p < 0.01; ***p < 0.001; ****p < 0.0001, calculated by ordinary one-way ANOVA followed by Dunnett’s multiple comparison test against mock. g Percentage of total TPM belonging to human (orange) or viral (blue) transcripts in mock and HSV-1 infected A549 cells at 1, 3, and 8 hpi. n = 3 for each condition. Mean and SD are shown. h–j Scatter plots showing the levels of mRNA expression of protein coding genes observed in the mock condition versus 1 (h), 3 (i) and 8 (j) hpi. Dotted red line shows the regression. k Heatmap showing the averaged z-score of genes of interest in mock and HSV-1 infected cells at 1, 3, or 8 hpi, after DESeq2 analysis. Source data are provided as a Source Data file. p-values are indicated in Supplementary Data 1.
Fig. 5
Fig. 5. SMC3 is sequestered out of the HC and associates with viral genomes.
a (Left) Cropped representative STORM-PAINT images of EdC-AF647 labeled hDNA (magenta), immunolabeled SMC3 (green), and their merge in mock and HSV-1 infected A549 cells. Scale bar: 2 µm. (Right). Zoomed-in regions are shown in yellow boxes. Scale bar: 200 nm. b (Left) Cropped representative nuclear STORM-PAINT images of EdC-AF647 labeled vDNA (magenta), immunolabeled SMC3 (green), and their merge in mock and HSV-1 infected A549 cells. Scale bar: 2 µm. (Right). Zoomed-in regions are shown in yellow boxes. Scale bar: 200 nm. c Percentage of SMC3 clusters located in the VRC over the whole nucleus in HSV-1 infected A549 cells at 3 hpi (n = 34), and 8 hpi (n = 14). Mean and SD are shown. ****p < 0.0001, calculated by unpaired, two-tailed Student’s t test. d–f Dot plots showing the median number of SMC3 localizations per cluster (d), median area per SMC3 cluster (e) and the NND between SMC3 clusters (f) for mock (n = 20) and HSV-1 infected A549 cells at 1 hpi (n = 19), 2 hpi (n = 13), 3 hpi (n = 50) and 8 hpi (n = 33). Mean and SD are shown. ns, p > 0.05; *p < 0.05; **p < 0.01; ****p < 0.0001, calculated by ordinary one-way ANOVA followed by Dunnett’s multiple comparison test against mock. g hDNA density as a function of the distance from the center of the SMC3 clusters in mock (n = 12), and HSV-1 infected cells at 1 hpi (n = 17), 3 hpi (n = 21), and 8 hpi (n = 14). Density is measured inside rings of increasing search radii. Mean and SD are shown. h, i Nearest Neighbor Distance (NND) distribution plot of the distance between SMC3 and newly replicated vDNA clusters, taking SMC3 (h) or vDNA (i) as the origin, in 2 hpi (n = 13), 3 hpi (n = 16), and 8 hpi (n = 19) HSV-1 infected A549 cells. Experimental data displayed as continuous lines, random simulated data (control), as dotted lines. The dotted line at 100 nm represents the threshold to consider the two clusters interacting. **p < 0.01; ****p < 0.0001, calculated by paired, two-tailed Student’s t test. Source data are provided as a Source Data file. p-values are indicated in Supplementary Data 1.
Fig. 6
Fig. 6. TADs and loops are rearranged at different times post-infection while A/B compartments are maintained.
a Contact frequencies (Log10 average normalized counts) as a function of genome-wide distance for individual Hi-C replicates obtained in mock and HSV-1 infected A549 cells at 1, 3 and 8 hpi. b Left. Plots showing the eigenvector (PC1) obtained for chromosome 2 (100 kb resolution) for mock and HSV-1 infected A549 cells at 1, 3, or 8 hpi (compartments: A (blue), B (yellow)). Right. Scatterplots showing the correlation between PC1 values for each bin obtained for mock versus 1, 3, or 8 hpi. c Distribution of the compartmentalization score (Contacts within compartments/Contacts between compartments) for mock and HSV-1 infected A549 cells at 1, 3, or 8 hpi. d Plot showing the average insulation score at TAD boundaries (±300 kb) obtained for mock and HSV-1 infected cells at 1, 3, or 8 hpi. eg Alluvial plot showing the number of created and maintained TADs (e) and loops (g) in the transitions between mock and HSV-1 infected A549 cells at 1, 3 and 8 hpi, with a tolerance of 50 kb. The yellow portion of the bars represent the TADs or loops present in mock, the blue portion of the bars represent the TADs or loops created at different times post-infection. f, h Plots showing the number of TADs (f) and loops (h) maintained, lost and new at each time point during infection, compared with mock, with a tolerance of 50 kb. Dark yellow represents maintained loops, pale yellow represents lost loops, and blue represents new loops in regards to mock. Source data are provided as a Source Data file.
Fig. 7
Fig. 7. Interactions between human and viral genomes rewire transcription activity and loop formation.
a Distribution of normalized human-virus contacts for all bins (gray), bins within the B compartment (yellow), within the A compartment (dark blue), containing downregulated genes (orange), or upregulated genes (green) at each timepoint post infection. Plot shows diagram of box (25–75 percentiles) and whiskers (±1.5 x IQR) for genomic bins with outliers shown as individual points and line at median. All bins from two biological replicates were pooled. *p < 0.05; ****p < 0.0001, calculated by Kruskal-Wallis test followed by Dunn’s multiple comparison test against whole genome. b Distribution of normalized human-virus contacts for all 100 kb bins within the A (dark blue) or B (yellow) compartment according to their gene density at 8 hpi. *p < 0.05; ****p < 0.0001, calculated by Kruskal-Wallis test followed by Dunn’s multiple comparison test between A and B. Plot shows diagram of box (25–75 percentiles) and whiskers (5–95 percentiles) for genomic bins with outliers shown as individual points and line at median. All bins from two biological replicates were pooled. Statistical significance of the number of genes over the human–virus contacts is p < 0.0001, calculated separately for A and B compartments by Kruskal-Wallis test (not included in the plot). cd Human genomic regions (100 kb bins) were ranked in quintiles according to the quantity of human-virus contacts at each timepoint. c Percentage of bins from A or B compartments found in each quintile. d Percentage of total (blue), downregulated (orange), and upregulated (green) genes found in each quintile. ****p < 0.0001 for chi-squared analysis of the distribution. e Overlap between human genomic regions highly contacting with HSV-1 genome and highly upregulated human genes at 8 hpi. A two-tailed hypergeometric test was used to evaluate the significance of the overlap between the two sets. f Gene ontology analysis of the highly upregulated human genes at 8 hpi that belong to human genomic regions highly contacting with HSV-1 genome. g Comparative profiling of a genomic region with newly established loops at 8 hpi and the relation between (from top to bottom) contact matrices for mock and 8 hpi, A/B compartments, human-virus interaction score, differences in RNA transcription, insulation, ATAC-seq patterns (green bars represent open chromatin regions that are consistent across all biological replicates for mock and 8 hpi HSV-1 infected cells), CTCF binding sites (colors represent the direction of the motif), and the position of genes (RefSeq). Marked genes belong to the overlapping group in (e). Blue arrowheads indicate new loops. ATAC-seq data was analyzed from deposited GEO GSE185240, green regions represent areas of high accessibility. Source data are provided as a Source Data file. p-values are indicated in Supplementary Data 1.
Fig. 8
Fig. 8. TOP1 is essential for viral infection and propagation.
a-d, l and m Representative conventional images of white top hat-filtered hDNA (magenta), conventional ICP4 (cyan) and cropped STORM images of TOP1 (green), in mock and HSV-1 infected cells untreated (a) or treated with β-lap before (c) or during infection (l). Representative conventional images of hDNA (magenta), ICP4 (cyan) and cropped STORM images of RNAP II phSer5 (green), in mock and HSV-1 infected cells untreated (b) or treated with β-lap before (d) or during infection (m). Yellow dotted lines delimit the location of VRCs. Scale bar: 2 µm. e, f Percentage of TOP1 (e) and RNAP II phSer5 (f) clusters co-localizing with hDNA regions over the whole nucleus in mock or HSV-1 infected A549 cells treated or untreated with β-lap. For TOP1: mock (n = 11), mock β-lap treated (n = 9), 3 hpi (n = 7), 3 hpi–β-lap_pre (n = 12), 8 hpi (n = 10), 8 hpi–β-lap_pre (n = 16), 8 hpi–β-lap_post (n = 14). For RNAP II: mock (n = 7), mock β-lap treated (n = 7), 3 hpi (n = 7), 3 hpi–β-lap_pre (n = 13), 8 hpi (n = 11), 8 hpi–β-lap_pre (n = 16), 8 hpi–β-lap_post (n = 16). Mean and SD represented; Statistical significance compared to mock untreated is p < 0.0001 for all conditions (not included in the plots). Statistical significance compared to mock β-lap treated is shown in the graph (green): ns, p > 0.05; *p < 0.05; **p < 0.01; ***p < 0.001; ****p < 0.0001, calculated by ordinary one-way ANOVA test followed by Dunnett’s multiple comparison test. g Percentage of hDNA-free areas per nucleus quantified from SR images of mock and HSV-1 infected cells, untreated or treated with β-lap. Mock (n = 4), mock β-lap treated (n = 18), 3 hpi (n = 11), 3 hpi–β-lap_pre (n = 15), 8 hpi (n = 8), 8 hpi–β-lap_pre (n = 17), 8 hpi–β-lap_post (n = 7). Mean and SD are shown; statistical significance compared to mock untreated is p < 0.0001 for all conditions (not included in the plots). Statistical significance compared to mock β-lap treated is shown in the graph (green): ns, p > 0.05; **p < 0.01; ****p < 0.0001, calculated by ordinary one-way ANOVA test followed by Dunnett’s multiple comparison test. h–k Representative STORM density rendering images of hDNA in mock (h) or HSV-1 infected (ik) A549 cells treated or not with β-lap. Top: whole nucleus. Scale bar: 2 µm. Bottom: Zoomed images of the regions inside the yellow boxes. Scale bar: 200 nm. DNA density follows the color scale bar; top: 0.00001 nm−2 (dark blue) to 0.01640 nm−2 (white); bottom: 0.00001 nm−2 (dark blue) to 0.01978 nm−2 (white)). Source data are provided as a Source Data file. p-values are indicated in Supplementary Data 1.
Fig. 9
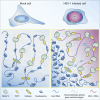
Fig. 9. Schematic diagram summarizing the HSV-1 rewiring of host chromatin.
During HSV-1 infection, RNAP II (light green), TOP1 (yellow) and cohesin (green rings) are hijacked to the VRCs. As a result, a host-to-virus transcriptional switch occurs, and the host chromatin becomes highly compacted and transcriptionally repressed. At the same time, HSV-1 is found to contact specific gene-rich regions of the host genome, forming new loops. These regions are transcriptionally active, and include genes involved in infection progression.

References

    1. Ou, H. D. et al. ChromEMT: visualizing 3D chromatin structure and compaction in interphase and mitotic cells. Science357. 10.1126/science.aag0025 (2017). - PMC - PubMed
    1. Eltsov, M., Maclellan, K. M., Maeshima, K., Frangakis, A. S. & Dubochet, J. Analysis of cryo-electron microscopy images does not support the existence of 30-nm chromatin fibers in mitotic chromosomes in situ. Proc. Natl. Acad. Sci. USA105, 19732–19737 (2008). - PMC - PubMed
    1. Ricci, M. A., Manzo, C., Garcia-Parajo, M. F., Lakadamyali, M. & Cosma, M. P. Chromatin fibers are formed by heterogeneous groups of nucleosomes in vivo. Cell160, 1145–1158 (2015). - PubMed
    1. Nishino, Y. et al. Human mitotic chromosomes consist predominantly of irregularly folded nucleosome fibres without a 30-nm chromatin structure. EMBO J.31, 1644–1653 (2012). - PMC - PubMed
    1. Otterstrom, J. et al. Super-resolution microscopy reveals how histone tail acetylation affects DNA compaction within nucleosomes in vivo. Nucleic Acids Res.47, 8470–8484 (2019). - PMC - PubMed

MeSH terms