. 2025 Jul;17(7):1868-1891.
doi: 10.1038/s44321-025-00258-8. Epub 2025 Jun 20.

Replicated blood-based biomarkers for myalgic encephalomyelitis not explicable by inactivity

Affiliations

Replicated blood-based biomarkers for myalgic encephalomyelitis not explicable by inactivity

Sjoerd Viktor Beentjes et al. EMBO Mol Med. 2025 Jul.

Abstract

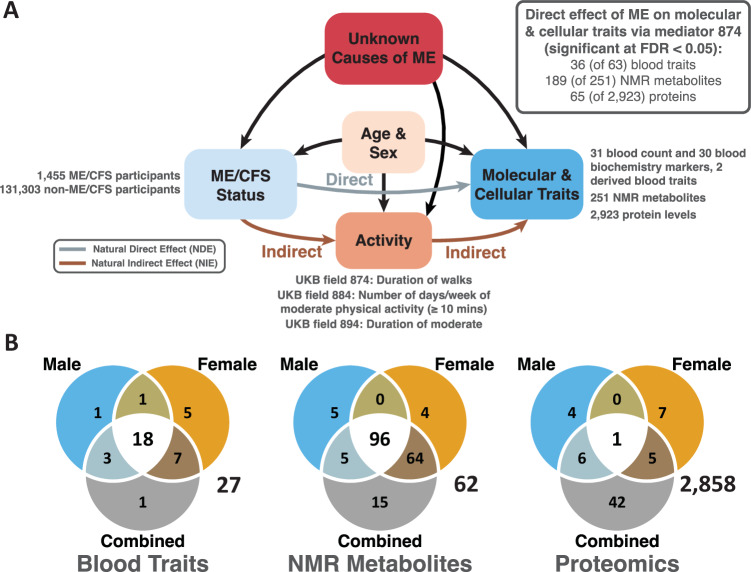
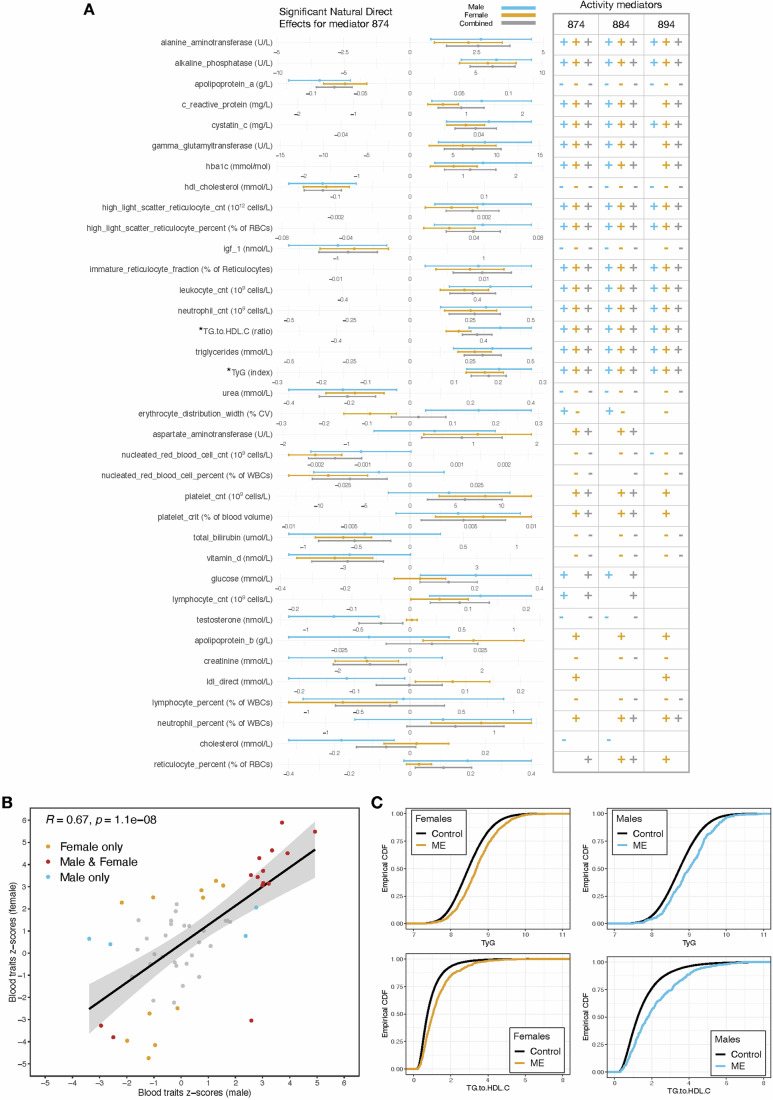
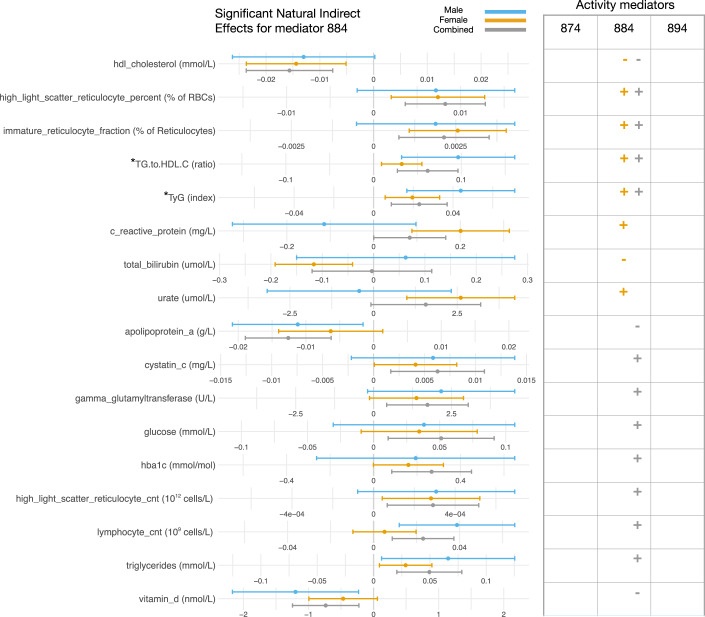
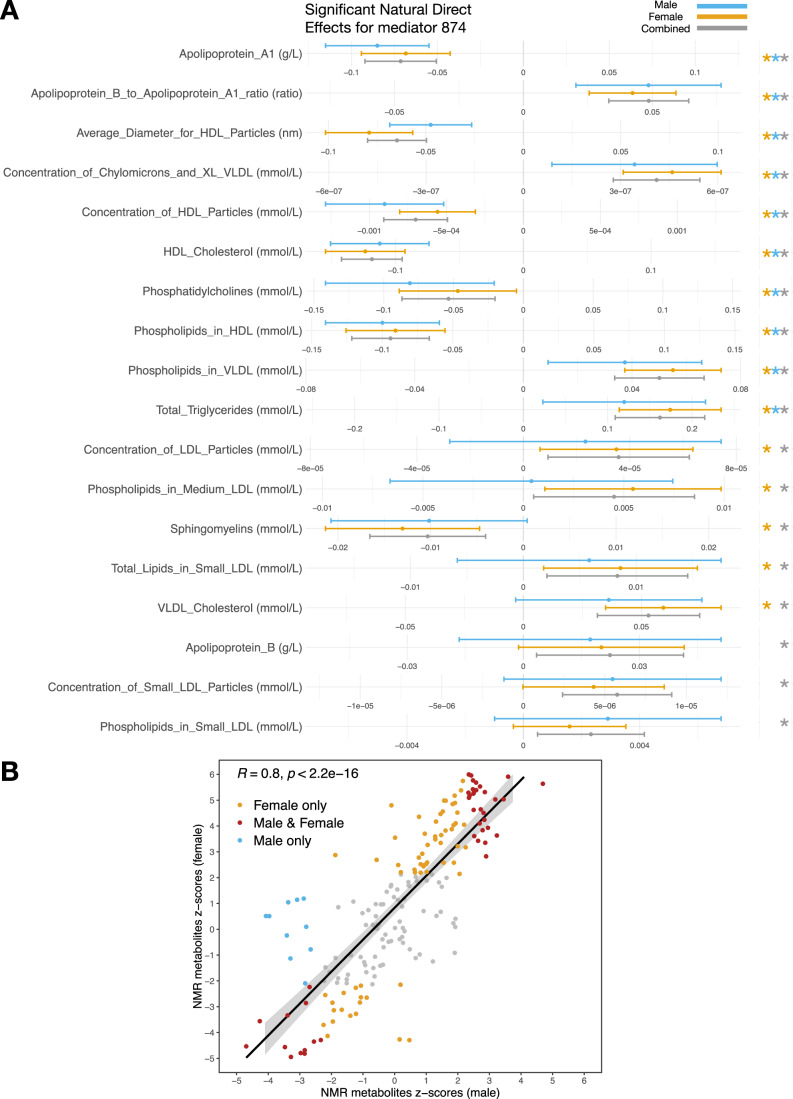
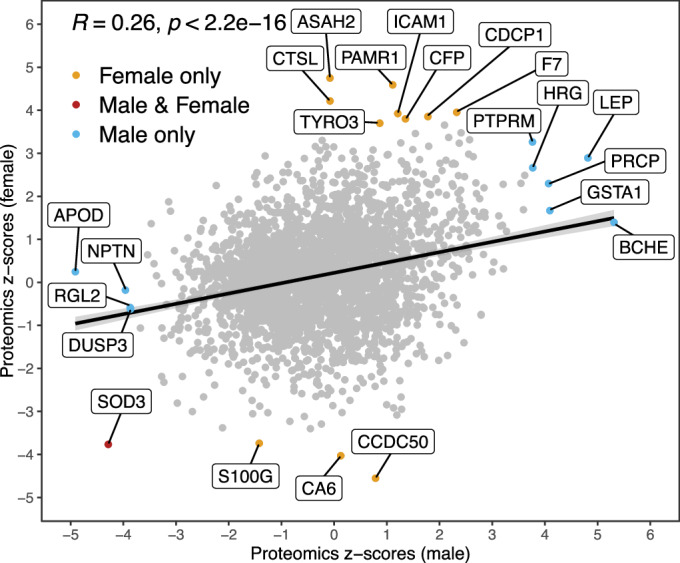
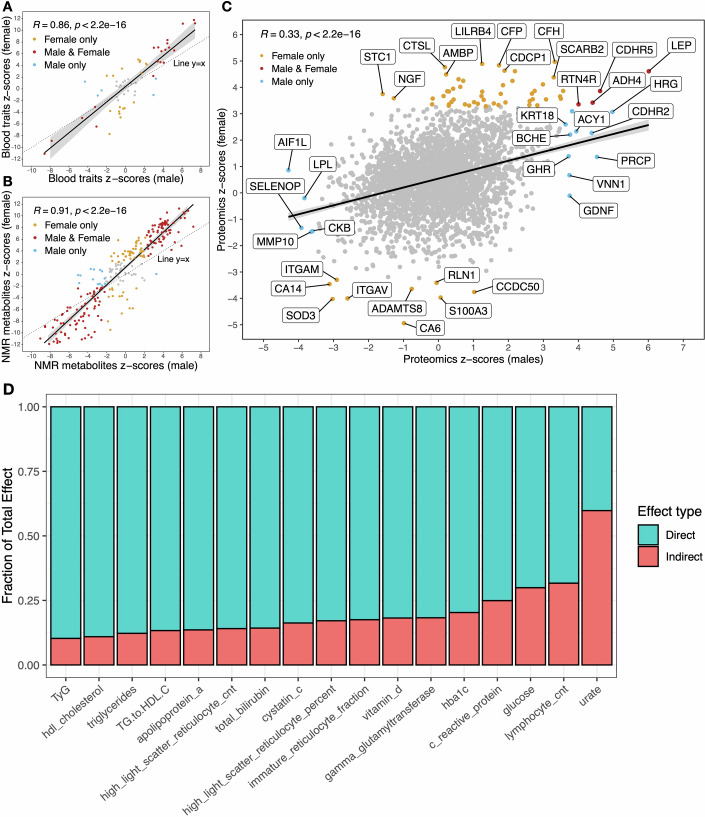
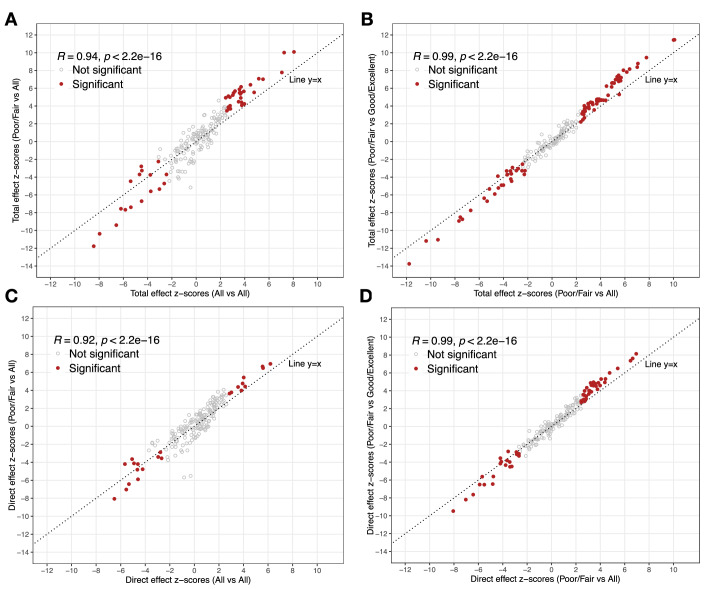
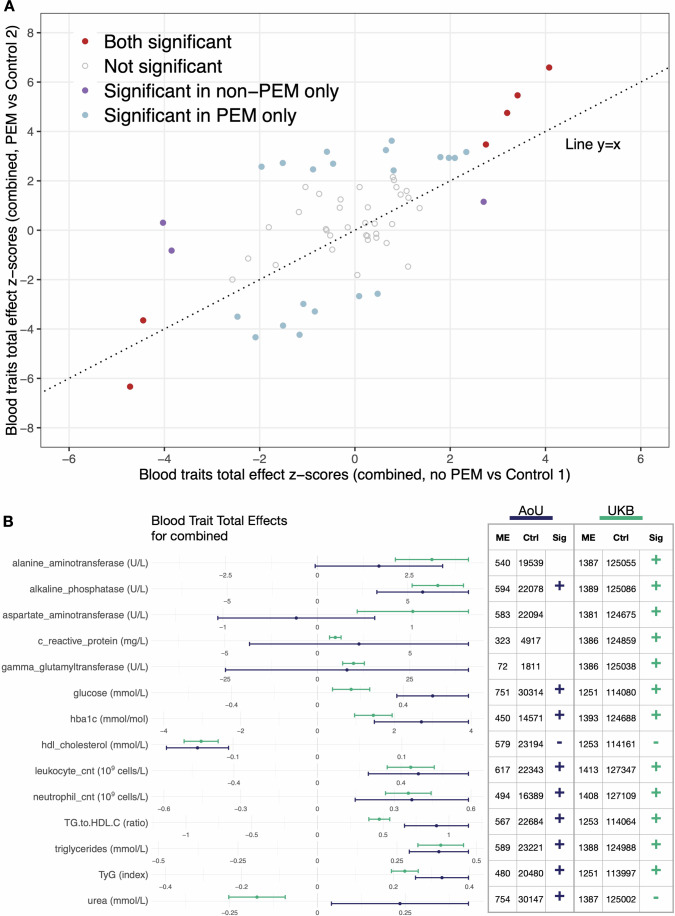
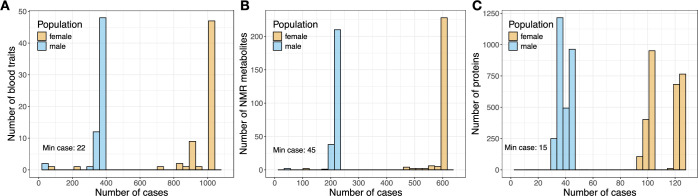
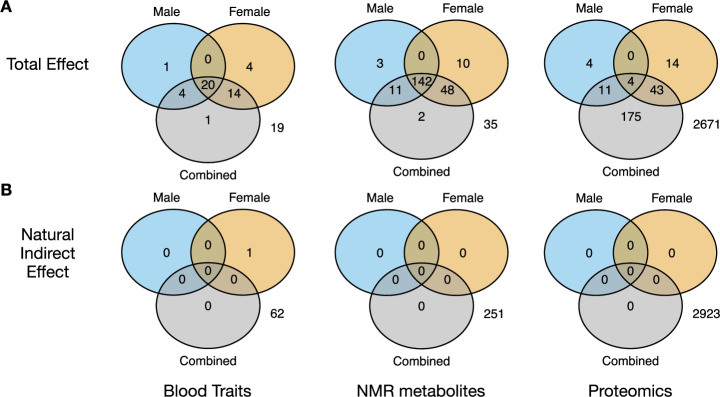
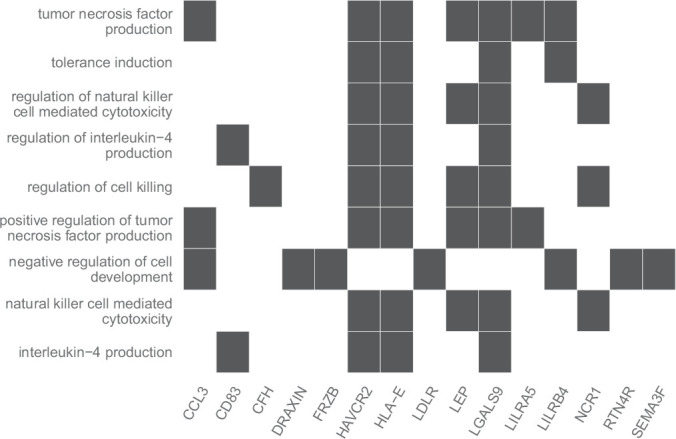
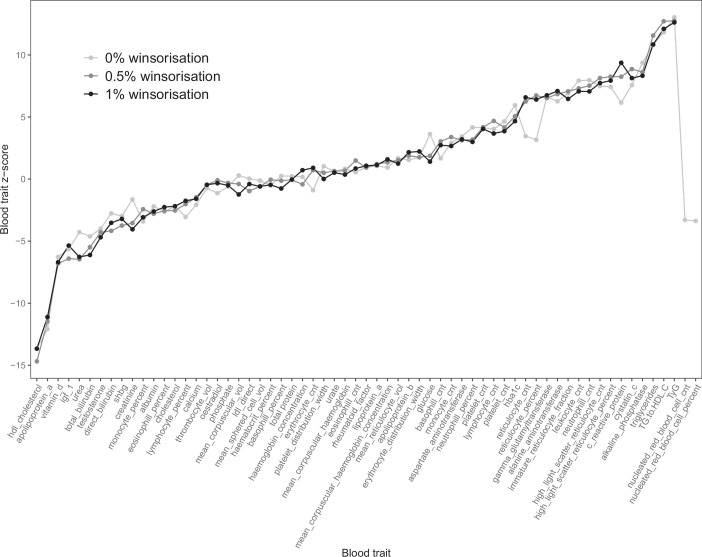
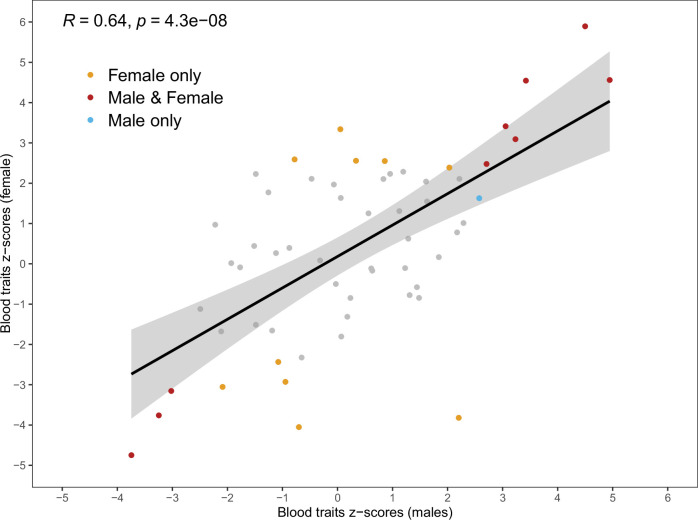
Myalgic encephalomyelitis/chronic fatigue syndrome (ME/CFS) is a common female-biased disease. ME/CFS diagnosis is hindered by the absence of biomarkers that are unaffected by patients' low physical activity level. Our analysis used semi-parametric efficient estimators, an initial Super Learner fit followed by a one-step correction, three mediators, and natural direct and indirect estimands, to decompose the average effect of ME/CFS status on molecular and cellular traits. For this, we used UK Biobank data for up to 1455 ME/CFS cases and 131,303 controls. Hundreds of traits differed significantly between cases and controls, including 116 significant for both female and male cohorts. These were indicative of chronic inflammation, insulin resistance and liver disease. Nine of 14 traits were replicated in the smaller All-of-Us cohort. Results cannot be explained by restricted activity: via an activity mediator, ME/CFS status significantly affected only 1 of 3237 traits. Individuals with post-exertional malaise show stronger biomarker differences. Single traits could not cleanly distinguish cases from controls. Nevertheless, these results keep alive the future ambition of a blood-based biomarker panel for accurate ME/CFS diagnosis.

Keywords: All of Us Biobank; Myalgic Encephalomyelitis; Post-exertional Malaise; Semi-parametric Mediation Analysis; UK Biobank.


Conflict of interest statement

Disclosure and competing interests statement. The authors declare no competing interests.

Figures

Figure 1
Figure 1. Study design and overview of results.
(A) Directed Acyclic Graph for ME/CFS, taking age and sex as confounders and sedentary lifestyle (physical activity) as a mediator for ME/CFS’s effect on molecular and cellular traits. The causes of ME/CFS are an unknown variable (red). Therefore, all effect estimators are quantifying an association between ME/CFS and molecular or cellular traits and no causal statements are made. The “Age” variable (UKB field 21022) represents age at recruitment to UKB, rather than age of onset or diagnosis of ME/CFS. This variable affects the probability of having a ME/CFS diagnosis: recovery is minimal (≈5%, (Cairns and Hotopf, 2005)), and as they age people are increasingly likely to be diagnosed with ME/CFS. As it also affects the molecular and cellular traits, age is treated as a confounder. (B) Venn diagrams displaying the number of significant findings in the male, female, and combined cohorts, and their intersection for Natural Direct Effect (NDE, grey), mediator 874. Proteomics data have the smallest sample size (see Table 1) and least power, implying fewer significant results in males and females separately as compared to the combined analysis.
Figure 2
Figure 2. Associational natural direct effects (NDE) of ME/CFS on molecular and cellular blood traits.
(A) The sex-stratified analyses are presented in orange (female) and blue (male). For the combined analysis (grey), sex is additionally taken as a confounder. All traits that are significant for the UKB 874 mediator are shown (see Dataset EV3 for the UKB 884 and 894 mediators). Natural direct effect sizes (left) are plotted for the UKB 874 mediator (“Duration of walks”), for significant estimates (FDR <0.05). Error bars indicate 95% confidence intervals, and the central point represents the population average estimate. Note that the scale and unit of measurement for each trait (x axis) are different. For example, the unit of measurement of alanine aminotransferase (Field 30620) is U/L. The analysis was repeated for the UKB 884 mediator (“Number of days/week of moderate physical activity”) and for the UKB 894 mediator (“Duration of moderate activity”), with the significant results (FDR <0.05) in each category indicated by “+”‘ symbols for positive effects and “−” for negative effects (right). Where there is no symbol, the effect was not significant. Notably, there were no discordant results across the three mediators. All blood trait names are as they appear in the UKB showcase, aside from TyG and TG-to-HDL-C ratio (indicated by *), which are composite measures of other blood traits. Full results can be found in Datasets EV2 and EV3. Sample sizes of each analysis are in Dataset EV4. (B) Blood trait NDE z-scores, males (x axis), females (y axis). Z-scores are the NDE divided by its estimation error. The Pearson correlation is 0.67 and significant. The red dots represent 14 blood traits that are significant in both males and females (FDR <0.05). The yellow and blue dots represent blood traits that are significant in females only and males only, respectively (FDR <0.05). The grey dots are significant in neither group while controlling FDR <0.05. (C) Raw data empirical cumulative distribution functions (ECDFs) for TyG (top) and TG-to-HDL-C ratio (bottom), comparing controls (black) and cases (female on the left, male on the right).
Figure 3
Figure 3. Associational natural indirect effects (NIE) of ME/CFS on molecular and cellular blood traits.
The sex-stratified analyses are presented in orange (female) and blue (male). For the combined analysis (grey), sex is additionally taken as a confounder. All traits that are significant for UKB mediator 884 are shown. This is the mediator with the largest number of significant indirect effects. UKB mediator 874 “Duration of walks” has a single significant NIE (mean_corpuscular_haemoglobin} for females) (FDR <0.05), whereas UKB mediator 894 “Duration of moderate activity”‘ has no significant NIEs (FDR <0.05). Effect sizes are plotted for UKB mediator 884 “Number of days/week of moderate physical activity”, for significant estimates (FDR <0.05). Error bars indicate 95% confidence intervals and the central point represents the population average estimate. Note that the scale and unit of measurement for each trait (x axis) are different. Significant results (FDR <0.05) for mediator 884 are indicated by “+” for positive effects and “−” for negative effects. Where there is no symbol, the effect was not significant. Blood trait names are as they appear in the UKB showcase, aside from TyG and TG-to-HDL-C ratio (indicated with *), which are composite measures of other blood traits. Full results can be found in Datasets EV2 and EV3. Sample sizes of each analysis are in EV4.
Figure 4
Figure 4. Associational natural direct effects (NDE) of ME/CFS on NMR metabolites.
(A) The sex-stratified analyses are presented in orange (female) and blue (male). For the combined analysis (grey), sex is additionally taken as a confounder. Eighteen of 184 traits are shown; results for all traits are provided in Dataset EV5. Effect sizes are plotted for mediator 874 “Duration of walks” for significant estimates (FDR <0.05). Error bars indicate 95% confidence intervals and the central point represents the population average estimate. Note that the scale and unit of measurement (x axis) are different for each metabolite. Asterisks (right) indicate effects that are significant (FDR <0.05). Where there is no asterisk, the effect was not significant. There were no discordant results across the three analyses. All NMR metabolite names are as they appear in the UKB showcase. (B) NMR NDE values are strongly concordant between the two sexes. Shown are per-metabolite z-scores for males (x axis) and females (y axis). Z-scores are the NDE divided by its estimation error. The Pearson correlation is 0.8 and significant (P = 4.0 × 10−44). Red dots indicate metabolites that are significant in both males and females (FDR <0.05). Yellow and blue dots represent metabolites that are significant in females only and males only, respectively (FDR <0.05). Grey dots are significant in neither. Full results can be found in Dataset EV5. Sample sizes of each analysis are in Dataset EV4.
Figure 5
Figure 5. Protein NDE z-scores, males (x axis) and females (y axis).
Z-scores are the NDE divided by its estimation error. The Pearson correlation is 0.26 and significant (P = 5.1 × 10−45). The red dot represents the single protein (SOD3) that is significant in both males and females (FDR <0.05). Yellow and blue dots indicate proteins that are significant in females only and in males only, respectively (FDR <0.05). Grey dots show proteins that are significant in neither (i.e., FDR ≥0.05). Full results can be found in Dataset EV6. Sample sizes of each analysis are in Dataset EV4.
Figure 6
Figure 6. Concordance of results in male vs female subpopulations in blood traits, NMR metabolites, and proteins, and relative contribution of indirect effects.
(A) Blood trait total effect z-scores, males (x axis), females (y axis). Z-scores are the TE divided by its estimation error. The Pearson correlation is 0.86 and significant (P = 4.2 × 10−19). The red dots represent 20 blood traits that are significant in both males and females (FDR <0.05). The yellow and blue dots represent blood traits that are significant in females only and males only, respectively (FDR <0.05). The grey dots are significant in neither for FDR <0.05. The x = y line indicates the line of equal z-scores for males and females. In general, in absolute value, the z-scores are higher for females than males. This is to be expected as the sample size is larger for females. (B) Metabolite total effect values are strongly concordant between the two sexes. Shown are per-metabolite z-scores for males (x axis) and females (y axis). Z-scores are the TE divided by its estimation error. The Pearson correlation is 0.91 and significant (P = 1.5 × 10−97). Red dots indicate metabolites that are significant in both males and females (FDR <0.05). Yellow and blue dots represent metabolites that are significant in females only and males only, respectively (FDR < 0.05). Grey dots are significant in neither. (C) Proteins' total effect z-scores, males (x axis), females (y axis). Z-scores are the TE divided by its estimation error. The Pearson correlation is 0.33 and significant (P = 1.3 × 10−78). Red dots represent the proteins (LEP, CDHR5, ADH4, RTN4R) that are significant in both males and females (FDR <0.05). Yellow and blue dots represent proteins that are significant in females only and males only, respectively (FDR <0.05). The grey dots are significant in neither for FDR <0.05. (D) Associational Natural Direct Effect (NDE, blue) and Natural Indirect Effect (NIE, red) as a fraction of the total effect for the effect of ME/CFS on molecular and cellular blood traits. The results are presented for male and female combined, for mediator 884 “Number of days/week of moderate physical activity”, the only mediator that exhibits indirect effects. Across all 61 blood traits, and the two composite metrics TyG and TG-to-HLD-C ratio, only 1 feature, Urate, has a larger NIE than NDE, for this mediator only. Full results and sample sizes can be found in Datasets EV3–6.
Figure 7
Figure 7. Total effects and Natural Direct Effects (NDEs) for blood traits become more significant as the stringency of case and control definitions increases.
(A) Total effect z-scores for ‘Poor/Fair’ for cases and ‘All’ (without restricting by health rating (UKB field 2178)) for controls versus z-scores for ‘All’ for cases and ‘All’ for controls (without restricting by health rating for cases or controls). The Pearson correlation is 0.94 and significant (P = 2.7 × 10−89). The null hypothesis—that significance does not change for increasing stringency of case or control definition—is represented by the diagonal line. (B) Total effect z-scores for ‘Poor/Fair’ for cases and ‘Good/Excellent’ for controls, versus ‘Poor/Fair’ for cases vs ‘All’ for controls. The Pearson correlation is 0.99 and significant (p = 7.5 × 10−165). (C, D) As in (A, B) but for NDE. The Pearson correlations are 0.92 and 0.99, respectively, and significant (P = 6.0 × 10−74 and P = 7.0 × 10−146). Full results and sample sizes can be found in Dataset EV10.
Figure 8
Figure 8. Comparison of total effects for blood traits among PEM vs non-PEM groups, as well as UKB vs All of Us cohorts.
(A) Comparison of total effects for blood traits among PEM versus non-PEM ME/CFS samples (both sexes) relative to two independent sets of controls. Identical case and control sample numbers were used in both analyses. Note that there are no significantly opposing results between the two populations. Six blood traits were significant in both analyses (alanine aminotransferase, apolipoprotein a, HDL cholesterol, TG-to-HDL-C ratio, triglycerides and TyG) and are thus replicated. A further 20 traits were significant only in the PEM analysis, and 3 were significant only in the non-PEM analysis. Full results and sample sizes can be found in Dataset EV11. (B) Associational total effects (TE) of ME/CFS on molecular and cellular blood traits in All of Us and UKB, for males and females combined. Age and sex are taken as confounders. Error bars indicate 95% confidence intervals and the central point represents the population average estimate. Note the different scale and unit of measurement used for each trait (x axis). Significant results (FDR <0.05) are indicated by “+” for positive effects and “−” for negative effects. Where there is no symbol shown, the effect was not significant. With the exception of urea, all significant blood traits show concordant directions of effect between AoU and UKB. Full results and sample sizes of each analysis can be found in Dataset EV12.
Figure EV1
Figure EV1. ME/CFS sample sizes for males and females, restricting to complete cases (individuals for whom a measurement is available).
The minimum number of cases is indicated on each plot. (A) Blood traits, (B) NMR metabolites, (C) Proteomics. Neither of the two proteins with case sample size below 30 is significant after FDR correction. Full sample size data is provided as Dataset EV6.
Figure EV2
Figure EV2. Overview of significant associational total effects and natural indirect effects (NIE) in the male, female, and combined populations.
Venn diagrams displaying the number of significant findings in the males, females, combined and their intersection, mediator 874, for (A) total effect, and (B) NIE.
Figure EV3
Figure EV3. GO pathway enrichment (Ashburner et al, 2000) for proteins with a significant positive total effect for ME/CFS vs control, restricted to females only.
This is the subset with maximal power for GO analysis. All effects are TE, i.e., there are no significant NIE for proteins. We performed a similar pathway GO enrichment analysis for proteins with a significant positive total effect for ME/CFS vs control on the population of males and the combined dataset, as well as all significant negative total effects and all significant total effects on the female, male and combined populations. These resulted in no significant GO term enrichments at FDR <0.05. All measured UKB proteins were used as background for the GO analyses.
Figure EV4
Figure EV4. Significant blood traits are robust to winsorisation.
The points represent total effect z-scores for blood traits in the combined female and male analysis. The three shades of grey represent different degrees of winsorisation of the original data, with cases and controls combined prior to winsorisation. Nucleated red blood cell count and percent are only estimable at 0% winsorisation because for 0.5% winsorisation the number of cases is ≤5. Fib4 and eGFR composite measures were not estimated for 0% winsorisation due to extreme values in control samples (e.g., individuals with platelet counts close to 0). Full results and sample sizes can be found in Dataset EV9.
Figure EV5
Figure EV5. NDE of ME/CFS on blood traits for females and males, for mediator 874, with BMI included as a confounding variable.
The Pearson correlation is 0.64 and significant (P = 4.3 × 10−8). Data points relating to nucleated red blood cells are not shown due to >90% data missingness. Full results and sample sizes can be found in Dataset EV13.

Similar articles

References

    1. Aleksander SA, Balhoff J, Carbon S, Cherry JM, Drabkin HJ, Ebert D, Feuermann M, Gaudet P, Harris NL (2023) The Gene Ontology knowledgebase in 2023. Genetics 224:iyad031 - PMC - PubMed
    1. Ashburner M, Ball CA, Blake JA, Botstein D, Butler H, Cherry JM, Davis AP, Dolinski K, Dwight SS, Eppig JT et al (2000) Gene Ontology: tool for the unification of biology. Nat Genet 25:25–29 - PMC - PubMed
    1. Benjamini Y, Hochberg Y (1995) Controlling the false discovery rate: a practical and powerful approach to multiple testing. J R Stat Soc Ser B (Methodol) 57:289–300
    1. Benkeser D, Montefiori DC, McDermott AB, Fong Y, Janes HE, Deng W, Zhou H, Houchens CR, Martins K, Jayashankar L et al (2023) Comparing antibody assays as correlates of protection against COVID-19 in the COVE mRNA-1273 vaccine efficacy trial. Sci Transl Med 15:eade9078 - PMC - PubMed
    1. Bickel PJ, Klaassen CAJ, Ritov Y, Wellner JA (1998) Efficient and adaptive estimation for semiparametric models. Springer New York

LinkOut - more resources