. 2025 Jun 19;23(1):166.
doi: 10.1186/s12915-025-02254-3.

The phosphatase PPM1F, a negative regulator of integrin activity, is essential for embryonic development and controls tumor cell invasion

Affiliations

The phosphatase PPM1F, a negative regulator of integrin activity, is essential for embryonic development and controls tumor cell invasion

Tanja M Grimm et al. BMC Biol. .

Abstract

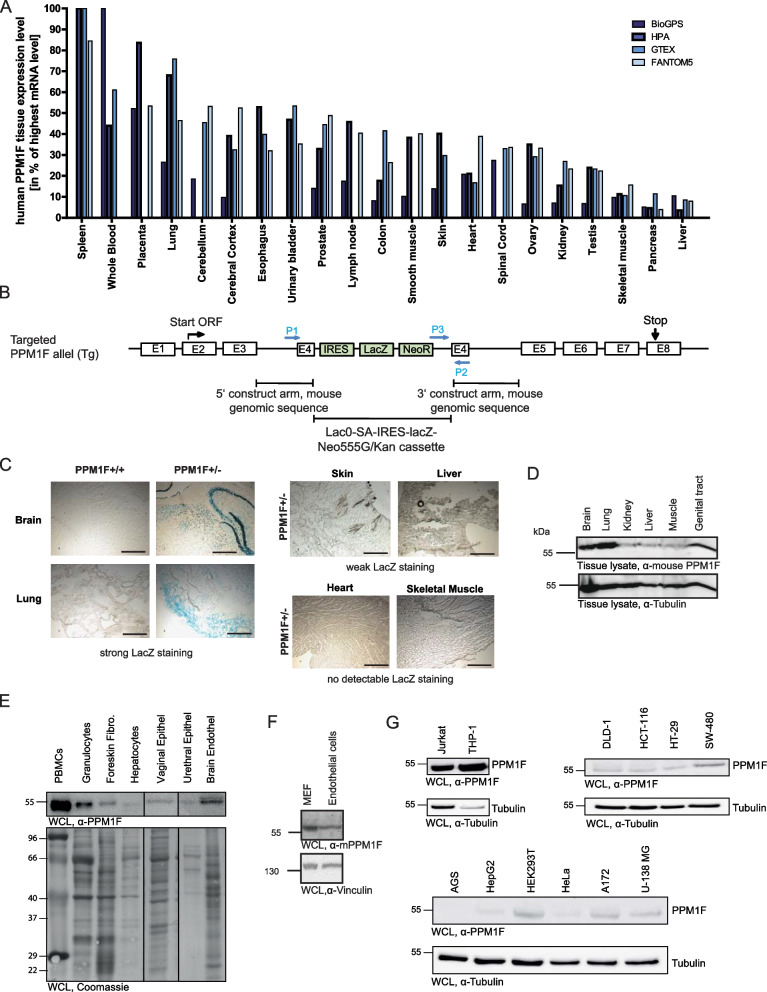
Background: The Mn2+/Mg2+-dependent Ser/Thr phosphatase PPM1F was identified to control integrin activity. Furthermore, PPM1F regulates several protein kinases known to be involved in organizing the cytoskeleton and other cellular functions. Therefore, PPM1F appears critical for a multitude of physiological processes.

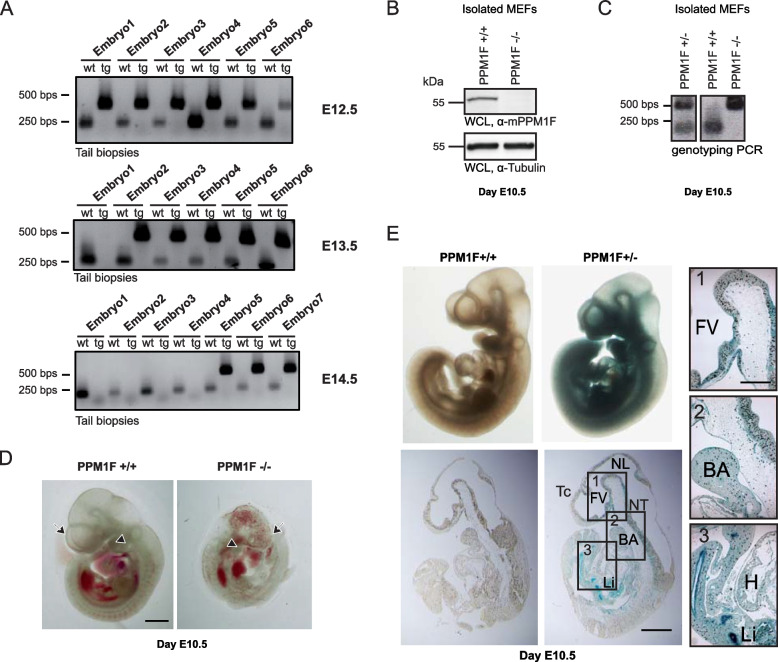
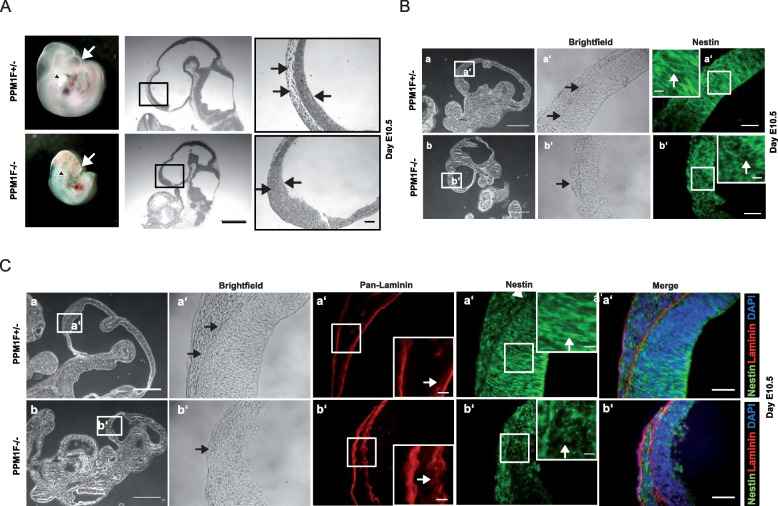
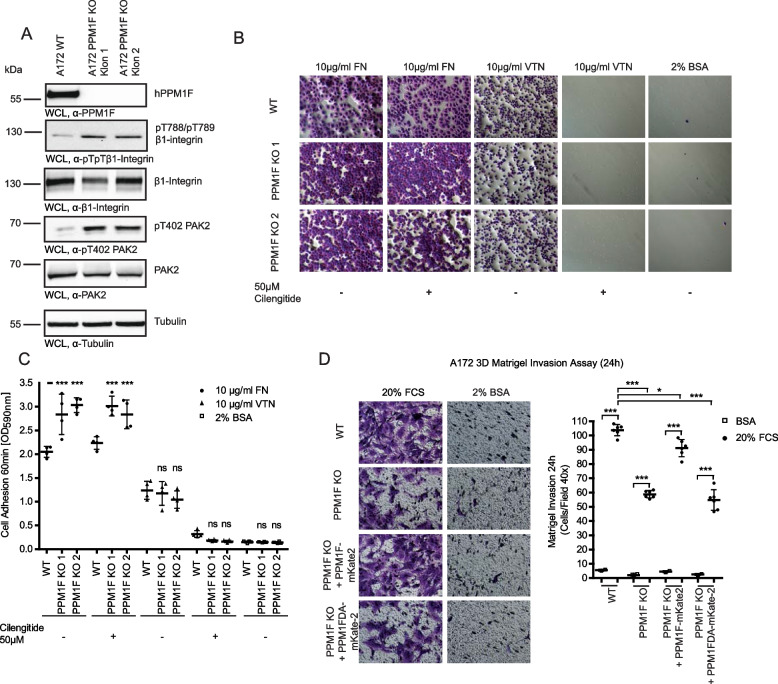
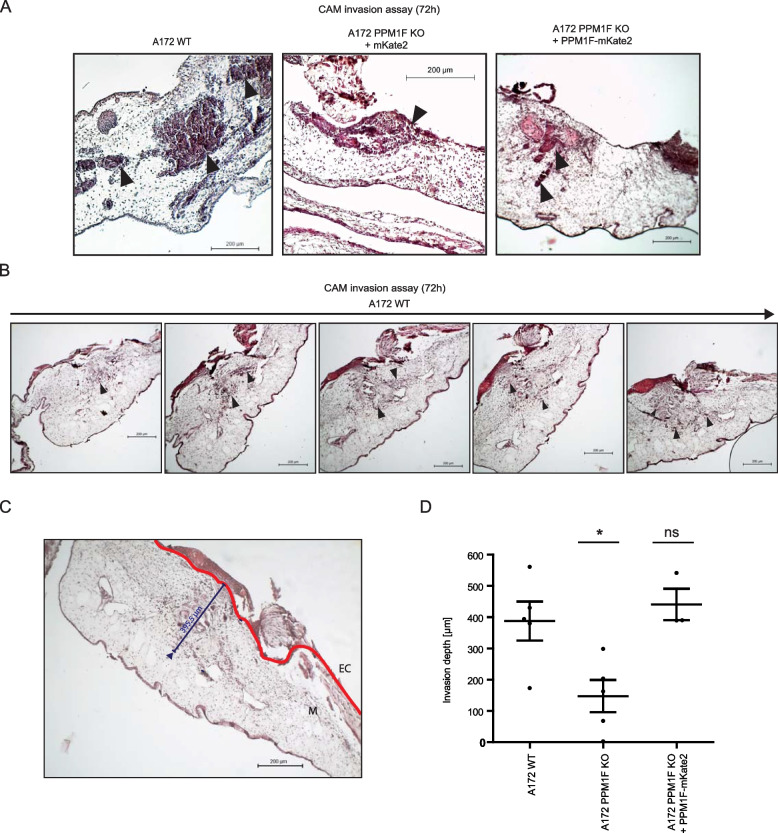
Results: Here, we report the phenotype of ppm1f gene disruption in mice. While heterozygous ppm1f ± mice are viable and fertile, ppm1f-/- mice show severe defects and significant morphological abnormalities in the developing brain and vasculature and abort embryonic development at day E10.5. Isolated ppm1f-/- MEFs or PPM1F-depleted human neuro-epithelial cells display enhanced integrin-dependent cell adhesion, deregulated PAK phosphorylation, and perturbed cell migration. These phenotypes were reversed by re-expression of the wildtype enzyme, but not the phosphatase-inactive PPM1F. In different human tumor cell types, PPM1F expression levels directly correlated with invasive potential, while deletion of PPM1F abrogates tissue invasion.

Conclusions: These results highlight the non-redundant role of this enzyme in integrin and PAK regulation and identify PPM1F as a promising target to limit tumor metastasis.

Keywords: Cancer cell invasion; Cell adhesion; Developmental defects; FilaminA; Integrin activity; Knock-out mouse; PPM1F; Protein phosphatase; Talin; Threonine phosphorylation.


Conflict of interest statement

Declarations. Ethics approval and consent to participate: Mice were kept in accordance with relevant institutional and national guidelines and regulations in the central animal care facility of University of Konstanz. Procurement of mouse tissues was in accordance with the animal welfare guidelines 2010/63/EC of the European Communities Council Directive and was registered with official authorities (Regierungspräsidium Freiburg, Germany). Consent for publication: Not applicable. Competing interests: The authors declare having no competing interests.

Figures

Fig. 1
Fig. 1
PPM1F is expressed in multiple tissues in the adult with high levels in the brain and hematopoietic system. A Schematic comparison of human PPM1F tissue-specific expression levels based on four different transcriptomic studies indicated by differently colored bar graphs (BioGPS, HPA, GTEX, FANTOM5). Mean protein-coding transcripts per million (pTPM)-values for a panel of human tissues analyzed in at least three of the studies were selected and used to calculate the PPM1F expression levels in percentage to the highest PPM1F mRNA level measured within the respective study. Resulting data were plotted from the highest (left) to the lowest (right) values considering all studies. B Schematic representation of the targeted ppm1f locus. Homologous recombination of a LacZ/neomycin-resistance encoding gene-trap cassette into exon 4 resulted in gene disruption and expression of β-galactosidase under the control of the ppm1f gene promoter. Primers used for genotyping are indicated. E: exon number; P1: gene specific primer forward; P2: Gene specific primer reverse; P3: targeted primer forward. C Cryosections from the indicated tissues were prepared from adult (> 8-week-old) female wildtype (PPM1F +/+) and PPM1F ± mice. 10 µm thick sections were prepared and stained for β-galactosidase activity; scale bars: 500 µm. D 100 mg of indicated tissues from wildtype mice were homogenized in 200 µl lysis buffer, cleared by centrifugation and the supernatant was analyzed by Western blotting with a polyclonal rabbit antiserum directed against murine PPM1F (upper panel) or with a monoclonal anti-tubulin antibody (lower panel). E Whole cell lysates of the indicated human primary cells were analyzed by Western blotting with rabbit anti-human PPM1F antibody (upper panel). As a loading control, the membrane was stained with Coomassie (lower panel). F Whole cell lysates of murine primary skin endothelial cells and mouse embryo fibroblasts were analyzed by Western blotting with a polyclonal rabbit antiserum directed against murine PPM1F (upper panel) or with monoclonal anti-tubulin antibody (lower panel). G Whole cell lysates of the indicated human cell lines were analyzed by Western blotting with rabbit anti-human PPM1F antibody (upper panel) or with monoclonal anti-tubulin antibody (lower panel)
Fig. 2
Fig. 2
PPM1F knock-out embryos show severe defects, resulting in early abortion of development. A PPM1F ± mice were mated and embryos were isolated and genotyped at 12.5, 13.5 and 14.5 days post coitus. B WCLs of MEFs isolated at day E10.5 from regularly developed (putative PPM1F +/+ and PPM1F ±) or malformed (putative PPM1F-/-) embryos were probed with polyclonal α-mPPM1F antiserum (upper panel) or monoclonal α-tubulin (lower panel). C Genomic DNA was extracted from E10.5 fibroblasts as in (B). Genotyping PCR identified WT, heterozygous and homozygous ppm1f KO embryos. D Isolated ppm1f−/− embryo at E10.5 (right picture) is smaller in size compared to a wildtype embryo and shows a stunted forebrain and hemorhages (left picture); malformation of the telencephalon (arrow) and branchial archs (arrowhead) in the ppm1f−/− embryo is indicated; scale bar: 1 mm. D Whole-mount X-gal staining and sagittal sections of representative ppm1f+/+ (left picture) and ppm1f± embryo (right picture) at E10.5 showing strong β-galactosidase expression in the rostral region of the telencephalon, the neural tube, the liver and lung. Tc: telencephalon; FV: forebrain vesicle; NT: neural tube; NL: neural lumen; BA: branchial arch; H: heart; Li: liver; scale bar: 500 μm. Areas marked with numbered boxes are shown enlarged on the right hand side; scale bar enlargement: 150 µm
Fig. 3
Fig. 3
Ppm1f-/- embryos display distorted cell and matrix organization in the forebrain. A Whole mount ppm1f± and ppm1f−/− embryos at day E10.5 (left panel). Ppm1f−/− embryos display a stunted telencephalon (white arrow), reduced development of branchial archs (black arrowhead) and bleeding. Sagittal sections of paraffin-embedded embryos were stained with H&E; Middle panel: overview of head region, scale bar 500 µm. Right panel: detailed view of boxed area; normal tissue borders in wildtype embryos and loss of tissue layers in ppm1f−/− embryos are indicated by black arrows. Scale bar 50 µm. B Cryosections of E10.5 ppm1f± and ppm1f−/− embryos stained for nestin as indicated; scale bars: 500 μm (leftmost column), 50 μm (right columns). Insets show higher magnification of boxed areas; scale bar: 10 µm. While neuroepithelial cells strech and align in dorso-ventral direction in wildtype embryos, the neural progenitor cells within the ventricular zone of ppm1f−/− embryos are disoriented (white arrows). C Cryosections as in (B) were co-stained for laminin (red) and nestin (green). Nuclei were stained by DAPI (blue). Scale bars: 500 μm (leftmost column), 50 μm (right columns). Insets show higher magnification of boxed areas; scale bar: 10 µm. While a straight and narrow layer of laminin is seen in the wildtype, this layer is widened and contorted in ppm1f.−/− embryos (white arrows) co-inciding with the disorientation of the nestin-positive neuronal progenitor cells. See also Additional_File1
Fig. 4
Fig. 4
Increased integrin β1 activity, elevated cell adhesion, and migration defects of ppm1f-/- MEFs are reverted by re-expression of wildtype PPM1F. A PPM1F-/- MEFs were transduced with lentiviral particles encoding human wildtype PPM1F (hWT) or human PPM1F D360 A (hDA) in a bi-cistronic expression cassette with GFP. In addition, PPM1F-/- MEFs and PPM1F +/+ cells were transduced with a lentivirus encoding GFP alone. WCLs of sorted cells were analyzed by Western blotting with the indicated antibodies; as controls, WCLs of 293 T cells transfected with the empty vector (mock), GFP (GFP) or murine PPM1F (mWT) were loaded. B MEFs as in (A) were seeded onto 1 µg/ml FNIII9-12 for 2 h. Samples were fixed and stained for talin (upper panel) or the active integrin β1 (lower panel) before analysis by confocal microscopy; scale bar: 20 µm. Insets show higher magnification of boxed areas; scale bar: 5 µm. Arrowheads point to active integrin β1 or talin enrichment. C MEFs as in (A) were kept in suspension for 45 min and incubated for 15 min with 10 µg/ml FNIII9-12 (FN). Samples were stained for total (Hmb1-1) or active β1 integrin (9EG7) and analyzed by flow cytometry, ≥ 10 000 counts. The mean fluorescence intensity (MFI) ratio of active to total β1 integrin was calculated and normalized to the wildtype sample (= 1). Scatter blots represent mean ± SEM of 4 independent experiments; statistics was performed using one-way ANOVA and Bonferroni post-hoc test (p*** < 0.001, ns = not significant). D MEFs were seeded in triplicates onto fibronectin-coated wells for 60 min and cell adhesion was quantified. Representative pictures from cells seeded on 10 µg/ml FN (left panel); scale bar: 150 µm. Scatter blots represent mean ± SEM of 5 independent experiments performed in technical triplicates each. Values were normalized to MEF wildtype cells (= 1). Statistics was performed using one-way ANOVA, followed by Bonferroni post-hoc test (**p < 0.01, *p < 0.05, ns = not significant). E MEFs were seeded onto indicated fibronectin concentrations for 45 min, fixed and stained with DAPI and Phalloidin-Cy5. Samples were imaged using confocal microscopy. Representative images from cells seeded onto 10 µg/ml FN are shown; scale bar: 10 µm (left panel). Quantification of cell spreading. Boxes and whiskers indicate median with 95% confidence intervals from 2 independent experiments; n ≥ 90 cells. Statistics was performed using one-way ANOVA, followed by Bonferroni post-hoc test (***p < 0.001, ns = not significant) (right panel). F Serum starved MEFs were stimulated by addition of 10% FCS and cell migration was monitored every 30 min for 12 h using time-lapse microscopy. Cell tracks were evaluated for velocity, covered distance and directionality. Boxes and whiskers indicate median with 95% confidence intervals from 2 independent experiments (n = 30); Statistics was performed as in (E); ***p < 0.001, * p < 0.05, ns = not significant. See also Additional_File2
Fig. 5
Fig. 5
Knock-down of PPM1F or filaminA in neuro-epithelial cells increases cell adhesion and compromises haptotaxis. A SK-N-MC wildtype cells were transduced with lentiviral particles harboring shRNA against human filaminA, human PPM1F or scrambled shRNA as control and puromycin selection was performed. WCLs were prepared and subjected to Western blotting with indicated antibodies. B SK-N-MC cells from (A) were seeded in triplicates onto fibronectin-coated wells for 60 min and cell adhesion was quantified. Representative pictures from cells seeded on 10 µg/ml FN (left panel); scale bar: 150 µm. Graph on the right depicts values of 4 independent experiments performed in technical triplicates. Values were normalized to SK-N-MC control cells (= 1). Lines and whiskers indicate means ± SEM. Statistics was performed using one-way ANOVA, followed by Bonferroni post-hoc test (**p < 0.01). C Haptotaxis motility assays were performed by seeding serum-starved SK-N-MC cell lines on top of a Boyden chamber membrane coated on the lower side with 10 µg/ml FN or 2% BSA as control. Cells, which had migrated to the lower side of the membrane, were quantified after 6 h by crystal violet staining and counting of five fields/chamber under the light microscope (40 × objective). Representative images of the lower side of the membrane are shown; scale bar: 50 µm. D Quantification of haptotaxis motility assays in (C). Depicted are numbers of migrated cells ± SEM from 10 µg/ml FN treated samples from three independent experiments performed in technical triplicates. Lines and whiskers indicate means ± SEM. Statistics was performed using one-way ANOVA, followed by Bonferroni post-hoc test (***p < 0.001). E CRISPR/Cas-mediated knock-out of PPM1F in SH-SY5Y cells. WCLs from wildtype (WT) and PPM1F KO SH-SY5Y cells were analyzed by Western blotting with α-human PPM1F (upper panel). α-Vinculin antibody was used as loading control (lower panel). F, G Haptotaxis motility assays with SH-SY5Y cells from (E) with Boyden chambers coated with 2, 10, or 40 µg/ml FN performed as in (C). Representative images of the lower side of the membrane are shown. Graph shows the quantification of a representative experiment performed in technical triplicates (F). H, I Wound healing assay with SH-SY5Y cells from (E). Wound closure was monitored over 24 h and representative images are shown. Graph shows the quantification of wound closure from a representative experiment performed in technical triplicates. See also Additional_File 3
Fig. 6
Fig. 6
PPM1F contributes to the invasive phenotype of tumor cells. A WCLs from indicated cancer cell lines were analyzed by Western blotting with α-human PPM1F or α-integrin β1 antibodies. α-Tubulin antibody was used as loading control. B, C Indicated serum-starved cancer cells were seeded on top of a Matrigel basement membrane (30 µg/100 µl) in Boyden chamber cell invasion assays using 20% FCS as stimulus or 2% BSA to evaluate random invasion activity. NIH3 T3 cells served as non-invasive control cells. Representative pictures of the lower porous membrane surface (20x) are shown in (B); scale bar: 50 µm. Crystal violet-stained cells can be distinguished from the 8 µm membrane pores. Cells were evaluated for invasion after 24 h by dye elution with 10% acetic acid and absorbance measurement at 590 nm. Graph in (C) shows quantified means ± SEM from three independent experiments. Statistics was performed using one-way ANOVA and Bonferroni post-hoc test (p*** < 0.001, p** < 0.01, ns = not significant). D MCF-7 cells were stably transduced with lentiviral particles harboring a bicistronic GFP and hPPM1F wildtype or hPPM1F D360 A expression cassette and single-cell sorted via flow cytometry for GFP positive cells to obtain a mixed population of PPM1F-overexpressing MCF-7 cells (PPM1F + + and PPM1F D360 A + +). WCL of the wildtype and modified cell lines were analyzed by Western blotting with indicated antibodies. α-tubulin antibody (lowest panel) served as loading control. E Serum-starved cells from (D) were seeded on top of a Matrigel base (30 µg/100 µl) in Boyden chambers. Cell invasion was stimulated by addition of 20% FCS or 2% BSA to the lower chamber. Representative pictures of the lower porous membrane surface (20x) are shown; scale bar: 50 µm. Crystal violet-stained cells can be distinguished from the 8 µm membrane pores. Invasion was quantified by dye elution. Graph (right) shows means ± SEM from four independent experiments performed in triplicate. Statistics as in (C)
Fig. 7
Fig. 7
Genetic deletion of PPM1F in tumor cells diminishes matrix invasion and integrin phosphorylation. A WCLs from A172 wildtype cells and two clonal PPM1F KO cell lines (1 and 2) were analyzed by Western blotting using the indicated antibodies. α-Tubulin antibody was used as loading control. B Serum starved A172 wildtype cells and PPM1F KO cell lines (clone 1 and clone 2) were seeded in triplicate onto fibronectin-, vitronectin-, or 2% BSA-coated wells for 60 min either in presence of 50 µM cilengitide or DMSO as control. Wells were washed and adherent cells were stained with crystal violet. Representative pictures are shown; scale bar: 150 µm. C Adherent crystal violett stained cells from (B) were quantified by dye elution. Graph depicts individual values as well as mean ± SEM of 4 independent experiments performed in technical triplicates. Statistics was performed using one-way ANOVA, followed by Bonferroni post-hoc test (***p < 0.001; **p < 0.01; p* < 0.05; ns = not significant) and shown for the PPM1F knock-out clones in relation to the A172 wildtype cells. D Serum-starved cells as in (C) were seeded on top of a Matrigel base (30 µg/100 µl) in Boyden chambers and cell invasion was stimulated by addition of 20% FCS or 2% BSA to the lower chamber. Cells were evaluated for invasion after 24 h and representative pictures of the lower porous membrane surface (20x) are shown; scale bar: 50 µm. Crystal violet-stained cells can be distinguished from the 8 µm membrane pores (left). Invasion assays were quantified by dye elution. Graph depicts individual values as well as means ± SEM from four independent experiments performed in triplicate. Statistics as in (C). See also Additional_File4 and Additional_File5
Fig. 8
Fig. 8
Increased integrin-based cell adhesion in PPM1F-deficient cells prohibits cell spreading despite elevated PAK activity. A Serum-starved A172 wildtype, sgRNA control and PPM1F KO cells [26] were seeded onto 2 µg/ml FNIII9-12 for 45 min and WCLs were subjected to Western blotting with indicated antibodies (left panel). Graphs (right panel) show densitometric quantification of band intensities from pThr402PAK2 versus PAK antibody signal for the indicated samples from 5 independent experiments; wildtype was set to 1. Statistics were performed using one-way ANOVA, followed by Bonferroni post-hoc test (*p < 0.05, ns = not significant). B Serum-starved A172 wildtype and PPM1F KO cells were seeded onto 2 µg/ml FNIII9-12 for 1.5 h, fixed and F-actin was stained. Samples were imaged using confocal microscopy. Representative pictures are shown; scale bar: 20 µm. C Cells as in (B) were seeded for 2 h on surfaces coated with 10 µg/ml fibronectin or poly-L-lysine, before fixation, F-actin staining and analysis by confocal microscopy; scale bar: 10 µm. D Spreading assays were performed with serum-starved A172 wildtype and PPM1F KO cells re-expressing mKate2 or re-expressing PPM1F-mKate2 cells, pre-treated with 5 µM DMSO or FRAX597 (PAK1-3 inhibitor) for 45 min in suspension before seeding onto 2 µg/ml FNIII9-12 for 1.5 h. Cells were fixed, stained for F-actin and the covered area was quantified in ImageJ. Boxes and whiskers indicate median with 95% confidence intervals from two independent experiments; n ≥ 30 cells; dots indicate outliers. Statistics was performed using one-way ANOVA, followed by post-hoc Bonferroni test, (***p < 0.001, ns = not significant). E Serum-starved cells as in (D) were pre-treated with 5 µM DMSO or FRAX597 (PAK1-3 inhibitor) for 45 min in suspension before seeded onto 2 µg/ml FNIII9-12 for 1.5 h. Cells were fixed and stained for active integrin β1. Cells were imaged by confocal microscopy. Representative pictures are shown; scale bar: 10 µm. See also Additional_File6 and Additional_File7
Fig. 9
Fig. 9
Presence of PPM1F determines the invasiveness of A172 cells in an in vivo CAM model. A Chicken chorioallantoic membrane (CAM) samples were inoculated on developmental day E9 with 1 × 10.6 A172 wildtype, A172 PPM1F KO, or A172 PPM1F KO cells re-expressing PPM1F-mKate2. Three days after tumor cell inoculation, the tissue was removed, fixed, paraffin-embedded, and 7 µm thick serial sections were made. Setions were H&E stained. Closed arrowheads point to tumor cells that have invaded the CAM mesoderm and locate in the vicinity of blood vessels, while the open arrowhead points to tumor cells remaining on top of the ectoderm; Shown are representative images; scale bar: 200 µm. B Representative serial sections from a CAM sample inoculated with A172 wildtype glioblastoma cells; arrowheads point to tissue-invaded cancer cells; scale bar: 200 µm. C Invasion depth was determined by measuring the orthogonal distance from the ectoderm (EC, red lines) reached by invasive cells in the mesoderm (M). For each series of serial sections, the highest invasion depth was determined; scale bar: 200 µm. D Invasion depth reached by the different cell lines was determined as in (C). Shown are individual values and means with 95% confidence intervals from n = 5 eggs per cell line. Statistics was performed using one-way ANOVA, followed by Bonferroni post-hoc test (*p < 0.05, ns = not significant). See also Additional_File5

Similar articles

References

    1. Hynes RO. Integrins: bidirectional, allosteric signaling machines. Cell. 2002;110(6):673–87. - PubMed
    1. Winograd-Katz SE, Fassler R, Geiger B, Legate KR. The integrin adhesome: from genes and proteins to human disease. Nat Rev Mol Cell Biol. 2014;15(4):273–88. - PubMed
    1. Xiong JP, Stehle T, Diefenbach B, Zhang R, Dunker R, Scott DL, et al. Crystal structure of the extracellular segment of integrin alpha Vbeta3. Science. 2001;294(5541):339–45. - PMC - PubMed
    1. Xiong JP, Stehle T, Zhang R, Joachimiak A, Frech M, Goodman SL, et al. Crystal structure of the extracellular segment of integrin alpha Vbeta3 in complex with an Arg-Gly-Asp ligand. Science. 2002;296(5565):151–5. - PubMed
    1. Shattil SJ, Kim C, Ginsberg MH. The final steps of integrin activation: the end game. Nat Rev Mol Cell Biol. 2010;11(4):288–300. - PMC - PubMed

LinkOut - more resources